Presentation esri 2012 Versailles
•Descargar como PPTX, PDF•
0 recomendaciones•438 vistas

Les 3 et 4 octobre derniers, l’équipe Weastflows de l’AURH s’est rendue à Versailles pour la conférence annuelle SIG 2012 d’ESRI

Recomendados
Recomendados
Más contenido relacionado
Similar a Presentation esri 2012 Versailles
Similar a Presentation esri 2012 Versailles (20)
Más de AURH - Agence d'urbanisme Le Havre - Estuaire de la Seine
Más de AURH - Agence d'urbanisme Le Havre - Estuaire de la Seine (20)
Presentation esri 2012 Versailles
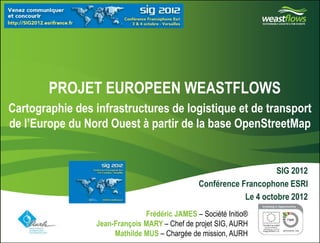
- 1. • PROJET EUROPEEN WEASTFLOWS Cartographie des infrastructures de logistique et de transport de l’Europe du Nord Ouest à partir de la base OpenStreetMap Partner logo(s) go here Frédéric JAMES – Société Initio® Jean-François MARY – Chef de projet SIG, AURH Delete this box and place partner logo(s) here on the master page Mathilde MUS – Chargée de mission, AURH SIG 2012 Conférence Francophone ESRI Le 4 octobre 2012
- 2. 1/ L’Agence d’Urbanisme de la Région du Havre et de l’Estuaire de la Seine • Crée en 1965 • Présidée par Antoine Rufenacht • Une équipe pluridisciplinaire de 30 collaborateurs • Missions : d’observation des territoires, d’études thématiques, projet de territoires… Partner logo(s) go here Delete this box and place partner logo(s) here on the master page
- 3. 1/ L’Agence d’Urbanisme de la Région du Havre et de l’Estuaire de la Seine • Un territoire d’études étendu du coeur métropole au Seine Gateway® Partner logo(s) go here Delete this box and place partner logo(s) here on the master page
- 4. 2/ Seine Gateway® • Un territoire à haut niveau de services connecté, au monde Partner logo(s) go here Delete this box and place partner logo(s) here on the master page
- 5. 3/ Le projet « WEASTFLOWS » • Programme européen Interreg IVB pour l’Europe du Nord Ouest • Durée du projet : 4 ans • 22 partenaires, 7 pays de l’Europe du Nord Ouest Objectif: Renforcer le développement des solutions de connectivité durable pour le transport de marchandises et la logistique au sein de l’ENO sur un axe vert Est-Ouest Partner logo(s) go here Delete this box and place partner logo(s) here on the master page
- 6. 4/ Rôle de l’AURH dans le projet 1/ Création de la base de données : « SIG Weastflows » 2/ Atlas : -Infrastructures existantes -Infrastructures projetées Partner logo(s) go here Delete this box and place partner logo(s) here on the master page
- 7. 4/ Rôle de l’AURH dans le projet 1/ Création de la base de données : « SIG Weastflows » 2/ Atlas : -Infrastructures existantes -Infrastructures projetées 3/ Analyse : -Infrastructures existantes -Prospective Partner logo(s) go here Delete this box and place partner logo(s) here on the master page
- 8. PROJET EUROPEEN WEASTFLOWS Cartographie des infrastructures de logistique et de transport de l’Europe du Nord Ouest à partir de la base OpenStreetMap De la donnée brute à l’Atlas… Partner logo(s) go here Delete this box and place partner logo(s) here on the master page
- 9. De la donnée brute à l’Atlas Données libres • Open Data Licence ODBL Open Database Licence • Couverture mondiale • Modèle unique et ouvert (tags) • Dynamisme • Suivi Francophone Merci à Christian Quest Partner logo(s) go here Etape 1 : OSM sets import Delete this box and place partner logo(s) here on the master page
- 10. De la donnée brute à l’Atlas Données libres • Chargement par Pays (x8) • Lots complets • Depuis le format OSM • Vers le DBMS PostgreSQL/PostGIS • Grâce à l’outil gratuit « osmosis »… • … et au savoir-faire d’Initio® (SSII Le Havre) • PostgreSQL 9.1 + PostGIS 1.5 • Schéma Pg (hstore…) • Syntaxe SQL • Scripts et automatisation Partner logo(s) go here Etape 1 : OSM sets import Delete this box and place partner logo(s) here on the master page www.openstreetmap.fr/ OSM osmosis www.postgis.fr
- 11. De la donnée brute à l’Atlas Etape 2 : Données sélectionnées et formatées selon le Data Catalog (Inspire) Données libres OSM sets import Chargement OSM Sélection et formatage Partner logo(s) go here Etape 1 : • Un Catalogue ou Dictionnaire de données Géographiques (GIS Data Dictionary) • Couches / Layers (ex : “RailwayLink”) • Attributs / Attributes (ex : “RAGAUGE” “ tn-ra:NominalTrackGauge”) • Valeurs / CodeLists (ex : “ C ” as “4,65 above the rail and 1,45 on either side”) Delete this box and place partner logo(s) here on the master page
- 12. De la donnée brute à l’Atlas Etape 2 : • Pour les réseaux, les éléments: Données sélectionnées et formatées selon le Data Catalog (Inspire) Données libres OSM sets import Chargement OSM Sélection et formatage Partner logo(s) go here Etape 1 : Delete this box and place partner logo(s) here on the master page • des « noeuds » (nodes) • des « tronçons » (links) • Mais aussi, les compositions : • des « ensembles » (sets) • des « sections » (sections) INSPIRE nous a aidé à la conception… Annexe « Transport & Network »
- 13. De la donnée brute à l’Atlas Etape 2 : Etape 3 : • Objets manquants: Données sélectionnées et formatées selon le Data Catalog (Inspire) Données libres OSM sets import Chargement OSM Sélection et formatage Partner logo(s) go here Etape 1 : Collaboration avec les partenaires Ajout de données Delete this box and place partner logo(s) here on the master page essentiellement des noeuds appui sur: • des données externes (TEN-T, Dictionnaires internationaux, nationaux,…) • Les Partenaires/Aires d’intérêt
- 14. De la donnée brute à l’Atlas Etape 2 : Etape 3 : • Attributs manquants ou Données sélectionnées et formatées selon le Data Catalog (Inspire) Données libres OSM sets import Chargement OSM Sélection et formatage Partner logo(s) go here Etape 1 : Collaboration avec les partenaires Ajout de données Delete this box and place partner logo(s) here on the master page incomplets : • Ex: « ROSPEEDLIM » (vitesse maximale sur les routes) • Ex: « IWCEMT » (gabarit des voies navigables selon nomenclature) • ...
- 15. De la donnée brute à l’Atlas Etape 2 : Etape 3 : Données sélectionnées et formatées selon le Data Catalog (Inspire) Données libres OSM sets import Chargement OSM Sélection et formatage Partner logo(s) go here Etape 1 : Collaboration avec les partenaires Ajout de données Classification (TEN-T) Classification des données (European local) Delete this box and place partner logo(s) here on the master page Etape 4 : • A partir de la classification « TEN-T » • En utilisant les « relations »
- 16. De la donnée brute à l’Atlas Données sélectionnées et formatées selon le Data Catalog (Inspire) Partner logo(s) go here Etape 1 : Collaboration avec les partenaires Classification des données (European local) Delete this box and place partner logo(s) here on the master page Consolidation des informations dans le SIG OSM sets import Chargement OSM Sélection et formatage Ajout de données Classification (TEN-T) GIS dataset v1 Données libres Etape 2 : Etape 3 Etape 4 : Etape 5 :
- 17. Etape 5 GIS Dataset (v1) Status [août 2012] Layer Volumetry Sources Comment Port 370 (62) Partner logo(s) go here Delete this box and place partner logo(s) here on the master page TEN-T, Partners (OSM: 3%) Organism resolution Airport 100 (34) TEN-T, Partners (OSM:10%) Organism resolution RailwayNode 129 (44) TEN-T, Partners (OSM:15%) Need to be added (TEN-T) InlandWaterwayLink 5 888 (2 963) (OSM:99%) RailwayLink 82 648 (62 188) (OSM:100%) Need to be added (regional level) RoadLink 58 926 (55 487) (OSM:100%) Need to be added (national and regional level) FerryCrossing 1 773 (?) (OSM:99%) Need to be classified NUTS (0-1-2-3) 1 931 (616) ESRI NUTS 2006 (2010 upgrade)
- 18. De la donnée brute à l’Atlas Données sélectionnées et formatées selon le Data Catalog (Inspire) Partner logo(s) go here Etape 1 : Collaboration avec les partenaires Classification des données (European local) Delete this box and place partner logo(s) here on the master page Consolidation des informations dans le SIG Premières réalisations cartographiques OSM sets import Chargement OSM Sélection et formatage Ajout de données Classification (TEN-T) GIS dataset v1 Atlas (V1) Données libres Etape 2 : Etape 3 Etape 4 : Etape 5 : Etape 6 :
- 19. PROJET EUROPEEN WEASTFLOWS Cartographie des infrastructures de logistique et de transport de l’Europe du Nord Ouest à partir de la base OpenStreetMap Atlas – un premier draft Partner logo(s) go here Delete this box and place partner logo(s) here on the master page
- 35. PROJET EUROPEEN WEASTFLOWS Cartographie des infrastructures de logistique et de transport de l’Europe du Nord Ouest à partir de la base OpenStreetMap L’Atlas n’est qu’une étape… Weastflows continue sur notre blog : Partner logo(s) go here Delete this box and place partner logo(s) here on the master page http://www.aurhinweastflows.com
- 36. Merci de votre attention L’équipe WEASTflows de l’AURH : Juliette Duszynski, j.duszynski@aurh.fr Mathilde MUS, m.mus@aurh.fr Jean-François Mary, jf.mary@aurh.fr Frédéric James, Société Initio®, Le Havre (76) Pour en savoir plus consulter notre blog ! http://www.aurhinweastflows.com/ Partner logo(s) go here avec : Delete this box and place partner logo(s) here on the master page
Notas del editor
- Association loi 1901 créée en 1965, Présidé par Antoine Rufenacht Membre de l’AURH : Ville du Havre, agglomération havraise, région Haute-Normandie, Départements Eure et Seine-Maritime, CCI du Havre, Port du Havre, de Rouen… Une équipe pluridisciplinaire de 30 collaborateurs: géographes, urbanistes, architectes, paysagistes, géomaticiens, cartographe, économistes, démographes… Missions: observations, projet de territoires, études thématiques, Projet Grand Paris, Axe Seine
- Un territoire étendu Des projets multi-échelle
- Disposer d’un SIG à l’échelle du territoire de l’agence …etc
- Programme INTERREG IV B Europe du Nord Ouest Durée du projet 4 ans 22 partenaires, 7 pays de l’Europe du Nord Ouest Objectif: Renforcer le développement des solutions de connectivité durable pour le transport de marchandises et la logistique au sein de l’ENO sur un axe vert Est-Ouest
- L’action principale de l’agence intervient dans l’action 1 du programme, Il s’agit de réaliser la base de données SIG du projet afin: Cartographier les infrastructures de transport pour l’Europe du Nord Ouest De donner aux partenaires la base du travail En terme de cartographie, le travail de l’agence repose sur la réalisation: d’un « Atlas » des infrastructures de transport, premier livrable du projet, support pour les partenaires et les autres actions Logique à double échelle de l’atlas: Globale (europe du nord ouest) Régionale (aire d’intérêt des partenaires) Double niveau d’information: Infrastructures existantes Infrastructures en projet Après la cartographie: analyse prospective: Relations entre les régions partenaires (analyse des flux et de leur volume) Liens manquants et points de congestion des réseaux
- L’action principale de l’agence intervient dans l’action 1 du programme, Il s’agit de réaliser la base de données SIG du projet afin: Cartographier les infrastructures de transport pour l’Europe du Nord Ouest De donner aux partenaires la base du travail En terme de cartographie, le travail de l’agence repose sur la réalisation: d’un « Atlas » des infrastructures de transport, premier livrable du projet, support pour les partenaires et les autres actions Logique à double échelle de l’atlas: Globale (europe du nord ouest) Régionale (aire d’intérêt des partenaires) Double niveau d’information: Infrastructures existantes Infrastructures en projet Après la cartographie: analyse prospective: Relations entre les régions partenaires (analyse des flux et de leur volume) Liens manquants et points de congestion des réseaux
- GIS Methodology and Review –Comment catalogue. This atlas is supported by a GIS 1°) Initially, the choice of an « Open Data » set, Open Street Map (Licence CC-BY-SA changing in OpenDB) OSM is a World geographic database, very dynamic (eight years) and precise (quite topographic) The database was imported for the 8 countries (countries from NW Europe and Switzerland) Date of the dataset : May two thousand twelve on fourteen(05-14-2012) Even if it is a lake of values in many case, OSM dataset is coherent and well used. We should contribute by enriching it. 2°) From these 8 datasets The information is formatted in an unique geographic database according to the data catalogue INSPIRE classification - By layer - By attributes - By values 3°) Some missing data are added OSM is poor for the intermodal nodes (ports…) OSM is not complete for administrative areas – Countries, NUTS statistical areas were provided by ESRI* (se renseigner sur le niveau de licence si question) There is a lake of values for many attributes As Juliette said, Partners are solicited for their area of interest to help us to complete the data (the data stays « basic » out of an area of interest) 4°) the main layers are classified according to the TEN-T Agency European level : if the information is the CORE network or belong to an European priority projects National level : the other information provided by the TEN-T Agency Regional level : information out of scope of the TEN-T but relevant at the regional scale Local level : other information 5°) The GIS integration is an on-going process 6°) The first maps – shown after – must be considered as a step. Possible question: why do you not use TEN-T data directly? For three good raisons: not free data, non availability before September, bad geometry. Possible question about the licensing CC-BY-SA.
- GIS Methodology and Review –Comment catalogue. This atlas is supported by a GIS 1°) Initially, the choice of an « Open Data » set, Open Street Map (Licence CC-BY-SA changing in OpenDB) OSM is a World geographic database, very dynamic (eight years) and precise (quite topographic) The database was imported for the 8 countries (countries from NW Europe and Switzerland) Date of the dataset : May two thousand twelve on fourteen(05-14-2012) Even if it is a lake of values in many case, OSM dataset is coherent and well used. We should contribute by enriching it. 2°) From these 8 datasets The information is formatted in an unique geographic database according to the data catalogue INSPIRE classification - By layer - By attributes - By values 3°) Some missing data are added OSM is poor for the intermodal nodes (ports…) OSM is not complete for administrative areas – Countries, NUTS statistical areas were provided by ESRI* (se renseigner sur le niveau de licence si question) There is a lake of values for many attributes As Juliette said, Partners are solicited for their area of interest to help us to complete the data (the data stays « basic » out of an area of interest) 4°) the main layers are classified according to the TEN-T Agency European level : if the information is the CORE network or belong to an European priority projects National level : the other information provided by the TEN-T Agency Regional level : information out of scope of the TEN-T but relevant at the regional scale Local level : other information 5°) The GIS integration is an on-going process 6°) The first maps – shown after – must be considered as a step. Possible question: why do you not use TEN-T data directly? For three good raisons: not free data, non availability before September, bad geometry. Possible question about the licensing CC-BY-SA.
- GIS Methodology and Review –Comment catalogue. This atlas is supported by a GIS 1°) Initially, the choice of an « Open Data » set, Open Street Map (Licence CC-BY-SA changing in OpenDB) OSM is a World geographic database, very dynamic (eight years) and precise (quite topographic) The database was imported for the 8 countries (countries from NW Europe and Switzerland) Date of the dataset : May two thousand twelve on fourteen(05-14-2012) Even if it is a lake of values in many case, OSM dataset is coherent and well used. We should contribute by enriching it. 2°) From these 8 datasets The information is formatted in an unique geographic database according to the data catalogue INSPIRE classification - By layer - By attributes - By values 3°) Some missing data are added OSM is poor for the intermodal nodes (ports…) OSM is not complete for administrative areas – Countries, NUTS statistical areas were provided by ESRI* (se renseigner sur le niveau de licence si question) There is a lake of values for many attributes As Juliette said, Partners are solicited for their area of interest to help us to complete the data (the data stays « basic » out of an area of interest) 4°) the main layers are classified according to the TEN-T Agency European level : if the information is the CORE network or belong to an European priority projects National level : the other information provided by the TEN-T Agency Regional level : information out of scope of the TEN-T but relevant at the regional scale Local level : other information 5°) The GIS integration is an on-going process 6°) The first maps – shown after – must be considered as a step. Possible question: why do you not use TEN-T data directly? For three good raisons: not free data, non availability before September, bad geometry. Possible question about the licensing CC-BY-SA.
- GIS Methodology and Review –Comment catalogue. This atlas is supported by a GIS 1°) Initially, the choice of an « Open Data » set, Open Street Map (Licence CC-BY-SA changing in OpenDB) OSM is a World geographic database, very dynamic (eight years) and precise (quite topographic) The database was imported for the 8 countries (countries from NW Europe and Switzerland) Date of the dataset : May two thousand twelve on fourteen(05-14-2012) Even if it is a lake of values in many case, OSM dataset is coherent and well used. We should contribute by enriching it. 2°) From these 8 datasets The information is formatted in an unique geographic database according to the data catalogue INSPIRE classification - By layer - By attributes - By values 3°) Some missing data are added OSM is poor for the intermodal nodes (ports…) OSM is not complete for administrative areas – Countries, NUTS statistical areas were provided by ESRI* (se renseigner sur le niveau de licence si question) There is a lake of values for many attributes As Juliette said, Partners are solicited for their area of interest to help us to complete the data (the data stays « basic » out of an area of interest) 4°) the main layers are classified according to the TEN-T Agency European level : if the information is the CORE network or belong to an European priority projects National level : the other information provided by the TEN-T Agency Regional level : information out of scope of the TEN-T but relevant at the regional scale Local level : other information 5°) The GIS integration is an on-going process 6°) The first maps – shown after – must be considered as a step. Possible question: why do you not use TEN-T data directly? For three good raisons: not free data, non availability before September, bad geometry. Possible question about the licensing CC-BY-SA.
- GIS Methodology and Review –Comment catalogue. This atlas is supported by a GIS 1°) Initially, the choice of an « Open Data » set, Open Street Map (Licence CC-BY-SA changing in OpenDB) OSM is a World geographic database, very dynamic (eight years) and precise (quite topographic) The database was imported for the 8 countries (countries from NW Europe and Switzerland) Date of the dataset : May two thousand twelve on fourteen(05-14-2012) Even if it is a lake of values in many case, OSM dataset is coherent and well used. We should contribute by enriching it. 2°) From these 8 datasets The information is formatted in an unique geographic database according to the data catalogue INSPIRE classification - By layer - By attributes - By values 3°) Some missing data are added OSM is poor for the intermodal nodes (ports…) OSM is not complete for administrative areas – Countries, NUTS statistical areas were provided by ESRI* (se renseigner sur le niveau de licence si question) There is a lake of values for many attributes As Juliette said, Partners are solicited for their area of interest to help us to complete the data (the data stays « basic » out of an area of interest) 4°) the main layers are classified according to the TEN-T Agency European level : if the information is the CORE network or belong to an European priority projects National level : the other information provided by the TEN-T Agency Regional level : information out of scope of the TEN-T but relevant at the regional scale Local level : other information 5°) The GIS integration is an on-going process 6°) The first maps – shown after – must be considered as a step. Possible question: why do you not use TEN-T data directly? For three good raisons: not free data, non availability before September, bad geometry. Possible question about the licensing CC-BY-SA.
- GIS Methodology and Review –Comment catalogue. This atlas is supported by a GIS 1°) Initially, the choice of an « Open Data » set, Open Street Map (Licence CC-BY-SA changing in OpenDB) OSM is a World geographic database, very dynamic (eight years) and precise (quite topographic) The database was imported for the 8 countries (countries from NW Europe and Switzerland) Date of the dataset : May two thousand twelve on fourteen(05-14-2012) Even if it is a lake of values in many case, OSM dataset is coherent and well used. We should contribute by enriching it. 2°) From these 8 datasets The information is formatted in an unique geographic database according to the data catalogue INSPIRE classification - By layer - By attributes - By values 3°) Some missing data are added OSM is poor for the intermodal nodes (ports…) OSM is not complete for administrative areas – Countries, NUTS statistical areas were provided by ESRI* (se renseigner sur le niveau de licence si question) There is a lake of values for many attributes As Juliette said, Partners are solicited for their area of interest to help us to complete the data (the data stays « basic » out of an area of interest) 4°) the main layers are classified according to the TEN-T Agency European level : if the information is the CORE network or belong to an European priority projects National level : the other information provided by the TEN-T Agency Regional level : information out of scope of the TEN-T but relevant at the regional scale Local level : other information 5°) The GIS integration is an on-going process 6°) The first maps – shown after – must be considered as a step. Possible question: why do you not use TEN-T data directly? For three good raisons: not free data, non availability before September, bad geometry. Possible question about the licensing CC-BY-SA.
- GIS Methodology and Review –Comment catalogue. This atlas is supported by a GIS 1°) Initially, the choice of an « Open Data » set, Open Street Map (Licence CC-BY-SA changing in OpenDB) OSM is a World geographic database, very dynamic (eight years) and precise (quite topographic) The database was imported for the 8 countries (countries from NW Europe and Switzerland) Date of the dataset : May two thousand twelve on fourteen(05-14-2012) Even if it is a lake of values in many case, OSM dataset is coherent and well used. We should contribute by enriching it. 2°) From these 8 datasets The information is formatted in an unique geographic database according to the data catalogue INSPIRE classification - By layer - By attributes - By values 3°) Some missing data are added OSM is poor for the intermodal nodes (ports…) OSM is not complete for administrative areas – Countries, NUTS statistical areas were provided by ESRI* (se renseigner sur le niveau de licence si question) There is a lake of values for many attributes As Juliette said, Partners are solicited for their area of interest to help us to complete the data (the data stays « basic » out of an area of interest) 4°) the main layers are classified according to the TEN-T Agency European level : if the information is the CORE network or belong to an European priority projects National level : the other information provided by the TEN-T Agency Regional level : information out of scope of the TEN-T but relevant at the regional scale Local level : other information 5°) The GIS integration is an on-going process 6°) The first maps – shown after – must be considered as a step. Possible question: why do you not use TEN-T data directly? For three good raisons: not free data, non availability before September, bad geometry. Possible question about the licensing CC-BY-SA.
- GIS Methodology and Review –Comment catalogue. This atlas is supported by a GIS 1°) Initially, the choice of an « Open Data » set, Open Street Map (Licence CC-BY-SA changing in OpenDB) OSM is a World geographic database, very dynamic (eight years) and precise (quite topographic) The database was imported for the 8 countries (countries from NW Europe and Switzerland) Date of the dataset : May two thousand twelve on fourteen(05-14-2012) Even if it is a lake of values in many case, OSM dataset is coherent and well used. We should contribute by enriching it. 2°) From these 8 datasets The information is formatted in an unique geographic database according to the data catalogue INSPIRE classification - By layer - By attributes - By values 3°) Some missing data are added OSM is poor for the intermodal nodes (ports…) OSM is not complete for administrative areas – Countries, NUTS statistical areas were provided by ESRI* (se renseigner sur le niveau de licence si question) There is a lake of values for many attributes As Juliette said, Partners are solicited for their area of interest to help us to complete the data (the data stays « basic » out of an area of interest) 4°) the main layers are classified according to the TEN-T Agency European level : if the information is the CORE network or belong to an European priority projects National level : the other information provided by the TEN-T Agency Regional level : information out of scope of the TEN-T but relevant at the regional scale Local level : other information 5°) The GIS integration is an on-going process 6°) The first maps – shown after – must be considered as a step. Possible question: why do you not use TEN-T data directly? For three good raisons: not free data, non availability before September, bad geometry. Possible question about the licensing CC-BY-SA.
- The information was loaded for nodes and links according the Data Catalogue. It was been slightly adapted to fit to the atlas, available soon on Weastflows extranet website. The number indicated the overall whereas the number between parenthesis indicated the main network or the NW Europe in case of NUTS OSM supplies the exhaustive data for the links, but not for the nodes. For the nodes, the main terminal carries the organisation data. Bing Maps® (Microsoft®) offers the possibility to digitize the geographic information represented on the aerial image (some OSM contributors use this procedure). For the links, the information will be generalized, simplified, in sections to carry the data. The Motorway of the Sea and the Short Sea Shipping are completely missing (NavigableChannelOffshoreSet) For the ports and airports, the main terminal are considered. For the railway nodes, the layer is not completed at this time. InlandwaterwayLink is OK RailwayLink can be completed on a regional scale. RoadLink must be completed for the national scale and in the Nord-east Germany Ferry must be classified. All links must be completed marginally to become a navigable set (network). The Atlas is a step, which helps us to complete this geographic information. Possible extensions: ( 1 - Hierarchy with a specific attribute, “level”: European, national, regional, local. 2 - Intermodal node: at first portnodes (sea/iww/rail/road/pipe), then railwaynodes (rail/road) 3 - Groups for the nodes: establishment/implantation, organization, cluster 4 - Groups for the links: links, sections, sets
- GIS Methodology and Review –Comment catalogue. This atlas is supported by a GIS 1°) Initially, the choice of an « Open Data » set, Open Street Map (Licence CC-BY-SA changing in OpenDB) OSM is a World geographic database, very dynamic (eight years) and precise (quite topographic) The database was imported for the 8 countries (countries from NW Europe and Switzerland) Date of the dataset : May two thousand twelve on fourteen(05-14-2012) Even if it is a lake of values in many case, OSM dataset is coherent and well used. We should contribute by enriching it. 2°) From these 8 datasets The information is formatted in an unique geographic database according to the data catalogue INSPIRE classification - By layer - By attributes - By values 3°) Some missing data are added OSM is poor for the intermodal nodes (ports…) OSM is not complete for administrative areas – Countries, NUTS statistical areas were provided by ESRI* (se renseigner sur le niveau de licence si question) There is a lake of values for many attributes As Juliette said, Partners are solicited for their area of interest to help us to complete the data (the data stays « basic » out of an area of interest) 4°) the main layers are classified according to the TEN-T Agency European level : if the information is the CORE network or belong to an European priority projects National level : the other information provided by the TEN-T Agency Regional level : information out of scope of the TEN-T but relevant at the regional scale Local level : other information 5°) The GIS integration is an on-going process 6°) The first maps – shown after – must be considered as a step. Possible question: why do you not use TEN-T data directly? For three good raisons: not free data, non availability before September, bad geometry. Possible question about the licensing CC-BY-SA.