N.F.L. Conversion Bowl 2014 (marketing infographic)
•
4 recomendaciones•462 vistas

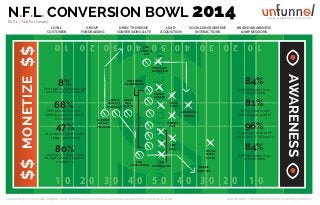
Can brand awareness and engagement objectives live in the same playing field as monetary conversions? This infographic shows how both sides need to work together on the same team - both have merit and a balanced approach is key to solving this historical battle. We are challenging this traditional grouping of dispirit and "siloed" goals - N.F.L (Not For Losers) Conversion Bowl 2014 .
Denunciar
Compartir
Denunciar
Compartir
Descargar para leer sin conexión
Recomendados
Recomendados
Más contenido relacionado
Más de unfunnel
Más de unfunnel (20)
YouTube Traffic Building Campaign Checklist - Gary Vaynerchuk
YouTube Traffic Building Campaign Checklist - Gary Vaynerchuk
2018 Product Launch Marketing Budget [Excel template]
2018 Product Launch Marketing Budget [Excel template]
The Ultimate Niche Market Research Blueprint for 2018
The Ultimate Niche Market Research Blueprint for 2018
2018 Product Launch Campaign Planner Template [Excel Template]
2018 Product Launch Campaign Planner Template [Excel Template]
THE SCIENCE BEHIND EFFECTIVE FACEBOOK AD CAMPAIGNS
THE SCIENCE BEHIND EFFECTIVE FACEBOOK AD CAMPAIGNS
SOCIAL PROSPECTING WORKBOOK: HOW TO USE SOCIAL MEDIA TO FIND NEW LEADS
SOCIAL PROSPECTING WORKBOOK: HOW TO USE SOCIAL MEDIA TO FIND NEW LEADS
Inbound Selling Machine [How to Use Hubspot to Create An Invisible Sales Funnel]
Inbound Selling Machine [How to Use Hubspot to Create An Invisible Sales Funnel]
Último
Último (20)
Micro-Choices, Max Impact Personalizing Your Journey, One Moment at a Time.pdf
Micro-Choices, Max Impact Personalizing Your Journey, One Moment at a Time.pdf
Distribution Ad Platform_ The Role of Distribution Ad Network.pdf
Distribution Ad Platform_ The Role of Distribution Ad Network.pdf
Martal Group - B2B Lead Gen Agency - Onboarding Overview
Martal Group - B2B Lead Gen Agency - Onboarding Overview
Choosing the Right White Label SEO Services to Boost Your Agency's Growth.pdf
Choosing the Right White Label SEO Services to Boost Your Agency's Growth.pdf
Press Release Distribution Evolving with Digital Trends.pdf
Press Release Distribution Evolving with Digital Trends.pdf
VIP Call Girls Dongri WhatsApp +91-9833363713, Full Night Service
VIP Call Girls Dongri WhatsApp +91-9833363713, Full Night Service
FULL ENJOY Call Girls In Majnu.Ka.Tilla Delhi Contact Us 8377877756
FULL ENJOY Call Girls In Majnu.Ka.Tilla Delhi Contact Us 8377877756
Unraveling the Mystery of The Circleville Letters.pptx
Unraveling the Mystery of The Circleville Letters.pptx
Elevate Your Advertising Game: Introducing Billion Broadcaster Lift Advertising
Elevate Your Advertising Game: Introducing Billion Broadcaster Lift Advertising
TAM_AdEx-Cross_Media_Report-Banking_Finance_Investment_(BFSI)_2023.pdf
TAM_AdEx-Cross_Media_Report-Banking_Finance_Investment_(BFSI)_2023.pdf
Unveiling the Legacy of the Rosetta stone A Key to Ancient Knowledge.pptx
Unveiling the Legacy of the Rosetta stone A Key to Ancient Knowledge.pptx
10 Email Marketing Best Practices to Increase Engagements, CTR, And ROI
10 Email Marketing Best Practices to Increase Engagements, CTR, And ROI
N.F.L. Conversion Bowl 2014 (marketing infographic)
- 1. N.F.L. CONVERSION BOWL 2014 AGILE MARKETING IN MOTION (N.F.L. = Not For Losers) SOCIAL ENGAGEMENT INTERACTIONS 4 0 5 0 www.unfunnel.com BRAND AWARENESS & IMPRESSIONS PAID SEARCH ADS 4 0 3 0 2 0 1 0 FACEBOOK PROMOTION 8% ONE TO ONE REMARKETING Average conversion rate (visit to add to basket) 68% B2B businesses use landing pages for lead conversion 47% of nurtured leads make larger purchases 80% savings on direct mail budget using triggered marketing DIRECT eCOMM PRODUCT MAIL PURCHASE APPEAL MONTHLY LOYALTY PROGRAM 84% B2B Marketers use Social Media DISPLAY BANNER 81% ONLINE VIDEO of Marketers rate their blog as useful AWARENESS BANNER 96% WEBSITE VISIT Measure number of social fans & followers CRM EMAIL PAID SEO SOCIAL MEDIA OPTIMIZATION SOCIAL MEDIA OPT-IN 84% B2B Marketers use social media AWARENESS $$ MONETIZE $$ LEAD ACQUISTION DIRECT REVENUE CONVERSIONS & LTV 2 0 3 0 GROUP FUNDRAISING 1 0 LOYAL CUSTOMER MOBILE EVENT APP 10 20 30 40 50 40 30 20 10 source: http:/ /www.smartinsights.com/ecommerce/ecommerce-analytics/ecommerce-conversion-rates/ source: http:/ /www.hubspot.com/marketing-statistics