This method determines the vitamin C concentration
in a solution by a redox titration using iodine. Vitamin
C, more properly called ascorbic acid, is an essential
antioxidant needed by the human body (see additional
notes). As the iodine is added during the titration, the
ascorbic acid is oxidised to dehydroascorbic acid, while
the iodine is reduced to iodide ions.
a
Call Girls in Delhi Triveni Complex Escort Service(🔝))/WhatsApp 97111⇛47426
vitaminc_iodine.pdf
1. College of Science
Safety
Lab coats, safety glasses and enclosed footwear must
be worn at all times in the laboratory.
Introduction
This method determines the vitamin C concentration
in a solution by a redox titration using iodine. Vitamin
C, more properly called ascorbic acid, is an essential
antioxidant needed by the human body (see additional
notes). As the iodine is added during the titration, the
ascorbic acid is oxidised to dehydroascorbic acid, while
the iodine is reduced to iodide ions.
ascorbic acid + I2
→ 2 I−
+ dehydroascorbic acid
Due to this reaction, the iodine formed is immediately
reduced to iodide as long as there is any ascorbic acid
present. Once all the ascorbic acid has been oxidised,
the excess iodine is free to react with the starch
indicator, forming the blue-black starch-iodine complex.
This is the endpoint of the titration.
The method is suitable for use with vitamin C tablets,
fresh or packaged fruit juices and solid fruits and
vegetables.
NB: This method is more straight forward than the
alternative method using potassium iodate, but as
the potassium iodate solution is more stable than the
iodine as a primary standard, the alternative method is
more reliable.
Equipment Needed
burette and stand
100 mL or 200 mL volumetric flask
20 mL pipette
10 mL and 100 mL measuring cylinders
250 mL conical flasks
Solutions Needed
Iodine solution: (0.005 mol L−1
). Weigh 2 g of potassium
iodide into a 100 mL beaker. Weigh 1.3 g of iodine and
add it into the same beaker. Add a few mL of distilled
water and swirl for a few minutes until iodine is
dissolved. Transfer iodine solution to a 1 L volumetric
flask, making sure to rinse all traces of solution into the
volumetric flask using distilled water. Make the solution
up to the 1 L mark with distilled water.
Starch indicator solution: (0.5%).Weigh 0.25 g of
soluble starch and add it to 50 mL of near boiling water
in a 100 mL conical flask.Stir to dissolve and cool before
using.
(Redox Titration Using Iodine Solution)
DeterminationofVitaminCConcentration
byTitration
(Redox Titration Using Iodine Solution)
Introduction
This method determines the vitamin C concentration
in a solution by a redox titration using iodine. Vitamin
C, more properly called ascorbic acid, is an essential
antioxidant needed by the human body (see additional
notes). As the iodine is added during the titration, the
ascorbic acid is oxidised to dehydroascorbic acid, while
the iodine is reduced to iodide ions.
ascorbic acid + I2
→ 2 I−
+ dehydroascorbic acid
Due to this reaction, the iodine formed is immediately
reduced to iodide as long as there is any ascorbic acid
present. Once all the ascorbic acid has been oxidised,
the excess iodine is free to react with the starch
indicator, forming the blue-black starch-iodine complex.
This is the endpoint of the titration.
The method is suitable for use with vitamin C tablets,
fresh or packaged fruit juices and solid fruits and
vegetables.
NB: This method is more straight forward than the
alternative method using potassium iodate, but as
the potassium iodate solution is more stable than the
iodine as a primary standard, the alternative method is
more reliable.
Equipment Needed
burette and stand
100 mL or 200 mL volumetric flask
20 mL pipette
10 mL and 100 mL measuring cylinders
250 mL conical flasks
Solutions Needed
Iodine solution: (0.005 mol L−1
). Weigh 2 g of potassium
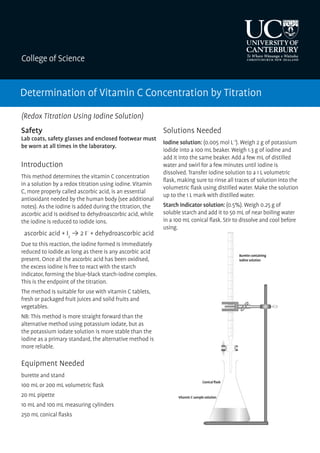
Burette containing
iodine solution
Conicalflask
Vitamin C sample solution
Determination of Vitamin C Concentration by Titration
2. Method
Sample Preparation
For vitamin C tablets: Dissolve a single tablet in 200 mL
of distilled water (in a volumetric flask if possible).
For fresh fruit juice: Strain the juice through
cheesecloth to remove seeds and pulp which may block
pipettes.
For packaged fruit juice: This may also need to be
strained through cheesecloth if it contains a lot of pulp
or seeds.
For fruits and vegetables: Cut a 100 g sample into small
pieces and grind in a mortar and pestle. Add 10 mL
portions of distilled water several times while grinding
the sample, each time decanting off the liquid extract
into a 100 mL volumetric flask. Finally, strain the ground
fruit/vegetable pulp through cheesecloth, rinsing the
pulp with a few 10 mL portions of water and collecting
all filtrate and washings in the volumetric flask. Make
the extracted solution up to 100 mL with distilled water.
Alternatively the 100 g sample of fruit or vegetable
may be blended in a food processor together with
about 50 mL of distilled water. After blending, strain
the pulp through cheesecloth, washing it with a few
10mL portions of distilled water, and make the extracted
solution up to 100 mL in a volumetric flask.
Titration
1. Pipette a 20 mL aliquot of the sample solution into
a 250 mL conical flask and add about 150 mL of
distilled water and 1 mL of starch indicator solution.
2. Titrate the sample with 0.005 mol L−1
iodine solution.
The endpoint of the titration is identified as the first
permanent trace of a dark blue-black colour due to
the starch-iodine complex.
3. Repeat the titration with further aliquots of sample
solution until you obtain concordant results (titres
agreeing within 0.1 mL).
Calculations
1. Calculate the average volume of iodine solution used
from your concordant titres.
2. Calculate the moles of iodine reacting.
3. Using the equation of the titration (below) determine
the number of moles of ascorbic acid reacting.
ascorbic acid + I2
→ 2 I−
+ dehydroascorbic acid
4. Calculate the concentration in mol L−1
of ascorbic
acid in the solution obtained from fruit/vegetable/
juice. Also, calculate the concentration, in mg/100mL
or mg/100g of ascorbic acid, in the sample of fruit/
vegetable/juice.
Additional Notes
1. Iodine stains both skin and clothing so proper care is
advised. If staining does occur, alcohol may remove
skin stains and cleaners are available for fabric stains.
2. Vitamin C, or ascorbic acid, is a water soluble
antioxidant that plays a vital role in protecting the
body from infection and disease. It is not synthesised
by the human body and therefore must be
acquired from dietary sources – primarily fruits and
vegetables. The chemical structure and antioxidant
(reducing) action of ascorbic acid are illustrated in
the redox half equation below:
3. The concentration of the prepared iodine solution
can be more accurately determined by titration with
a standard solution of ascorbic acid or a standard
solution of potassium thiosulfate using a starch
indicator. This should be done if possible as iodine
solutions can be unstable.
4. The average titre volume should ideally be in the
range of 10 – 30 mL. If the titre required for a 20 mL
aliquot of sample solution is well outside this range
then a larger or smaller aliquot volume should be
chosen. If the volume of the titre is too low, dilute
the standard. If the titre volume is too high, dilute
the sample.
5. Ascorbic acid is susceptible to oxidation by
atmospheric oxygen over time. For this reason, the
samples should be prepared immediately before
the titrations. However, if the samples have to be
prepared several hours earlier, oxidation can be
minimised by the addition of a small amount of
oxalic acid (eg 1 g oxalic acid per 100 mL of sample
solution).
6. Identification of the endpoint in this titration is
significantly affected by the colouration of the
sample solution used. If the solutions are colourless
or are pale in colour, there is no problem identifying
Starch indicator solution: (0.5%). Weigh 0.25 g of
soluble starch and add it to 50 mL of near boiling water
in a 100 mL conical flask. Stir to dissolve and cool before
using.
Method
Sample Preparation
For vitamin C tablets: Dissolve a single tablet in 200 mL
of distilled water (in a volumetric flask if possible).
For fresh fruit juice: Strain the juice through cheese
cloth to remove seeds and pulp which may block
pipettes.
For packaged fruit juice: This may also need to be
strained through cheese cloth if it contains a lot of pulp
or seeds.
For fruits and vegetables: Cut a 100 g sample into small
pieces and grind in a mortar and pestle. Add 10 mL
portions of distilled water several times while grinding
the sample, each time decanting off the liquid extract
into a 100 mL volumetric flask. Finally, strain the ground
fruit/vegetable pulp through cheese cloth, rinsing the
pulp with a few 10 mL portions of water and collecting
all filtrate and washings in the volumetric flask. Make
the extracted solution up to 100 mL with distilled water.
Alternatively the 100 g sample of fruit or vegetable may
be blended in a food processor together with about
50 mL of distilled water. After blending, strain the
pulp through cheese cloth, washing it with a few 10
mL portions of distilled water, and make the extracted
solution up to 100 mL in a volumetric flask.
Titration
1. Pipette a 20 mL aliquot of the sample solution into
a 250 mL conical flask and add about 150 mL of distilled
water and 1 mL of starch indicator solution.
2. Titrate the sample with 0.005 mol L−1
iodine
solution. The endpoint of the titration is identified as
the first permanent trace of a dark blue-black colour due
to the starch-iodine complex.
3. Repeat the titration with further aliquots of sample
solution until you obtain concordant results (titres
agreeing within 0.1 mL).
Calculations
1. Calculate the average volume of iodine solution
used from your concordant titres.
2. Calculate the moles of iodine reacting.
3. Using the equation of the titration (below)
determine the number of moles of ascorbic acid
reacting.
ascorbic acid + I2
→ 2 I−
+ dehydroascorbic acid
4. Calculate the concentration in mol L−1
of ascorbic
acid in the solution obtained from fruit/vegetable/juice.
Also, calculate the concentration, in mg/100mL or mg/
100g of ascorbic acid in the sample of fruit/vegetable/
juice.
Additional Notes
1. Iodine stains both skin and clothing so proper care
is advised. If staining does occur, alcohol may remove
skin stains and cleaners are available for fabric stains.
2. Vitamin C, or ascorbic acid, is a water soluble
antioxidant that plays a vital role in protecting the body
from infection and disease. It is not synthesised by
the human body and therefore must be acquired from
dietary sources – primarily fruits and vegetables. The
chemical structure and antioxidant (reducing) action of
ascorbic acid are illustrated in the redox half equation
below:
3. The concentration of the prepared iodine solution
can be more accurately determined by titration with a
standard solution of ascorbic acid or a standard solution
of potassium thiosulfate using a starch indicator. This
should be done if possible as iodine solutions can be
unstable.
4. The average titre volume should ideally be in
the range of 10 – 30 mL. If the titre required for a 20
mL aliquot of sample solution is well outside this
range then a larger or smaller aliquot volume should
be chosen. If the volume of the titre is too low, dilute
the standard. If the titre volume is too high, dilute the
sample.
5. Ascorbic acid is susceptible to oxidation by
atmospheric oxygen over time. For this reason, the
samples should be prepared immediately before the
titrations. However, if the samples have to be prepared
several hours earlier, oxidation can be minimised by the
addition of a small amount of oxalic acid (eg 1 g oxalic
acid per 100 mL of sample solution).
6. Identification of the endpoint in this titration is
significantly affected by the colouration of the sample
solution used. If the solutions are colourless or are pale
O
HO
HO
O
OH
HO
O
HO
HO
O
O
O
+ 2H+
+ 2e-
oxidation
reduction
ascorbic acid dehydroascorbicacid
3. the endpoint. For strongly coloured juices there can
be a problem with the endpoint and it is advised
to carry out a “rough” titration in order to become
familiar with any distinct colour change which
occurs at the endpoint, (it may just be a darkening
of the colour) This will also help by establishing an
approximate volume of iodine solution required.
7. The above method may be used to carry out a
number of interesting investigations regarding the
concentration of vitamin C in various foods and
drinks:
• Vitamin C content of different types of fruits
vegetables/juices.
• Vitamin C content of different types/brands of
vitamin tablets.
• Vitamin C content of tablets or food/drink in the
presence and absence of added oxalic acid or
metal ions over various periods of time.
• Vitamin C content of food/drink before and after
subjection to cooking conditions.
• Vitamin C content of fruits/vegetables at different
stages of ripeness.
Contact Us
If you have any questions or comments relating to this
experiment, please contact us. Please note that this
service is for senior school chemistry students in
New Zealand only. We regret we are unable to respond
to queries from overseas.
Outreach
College of Science
University of Canterbury
Private Bag 4800
Christchurch
New Zealand
Phone: +64 3 364 2178
Fax: +64 3 364 2490
Email: outreach@canterbury.ac.nz
www.outreach.canterbury.ac.nz
Figure 1 Vitamin C tablet. Left photo: before endpoint, added iodine
reacts with ascorbic acid leaving the solution colourless.
Centre photo: At the titration endpoint all the ascorbic acid has
reacted and the excess iodine reacts with the starch indicator to give
a pale blue colour. Right photo: If addition of iodine is continued after
the endpoint, further iodine-starch complex is formed. NB: in each of
these images a flask showing the pale blue colour of the endpoint is
shown for comparison.
Figure
2 Commercial fruit juice. Left flask: before the endpoint, the colour of
the solution reflects the pale yellow colour of the fruit juice.
Centre flask: At the titration endpoint all the ascorbic acid has
reacted and any excess iodine reacts with the starch indicator to
form a dark blue-black complex. In this case the result is a darkening
of the solution’s colour from yellow to brown-grey. Right flask:
This illustrates the effect of adding just a mL or two more of iodine
solution after the endpoint is reached, resulting in the formation of
further iodine-starch complex.
Figure 3 Freshly squeezed orange juice. Left flask: before the endpoint,
the colour of the solution reflects the bright orange colour of fresh
orange juice and is unaffected by addition of iodine. Centre flask:
Once all the ascorbic acid has been oxidised, a slight excess of added
iodine complexes with the starch indicator, giving the solution a
green colour in this case. This is the endpoint of the titration.
Right flask: If further iodine solution were to be added, the solution’s
green colour would become darker as shown.
Figure 4 Red capsicum. Left flask: Before the endpoint, the solution
retains its original colour. Centre flask: Once all the ascorbic acid has
been oxidised, a slight excess of added iodine forms a dark complex
with starch indicator giving a purple colour. This is the titration
endpoint. Right flask: If a further mL or two of iodine were to be
added after the endpoint, the solution would develop the dark purple
colour shown here.
3
in colour, there is no problem identifying the endpoint.
For strongly coloured juices there can be a problem with
the endpoint and it is advised to carry out a “rough”
titration in order to become familiar with any distinct
colour change which occurs at the endpoint (it may
just be a darkening of the colour) This will also help by
establishing an approximate volume of iodate solution
required.
7. The above method may be used to carry out a
number of interesting investigations regarding the
concentration of vitamin C in various foods and drinks:
• Vitamin C content of different types of fruits/
vegetables/juices.
• Vitamin C content of different types/brands of vitamin
tablets.
• Vitamin C content of tablets or food/drink in the
presence and absence of added oxalic acid or metal ions
over various periods of time.
• Vitamin C content of food/drink before and after
subjection to cooking conditions.
• Vitamin C content of fruits/vegetables at different
stages of ripeness.
Contact Us
If you have any questions or comments relating to this
experiment, please contact us:
Outreach
College of Science
University of Canterbury
Private Bag 4800
Christchurch
New Zealand
Phone: +64 3 364 2178
Fax: +64 3 364 2490
Email: outreach@canterbury.ac.nz
www.outreach.canterbury.ac.nz
Figure 1 Vitamin C tablet. Left photo: before endpoint, added iodine reacts
with ascorbic acid leaving the solution colourless. Centre photo: At the
titration endpoint all the ascorbic acid has reacted and the excess iodine
reacts with the starch indicator to give a pale blue colour. Right photo: If
addition of iodine is continued after the endpoint, further iodine-starch
complex is formed. NB: in each of these images a flask showing the pale
blue colour of the endpoint is shown for comparison.
Figure 2 Commercial fruit juice. Left flask: before the endpoint, the colour
of the solution reflects the pale yellow colour of the fruit juice. Centre flask:
At the titration endpoint all the ascorbic acid has reacted and any excess
iodine reacts with the starch indicator to form a dark blue-black complex.
In this case the result is a darkening of the solution’s colour from yellow
to brown-grey. Right flask: This illustrates the effect of adding just a mL or
two more of iodine solution after the endpoint is reached, resulting in the
formation of further iodine-starch complex.
Figure 3 Freshly squeezed orange juice. Left flask: before the endpoint, the
colour of the solution reflects the bright orange colour of fresh orange juice
and is unaffected by addition of iodine. Centre flask: Once all the ascorbic
acid has been oxidised, a slight excess of added iodine complexes with the
starch indicator, giving the solution a green colour in this case. This is the
endpoint of the titration. Right flask: If further iodine solution were to be
added, the solution’s green colour would become darker as shown.
Figure 4 Red capsicum. Left flask: Before the endpoint, the solution
retains its original colour. Centre flask: Once all the ascorbic acid has been
oxidised, a slight excess of added iodine forms a dark complex with starch
indicator giving a purple colour. This is the titration endpoint. Right flask:
If a further mL or two of iodine were to be added after the endpoint, the
solution would develop the dark purple colour shown here.