
Recomendados
Más contenido relacionado
Destacado
Destacado (20)
Free Money
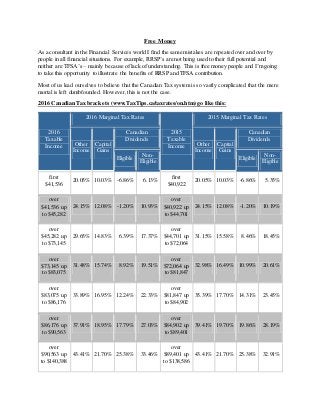
- 1. Free Money As a consultant in the Financial Services world I find the same mistakes are repeated over and over by people in all financial situations. For example, RRSP’s are not being used to their full potential and neither are TFSA’s – mainly because of lack of understanding. This is free money people and I’m going to take this opportunity to illustrate the benefits of RRSP and TFSA contribution. Most of us lead ourselves to believe that the Canadian Tax system is so vastly complicated that the mere mortal is left dumbfounded. However, this is not the case. 2016 Canadian Tax brackets (www.TaxTips.ca/taxrates/on.htm) go like this: 2016 Taxable Income 2016 Marginal Tax Rates 2015 Taxable Income 2015 Marginal Tax Rates Other Income Capital Gains Canadian Dividends Other Income Capital Gains Canadian Dividends Eligible Non- Eligible Eligible Non- Eligible first $41,536 20.05% 10.03% -6.86% 6.13% first $40,922 20.05% 10.03% -6.86% 5.35% over $41,536 up to $45,282 24.15% 12.08% -1.20% 10.93% over $40,922 up to $44,701 24.15% 12.08% -1.20% 10.19% over $45,282 up to $73,145 29.65% 14.83% 6.39% 17.37% over $44,701 up to $72,064 31.15% 15.58% 8.46% 18.45% over $73,145 up to $83,075 31.48% 15.74% 8.92% 19.51% over $72,064 up to $81,847 32.98% 16.49% 10.99% 20.61% over $83,075 up to $86,176 33.89% 16.95% 12.24% 22.33% over $81,847 up to $84,902 35.39% 17.70% 14.31% 23.45% over $86,176 up to $90,563 37.91% 18.95% 17.79% 27.03% over $84,902 up to $89,401 39.41% 19.70% 19.86% 28.19% over $90,563 up to $140,388 43.41% 21.70% 25.38% 33.46% over $89,401 up to $138,586 43.41% 21.70% 25.38% 32.91%
- 2. over $140,388 up to $150,000 46.41% 23.20% 29.52% 36.97% over $138,586 up to $150,000 46.41% 23.20% 29.52% 36.45% over $150,000 up to $200,000 47.97% 23.98% 31.67% 38.80% over $150,000 up to $220,000 47.97% 23.98% 31.67% 38.29% over $200,000 up to $220,000 51.97% 25.98% 37.19% 43.48% over $220,000 49.53% 24.76% 33.82% 40.13% over $220,000 53.53% 26.76% 39.34% 45.30% Let’s pretend that “Bob” has made $55,000 in 2015 and would like to file his taxes. Federal Ontario Total Tax on $55,000 of employment income $8,971 $3,355 $12,326 Minus: non-refundable tax credits ($2,383) ($670) ($3,053) Tax $6,588 $2,685 $9,273 Plus: Ontario Health Premium $0 $600 $ 600 Total tax liability $6,588 $3,285 $9,873 Where a $9,900 RRSP deduction is claimed then the tax payable is calculated using net income of $45,100, which is $55,000 minus $9,900. Then the non-refundable tax credits are applied. So, what does this look like? Here are the numbers where the $9,900 RRSP deduction is claimed. Federal Ontario Total Tax on $45,100 of net income $6,793 $2,449 $9,242
- 3. Minus: non-refundable tax credits ($2,383) ($670) ($3,053) Tax $4,410 $1,779 $6,189 Plus: Ontario Health Premium $0 $ 450 $ 450 Total tax liability $4,410 $2,229 $6,639 The $9,900 RRSP deduction results in a tax savings of $9,873 minus $6,639 =$3,234. “Bob has not only saved money, he has contributed to his retirement as well! See? It’s not too hard – it’s only taken me countless hours to grasp the concept… Up next: “Unlocking the Magic ofTFSA’s” An Original Article By: Alanna McKeogh – Consultant alanna.mckeogh@investorsgroup.com References: Canadian Tax Table retrieved from: www.taxtips.ca (April 2016)