The document discusses how the human brain is overloaded with information due to the exponential growth of data. It highlights that visual content like explainer videos and infographics are effective ways to communicate and attract attention because people remember 20% of what they read but 80% of what they see. Explainer videos use techniques like whiteboarding, photography and animations to simply explain complex topics, and have become increasingly popular on YouTube. Infographics also visually convey information through static and interactive designs, and are shared more widely on social media than text-based articles. Both explainer videos and infographics are powerful visual communication tools in the age of information overload.
1. ANATOMY OF
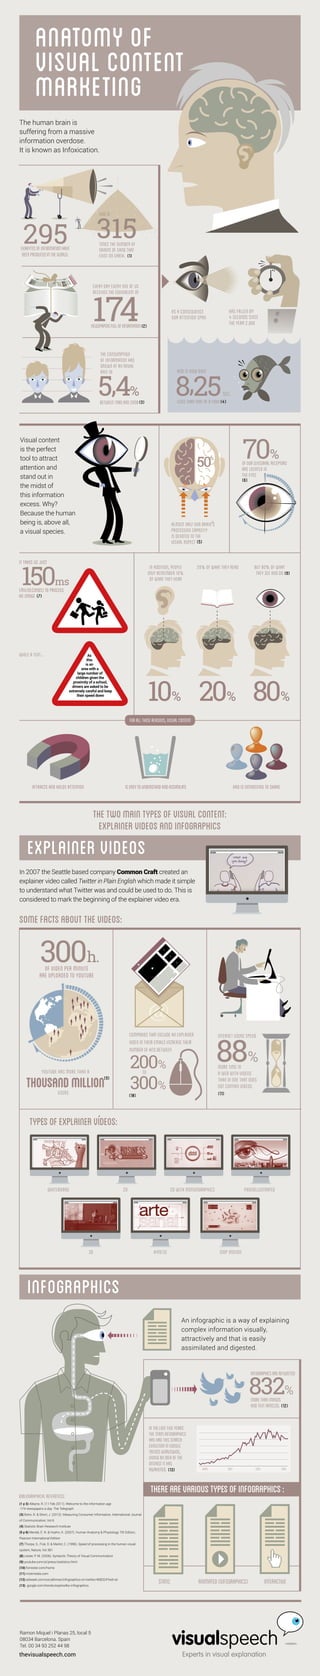
VISUAL CONTENT
MARKETING
The human brain is
suffering from a massive
information overdose.
It is known as Infoxication.
EXABYTESOFINFORMATIONHAVE
BEENPRODUCEDINTHEWORLD.
295
EVERY DAY EVERY ONE OF US
RECEIVES THE EQUIVALENT OF
NEWSPAPERSFULLOFINFORMATION
174
THE CONSUMPTION
OF INFORMATION HAS
GROWN AT AN ANUAL
RATE OF
BETWEEN198OAND2OO8
5,4%
AS A CONSEQUENCE
OUR ATTENTION SPAN
AND IS NOW ONLY
(LESS THAN THAT OF A FISH)
8,25
HAS FALLEN BY
4 SECONDS SINCE
THE YEAR 2.OOO
Visual content
is the perfect
tool to attract
attention and
stand out in
the midst of
this information
excess. Why?
Because the human
being is, above all,
a visual species.
SEC.
ALMOST HALF OUR BRAIN’'S
PROCESSING CAPACITY
IS DEVOTED TO THE
VISUAL ASPECT
50%
OFOURSENSORIALRECEPTORS
ARE LOCATED IN
THE EYES
70%
WHILE A TEXT...
150ms
IT TAKES US JUST
(MILISECONDS) TO PROCESS
AN IMAGE
10% 80%20%
IN ADDITION, PEOPLE
ONLY REMEMBER 1O%
OF WHAT THEY HEAR
BUT 8O% OF WHAT
THEY SEE AND DO
2O% OF WHAT THEY READ
ISEASYTOUNDERSTANDANDASSIMILATEATTRACTS AND HOLDS ATTENTION AND IS INTERESTING TO SHARE
FORALLTHESEREASONS,VISUALCONTENT
In 2007 the Seattle based company Common Craft created an
explainer video called Twitter in Plain English which made it simple
to understand what Twitter was and could be used to do. This is
considered to mark the beginning of the explainer video era.
EXPLAINER VIDEOS
SOMEFACTSABOUTTHEVIDEOS:
315TIMES THE NUMBER OF
GRAINS OF SAND THAT
EXIST ON EARTH.
THIS IS
(1)
(3) (4)
(5)
(7)
(8)
(6)
OF VIDEO PER MINUTE
ARE UPLOADED TO YOUTUBE
300h.
YOUTUBE HAS MORE THAN A
USERS
THOUSANDMILLION
COMPANIESTHATINCLUDEANEXPLAINER
VIDEOINTHEIREMAILSINCREASETHEIR
NUMBEROFHITSBETWEEN
200%
300%
TO
INTERNET USERS SPEND
MORE TIME IN
A WEB WITH VIDEOS
THAN IN ONE THAT DOES
NOT CONTAIN VIDEOS
88%
TYPESOFEXPLAINERVÍDEOS:
WHITEBOARD 2D 2D WITH MOTIONGRAPHICS PHOTOILLUSTRATED
3D KYNETIC STOP MOTION
INFOGRAPHICS
An infographic is a way of explaining
complex information visually,
attractively and that is easily
assimilated and digested.
INFOGRAPHICSARERETWEETED
MORETHANIMAGES
ANDTEXTARTICLES.
2OO9 2O11 2O13 2O15
INTHELASTFIVEYEARS
THETERMINFOGRAPHICS
HASHADTHISSEARCH
EVOLUTIONINGOOGLE
TRENDSWORLDWIDE,
GIVINGANIDEAOFTHE
INTERESTITHAS
AWAKENED.
STATIC ANIMATED(GIFOGRAPHICS) INTERACTIVE
THEREAREVARIOUSTYPESOFINFOGRAPHICS:
As
this
is an
area with a
large number of
children given the
proximity of a school,
drivers are asked to be
extremely careful and keep
their speed down
THETWOMAINTYPESOFVISUALCONTENT:
EXPLAINERVIDEOSANDINFOGRAPHICS
BIBLIOGRAPHICALREFERENCES:
(1 y 2) Alleyne, R. (11 Feb 2011). Welcome to the information age
-174 newspapers a day. The Telegraph
(3) Bohn, R. & Short, J. (2012). Measuring Consumer Information, International Journal
of Communication, Vol 6
(4) Statistic Brain Research Institute
(5 y 6) Merieb, E. N. & Hoehn, K. (2007). Human Anatomy & Physiology 7th Edition,
Pearson International Edition
(7) Thorpe, S., Fize, D. & Marlot, C. (1996). Speed of processing in the human visual
system, Nature, Vol 381
(8) Lester, P. M. (2006). Syntactic Theory of Visual Communication
(9) youtube.com/yt/press/statistics.html
(10) forrester.com/home
(11) mistmedia.com
(12) adweek.com/socialtimes/infographics-on-twitter/468324?red=at
(13) google.com/trends/explore#q=infographics
Experts in visual explanation
Ramon Miquel i Planas 25, local 5
08034 Barcelona. Spain
Tel. 00 34 93 252 44 98
thevisualspeech.com
(9)
(10) (11)
(12)
(13)
(2)
832%