A garch approach to measuring efficiency, a case study of nairobi securities exchange
•
1 recomendación•629 vistas

IISTE Journals Call for paper: www.iiste.org/Journals

Recomendados
Recomendados
Más contenido relacionado
La actualidad más candente
La actualidad más candente (20)
Destacado
Destacado (6)
Similar a A garch approach to measuring efficiency, a case study of nairobi securities exchange
Similar a A garch approach to measuring efficiency, a case study of nairobi securities exchange (20)
Más de Alexander Decker
Más de Alexander Decker (20)
A garch approach to measuring efficiency, a case study of nairobi securities exchange
- 1. Research Journal of Finance and Accounting www.iiste.org ISSN 2222-1697 (Paper) ISSN 2222-2847 (Online) Vol.4, No.4, 2013 A Garch Approach to Measuring Efficiency: A Case Study of Nairobi Securities Exchange Patrick K. Owido1* Samuel O. Onyuma2 George Owuor3 1. Department of Business Administration, Egerton University, P.O. Box 13357, Nakuru, 20100, Kenya. 2. Department of Business and Mathematics, Laikipia University, P.O. Box 1100, Nyahururu, 20300, Kenya. 3. Africa Economic Research Consortium, P.O. Box 62882, Nairobi 00200, Kenya. * E-mail of the corresponding author: powido1@gmail.com Abstract The efficiency of capital markets is important if savers funds are to be channeled to the highest valued stocks. A recent review of markets in Africa categorized the Nairobi Securities Exchange as one which has no tendency towards weak form efficiency. Recent efforts to establish its effic iency have used mainly Ordinary Least Squares regression and have yielded inconclusive results. Ordinary Least Squares method assumes that the variance of the error term obtained is constant over time. However due to economic cycles some time periods are k nown to be generally riskier than others and the latter assumption fails to hold. There is therefore need to use other models which relax this assumption. The Autoregressive Conditionally Heteroscedastic models have been popular and widely used. They recognize that the value of the variance of errors depends upon previous lagged variances and lagged innovation terms. Kenya has also increasingly embraced ICT which may be attributed to the comparative lower cost of access to internet via computers and mobile phone technology. This is expected to increase the rational buyers in the market none of whom can influence prices in the market which may make the market more efficient. This study first used non parametric methods to check for randomness and independence of stock market returns at the Nairobi Securities Exchange. Results show that daily returns are non -random and the GARCH analysis shows that the current returns are dependent on the returns of the previous 3 days. The GARCH (3,1) model shows that returns on a particular day would be determined by the mean returns plus a white noise error term which would vary by 25.3% of return on day t -1, 9.5% of return on day t-2 and 12.05% of returns on day t-3 at 0.05 level of significance. This signifies market ineff iciency of the weak form. Keywords: Market Efficiency, Weak-Form Hypothesis, OLS, GARCH 1. Introduction The Nairobi Securities Exchange (NSE) was established in 1954 as a voluntary association of stock brokers registered under the Societies Act. A total o f 58 firms are now listed on the NSE and trade in Shares and Bonds. A security market is important for economic growth as it enables idle money and savings to be invested in productive economic activities. Borrowers and lenders come together and trade at a low cost. The lenders invest and expect a profit while borrowers promise to pay the lenders a profit. Through shares and bonds, small and big companies, the government, cooperative societies and other organizations can raise money to expand their business activities, make a profit, create employment and generally help the economy grow. The NSE is open Monday to Friday and closed during public holidays. Share price movements at the NSE market are measured by Indices. An Index is a general price movement indicator based on a sample or all the security market companies. The NSE 20 share index has been used the longest and is based on 20 representative companies. It is calculated on a daily basis. Empirical studies on the day-of-the-week effect started as early as the 1970s. According to Fama (1970) a market is efficient if security prices always fully reflect available information about their fundamental value. The notion of efficiency being invoked is that of informational efficiency which means that information is readily and equally available without costs to all market participants. Therefore all investors in the market have homogeneous expectation. This proposition is usually termed as the efficient market hypothesis. It implies that securities are typica lly in equilibrium, fairly priced and their expected returns equal to their required rates of returns. At any point in time, security prices will reflect all publicly available information about firms and its securities since they react swiftly to new information. Investors should therefore not waste time trying to find and capitalize on mis-priced securities. 1
- 2. Research Journal of Finance and Accounting www.iiste.org ISSN 2222-1697 (Paper) ISSN 2222-2847 (Online) Vol.4, No.4, 2013 Research has distinguished between three forms of efficient markets hypothesis; the weak, semi - strong and strong -form hypothesis. The strong- form hypothesis encompasses both the weak and semi-strong forms. The strong form of efficient market hypothesis states that current market price reflects all pertinent information including everything that is known whether it is public or private (French 1986). Private information is all information not in the public domain including, insider knowledge, financial models, financial statements prior to public release, secret inventions, and internal rates of return or business relationships, unpublished financial m odels, intuition as well as selectively available reports prepared by financial analysts (Bos,1994). Public information includes analyzed knowledge such as annual reports, announcements of dividends, bonuses or stock splits, incapacitation of a senior manager, prevailing interest rates and information on current rates of inflation. Security prices reflect everything that is knowable, anything that investment analysts could possibly uncover using all their talent and all tools at their disposal. Therefore no group of investors has monopolistic access to information relevant to forming opinion about prices as to make abnormal profit. The semi-strong form efficient market hypothesis asserts that current security prices fully reflect not only past prices of the security but all available public information. This information includes both the original raw information about the economy, political news or an individual security and any publicly available analyses or projections made using the raw data. All informati on contained in the company’s financial statements, potential analyses of such information including news release, economic data and so forth are fully reflected by each security price. Investors will have no generally available source of information that could lead to beat the market since market prices adjust instantly to any sort of news. The random walk hypothesis otherwise called the weak form of efficient market hypothesis states that current security market price reflects all the information contain ed in the record of past prices. In other words, all information conveyed in past patterns of a stock’s price is discounted into the current price of the stock. It will be useless to select stocks based on information about recent trends in stock prices. The fact that the price of stocks has risen for the past few days will give no useful information as what today’s or tomorrows price will be. Thus potential investors who follow the price trend in order to forecast price or determine when to buy and sell th e stock are wasting their time. There are no regularities or patterns in security prices that repeat themselves over time as to predict future stock prices from past prices. Each price change that occurs in the market is independent of the previous price changes and the price movement behaves randomly. Several empirical studies have been conducted in an attempt to determine the level of efficiency of different stock markets. Cross (1973) was among the first to test for market efficiency of the New York Stock Exchange. He examined a sample of returns data from 1953 -1970 of the Standard and Poors Composite Index for price changes on different days and the dependence of the index’s performance on a given day to its performance on the previous day. Over the per iod he found positive returns on Friday and Negative returns on Mondays. He also found that the Index performance on Monday was dependent on the previous Friday’s performance. Subsequent works compared these findings to those obtained from other security m arkets. These studies were important to establish the theory of market efficiency and generally showed negative mean returns on the first trading day of the week. Information and Communication Technology (ICT) has also made information describing the macro and micro environment of economies readily accessible to stakeholders making them better placed to access and act in markets in accordance with changing dynamics in the environment (Pal and Mittal, 2011). ICT is expected to play a big role in making secur ity markets efficient by driving security prices closer to their true values and therefore erasing trading patterns. This may be because the market is becoming more efficient as information is readily and equally available and buyers are able to value securities fairly. Kenya has increasingly embraced ICT which may be attributed to the comparative lower cost of access to internet via computers and mobile phone technology. This has increased the number of rational buyers in the market none of whom can influence prices in the market making the market more efficient. Most of the older studies carried out tests of serial independence, such as autocorrelation and runs test, and established that there is absence of serial correlation which does not in itself imply independence (Al-loughani and Chapell, 1997). Existing studies in Kenya on the NSE have used various methods, mostly OLS and have yielded inconclusive results (Mutoko, 2006). While it has 2
- 3. Research Journal of Finance and Accounting www.iiste.org ISSN 2222-1697 (Paper) ISSN 2222-2847 (Online) Vol.4, No.4, 2013 been widely used, OLS regression assumes that the variance of the e rror term over time to be constant. However financial data is known to exhibit volatility as some time periods are riskier than others (Engle, 2001). The Auto Regressive Conditional Heteroscedastic (ARCH) model introduced by Engle (1982) has become an important econometric technique and has gained a huge success. Heteroscedasticity refers to the time varying variance i.e. volatility. Conditional implies a depence on observations of the immediate past, and Autoregressive describes a feedback mechanism by wh ich past observations are incorporated into the present. ARCH then is a mechanism by which past variances are included in the explanation of future variances. The General -ARCH (GARCH) model, an extension of ARCH is a time series modeling technique and prov ides accurate forecasts of variances an co-variances of stock returns through its ability to model time varying conditional variances (Bollerslev,1987). 2. Literature Review 2.1 Efficient Market Hypothesis Prices of securities in the stock markets today r eact very quickly to new information and in anticipation of news before it is out in the public domain. This signifies informational efficiency as relevant information on securities is readily available for investors and their agents to evaluate prices correctly. This is essential for investor confidence in a market and helps channel investment funds to the highest valued securities. A security market is Weak form efficient if all information included in historical prices has been discounted in current pric es. Traders who would like to maximize returns by using such past security prices may stand to benefit less as that information is already widely known and does not give them much competitive advantage. Past tests for weak form market efficiency have used mathematical models to test predictability of stock prices and therefore returns. Researchers have often referred to such predictions as anomalies to the random walk theory or weak form market efficiency. Calendar anomalies comprise one set of such market anomalies. They arise from the observation of systematic patterns of security returns around certain calendar points. Those reported include; week of the month (Ariel,1987; Lakonishok and Smidt, 1988), month of the year (Rozeff and Kiney, 1976), and day of the week (Cross, 1973; French, 1980) among others. However these observations have differed for some markets mainly because of the analysis methods used (Jefferis and Okeahalam,1999). Some patterns have however been observed to disappear (Jefferis and Smith, 2005) such that, trading patterns observed in a security market gradually disappear and other patterns emerge. This may be caused by profit -maximizing investors (Jain, 1986) who after noticing the price patterns, act on those prices to make profit and cause those patterns to change or disappear. 2.2 The January effect This anomaly states that shortly before the year -end, many investors sell securities and which increases volumes traded lowering prices. At the beginning of the New Year demand increases a nd prices rebound which results in high January returns (Starks et. al, 2006). This anomaly is attributed to two main hypotheses; “Tax- loss selling” and “Window dressing” (D’Mello et. al, 2003). The Tax loss selling hypothesis proposes that investors want to reduce their tax liability, and sell stocks that have experienced a decline in price over the year. Initially it results in a glut and a decline in year - end stock prices. After the New Year, there is a tendency to reacquire these stocks or to buy other stocks that look attractive. The January effect has also been observed in Japanese markets whose year -end differs from January (Kato and Schallheim,1985). One would not expect such a seasonal pattern to persist since it should be eliminated by arbitrageurs who would buy in December and sell in January. The “Window dressing” hypothesis holds that investors sell off stocks at the end of the year to make lucrative their end of year reports. Musto (1997) argues that the January effect reflects the agency problems related to portfolio disclosures of institutional investors rather than individual investors. The ‘Window dressing’ hypothesis is also reported by Ng and Wang (2004). 2.3 The Day of the week effect The day of the week effect refers to the existence o f a pattern on the part of stock returns, in which returns are linked to a particular day of the week. Cross (1973) and French (1980) were among the first to document stock return regularities on particular days of the week. French examined the S&P index returns from 1953 to 1977. The study found that returns are not generated independently of 3
- 4. Research Journal of Finance and Accounting www.iiste.org ISSN 2222-1697 (Paper) ISSN 2222-2847 (Online) Vol.4, No.4, 2013 the day of the week. It was observed that the mean returns on Monday over the period were significantly negative, while Wednesday, Thursday and Friday returns were si gnificantly positive. Other early studies also reported that the U.S. stock market consistently experienced significant negative returns on Mondays and significant positive returns on Fridays also giving it the tag Monday effect. Later studies by Lakonishok and Smidt (1988), Poshakwale (1997), Galai and Kedar - Levy (2005) have also attested to its presence of the Monday effect. Boudreaux et al (2010) examines returns to the DJIA, S&P 500, and the NASDAQ indexes from 1976 -2002. Results for this market reported evidence of weekend returns being higher than non - weekend effects. Some studies have also reported that the Monday effect attributed to liquidity selling by individual investors occurs on the last week of the month. A study by Perry and Mehdian (2001) r efers to this as ‘Turn of the month’ effect. It should however be investigated if this also occurs in markets where wage payments are made bi-weekly such as in the United States. Some studies concluded differently. Bouges et. al (2009) tested for weekend effects in American depository receipts over the period 1998-2004. They do not find any evidence of daily effect in returns. Yu et. al (2008) studying daily returns in the yen spot market between 1994 and 2003 find a disappearance of the Friday and Monday effect. They report greatest returns on Thursday and the worst on Tuesdays. Galai et. al (2008) also examining the S&P 500 index returns find that the Monday effect turns positive and significant. 2.3.1 The Day of the week studies at the NSE The NSE is one of the most active capital markets in Africa (Rioba, 2003). It plays an important role in mobilizing domestic savings and reallocation of financial resources. A review of the changing efficiency of seven capital markets in Africa reveals that the NSE shows no tendency towards weak form efficiency (Jefferis and Smith, 2005). Munga (1974) studied the history, organization and role of the NSE and reported that it was characterized by illiquidity and low turnover. The results of his study show the NSE as bei ng weak form efficient as the stock prices were only indicative of past information and that many investors traded in stocks based on the best economic performance indicators such as good trading results of the prior years. Omosa (1989) studied the predict ive ability of asset pricing models on the NSE and found that models were not generally good predictors of prices due to inefficiency in the models and market imperfections. The study concluded that previous models were not good predictors and went further to report that the NSE was weak form efficient. Kerandi (1993) tested the predictability of the dividend valuation model in the NSE. He collected data on share prices, market indices and dividend per share. These he used to predict the prices for the comp anies studied, compared predicted prices with actual prices and tested for significant differences. He also found that models have less predictive ability in the NSE. Dikinson and Muragu (1995) using returns of the 30 most actively traded stocks on the NS E conducted serial correlation tests and runs test to test for independence. Results show consistency with weak form hypothesis. Mwangi (1997) analyzed price movements for some selected stocks at the Nairobi Securities Exchange. He wanted to determine fact ors that affect share price movements in addition to developing a model that could be used to predict price movements. He concluded that it was not always possible to develop a model that could accurately predict prices at the NSE. He remotely concluded with a conditioned asset-pricing model that reflected time varying risks and betas. He however concluded that the NSE is weak form efficient. Murithi (2001) sought to establish whether interim dividend could be used to predict future earnings. He concluded that interim dividend provided information that the companies who announced dividend would pay more in future. He also concluded that the NSE is weak form efficient. Kamau (2002) studied the turn of the month returns at the NSE. Comparison was made of week 1 & 4 versus week 2 & 3 returns. Results show significant differences between the two sets of returns consistent with ‘turn of the month effect, and thus weak form efficiency. Rioba (2003) in his works on predictability of ordinary stock returns concluded that the NSE is weak form efficient. Mokua (2003) reports different findings while studying returns of 434 firms continuously listed at the NSE. The study found no significant difference between Monday or Friday returns and returns of other days of the week. Onyuma (2009) studying the day-of the week and month of the year effect from 1980 to 2006 found the lowest negative returns on Monday while Friday and January had the largest positive results. This work tested the level of efficiency at the NSE between 2006 and 2011. We investigate 4
- 5. Research Journal of Finance and Accounting www.iiste.org ISSN 2222-1697 (Paper) ISSN 2222-2847 (Online) Vol.4, No.4, 2013 whether the day-of the- week was used as a profitable investment rule and if it would therefore be a basis for a trading strategy. 2.4 Testing strong form market efficiency If a market is informational Strong then even those w ith privileged information like firm and fund managers can consistently make use of it to secure superior investment results. Testing this level of market efficiency can be done by observing whether the level of stock returns earned by the insiders versus that earned by outsiders is significantly different. A researcher would also observe high trading and abnormal returns before a firm’s public announcement. For instance, if investors learn earlier of a firm’s intention to report bad earnings late, they wil l react by disposing of their shares before the actual announcement, driving down prices (Kross, 1982). This would be evidence that the market also has insider information and signify market efficiency in the strong form. 2.5 Testing semi-strong form market efficiency When testing for market efficiency at the Semi-strong level, it is important to observe the market reaction to new information just made public. For instance during the announcements of dividends, we would observe the average return on the sto cks following the announcement and compare with the average returns on days immediately preceding the announcement. Fama et. al (1969) compared stock returns before and after a stock split and reported block trading and abnormally high returns before the announcement and no extraordinary return after the announcement. The market had correctly valued the securities and there was consensus since no single investor was a price taker. Bos, (1994) observed that in the U.S. market, in the three days around the an nouncement of mergers and acquisitions, the average return on the stock of a target company realized within a day is 15% and that the increase in stock prices is permanent. 2.6 Testing weak form market efficiency The weak form efficient market hypothesis i mplies that prices on traded assets already reflect past information and future prices cannot be predicted by technical analysis techniques. In other words security prices do not follow patterns, thus it is not possible to trade profitably purely on the ba sis of historical prices and traded volume information. Tests of this hypothesis study how investors may use past information to be able to determine the right time to buy or sell and consistently earn abnormal profits. Research into weak-form market efficiency (Ariel, 1987; Lakonishok and Smidt, 1988; Rozeff and Kiney, 1976; Cross,1973; French, 1980) has particularly observed the cyclical behavior of security prices during the days of the week, week of the month, month of the year season of the year and other seasonal effects. They are collectively referred to as the ‘calendar anomalies’ and question whether some regularities exist in the market returns during the year that would allow investors to predict market returns. 2.6.1 Regression Analysis Regression analysis provides a “best-fit” mathematical equation for the values of the dependent variable (y) and two or more independent variables (x). The independent variables are used in estimating a dependent variable. For any given value of x, y values are as sumed to be normally distributed about the population regression line by a random amount ε. The quantity ε in the model equation is a random variable assumed to be normally distributed with a mean, E (ε) = 0 and a Variance, V (ε) = σ 2 (Devore, 2004). The assumption of equal standard deviations about the regression line is called Homoscedasticity. In this case it means that the standard deviation of returns on a particular day of the week over a given period such as a 5 year term is constant. However this m ay not be true as economic data has been known to exhibit volatility clustering such that fluctuations in returns is not uniform over a period of time (Heteroscedasticity). Another limitation is that one or more relevant independent variables may have been omitted from the model such that the predictor variables may not explain the model well. There might also be a few discrepant or outlying data values, which may have greatly influenced the choice of the best-fit function a non-linear relationship between y and predictor variables (Devore, 2004). These are some of the difficulties of using the OLS regression model and conclusions obtained might be wrong. We therefore revert to using more advanced and appropriate models such as the Auto Regressive Conditiona l Heteroscedastic (ARCH) models. 5
- 6. Research Journal of Finance and Accounting www.iiste.org ISSN 2222-1697 (Paper) ISSN 2222-2847 (Online) Vol.4, No.4, 2013 3. Research Methodology 3.1 Sample Data nd The study used the daily NSE 20 share index of the Nairobi Securities Exchange for the period 2 th January 2006 to 18 November 2011. The secondary data was obtained from Synergy Ltd , an authorized data vendor of the NSE for the period of 2006 to 2011. The daily market return R t was then calculated using Equation 1 (Washer et. al., 2011). Rt = Ln (PI t/ PI t-1)* 100 (1) Where; PI t = Closing Price Index on day t PI t-1= Price Index on day t-1 Ln= Natural logarithm The daily market returns obtained are then used in the following empirical analysis using different statistical techniques. Results are classified in the subsequent chapter. MATLAB will be used to analyze the data. 3.2 ARCH Models Auto Regressive Conditional Heteroscedastity (ARCH) models are widely used to analyze time series heteroscedastic data (Engle, 2001). Heteroscedasticity means differing volatility dispersion. Conditional refers to the dependence on the most recent observations. Autoregressive describes a feedback mechanism by which recent observations are incorporated into the present. If the variance is dependent on the previous one period error term the conditional variance equation becomes: (2) Equation 2 above is referred to as the ARCH (q) model for variance with a lag (‘q’) of 1. The General ARCH (q) regression model for variance is: (3) where - conditional variance - lag length of error term …………. - coefficients of the lagged square error terms > 0 for all i =1,2,…..q ……….. - previous squared residuals from Equation 2 ue The value q may be quite large and may not be arrived at and has to be carefully chosen so that the chosen ’s might be negative. This is a limit to the model and Bollerslev (1986) extended the ARCH (q) model to form the GARCH (p, q) model. The later model allows the variance to be dependent on the past, squared errors and variances. It is less likely to violate the non -negativity constraints thus get round the ARCH (q) limitation. The GARCH (1,1) model for variance is: Which can be generalized into the GARCH (p,q) model below. (4) where, p- lag length of the variance term, p 0 ……….. - coefficients of lagged variances, j=1,……..p. Since the model is not linear we cannot use OLS to estimate the parameters, we use Maximum Likelihood Estimators (MLE). The likelihood function tells us how likely the observed sample is a function of the possible parameter values. Maximizing the likelihood gives the parameter values that agree most closely with the observed data (Devore, 2004). The log-likelihood function to maximize for a GARCH (p,q) assuming normally distributed conditional errors is as shown in Equation 11(Corhay and Rad, 1994): 6
- 7. Research Journal of Finance and Accounting www.iiste.org ISSN 2222-1697 (Paper) ISSN 2222-2847 (Online) Vol.4, No.4, 2013 (5) where, -log likelihood function with 2 parameters p and q - number of observations (squared residuals) from equation 2 − natural logarithm – max (p, q), - exponential 3.3 Sensitivity Analysis To test for the best fit for the GARCH (p,q) model we use the Likelihood Ratio (LR) test Maddala (2002). Hypotheses such as p=1 or p=2, q=1 impose restrictions on the parameters. We compute the maximum of L(Ф) without any restrictions imposed by the hypothesis to be tested and consider the ratio: λ (6) λ – will necessarily be less than 1 since the restricted maximum will be less than the unrestricted maximum. If the restrictions are not valid will be significantly less than 1. If they are valid λ will be close to 1. The LR test will then use -2 ln λ (7) as a χ with degrees of freedom k is the number of restrictions. If the value of the test statistic is 2 greater than the critical value from the χ 2 distribution, then reject the null hypothesis. 4. Results and Discussion 4.1 Garch Modelling Figure 1 and Figure 2 are plots of autocorrelation function (ACF) and partial autocorrelation (PACF) function help determine whether there are serial dependencies in series across time. In particular, ACF helps to identify and order of Moving Average process q, while PACF is used to settle an order p of the Auto Regression part for the corresponding Auto Regressive Moving Average (ARMA) model. The ACF (Figure 1) and PACF (Figure 2) plots show that the time series of the return on the Index has a rather consid erable degree of autocorrelation between adjacent and near-adjacent observations. The ACF plot shows that if the first observation is Monday, it is highly positively correlated to Friday, Thursday and Wednesday but not as much to Tuesday or Monday. This can be seen as Friday, Thursday and Wednesday values have surpassed the upper standard deviation confidence bounds, while last Tuesday and Monday values are still within the confidence bounds. The Ljung-Box-Pierce Q-test quantifies this departure from randomness based on the ACF of the data. The test results in Table 1 show that the null hypothesis H=1, is not rejected (p -Value =0.00). It can be concluded that there is significant correlation present in the Index returns at the 0.05 level. The ARCH test results (Table 2) below also reports significant evidence of correlation in support of GARCH effects. The autocorrelation and Ljung-Box Pierce Q-Test shows that the return series are not independent and implies non-randomness. High autocorrelation may indicate the presence of various imperfections in the functioning of these markets. Imperfections may mean that there is low liquidity, thin trading, and possibly less well informed investors with access to unreliable information and considerable volatility (Haque et. al, 2006). In light of efficient market models, this would imply inefficiency in the markets. The presence of autocorrelation in the markets may be either due to the economy or/and capital markets that may be growing at a rapid pace (Bekaert et. al., 2002). The plot of the NSE20 Share Index in Figure 3 and plot of Daily returns on the Index in Figure 4 for the period confirms that the data exhibits volatility clustering over the period of study. This means that a period of large volatility in daily ret urns on the Index are followed by another period of large volatility in daily returns and the period of small volatility in daily returns are followed by another period of small volatility in daily returns. Therefore certain weeks of the month or months of the year have significantly different (higher or lower) returns. This is commonly referred to as the week of the month and the month of the year effect (Alagidede and Panagiotidis, 7
- 8. Research Journal of Finance and Accounting www.iiste.org ISSN 2222-1697 (Paper) ISSN 2222-2847 (Online) Vol.4, No.4, 2013 2008).These are anomalies of the efficient markets hypothesis and contradi ct the efficient markets hypothesis. From the ACF plot, PACF plot, Q-Test, ARCH test and Returns series plots results we conclude that the return series exhibits GARCH effects and we estimate model Equation 4 using software to give the parameters given in Table 3.Substituting these estimates in the definition of the default model, the estimation process implies that the constant conditional mean will be given by: (8) This means that the return on the Index, consists of a constant plus an uncorrelated white noise disturbance, . The conditional variance model that best fits the data is given by the GARCH (1, 1) conditional variance equation; (9) Equation 9 means that the variance forecast, , consists of a constant, plus a weighted average of last periods forecast and last periods squared disturbance . A comparison (Figure 5) of the residuals, standard deviation and return series data obtained from the fitted model shows that the innovations (residuals) exhibit volatility clustering. When we compare this with the correlation of the standardized innovations plot ( Figure 6) the standardized innovations (residuals) now appear general ly stable with little clustering. The ACF plot of the squared standardized innovations (Figure 7) also shows no autocorrelation. A Comparison of the ACF of the standardized innovations to the ACF of returns before fitting the default model (Figure 1) shows that the default model quite explains the hetroscedasticity in the returns series. 4.2 Sensitivity Analysis Both the Q-Test and the ARCH test in the earlier analysis indicated rejection (H=1 with p -Value=0) of their respective null hypothesis. This result may show significant evidence in support of GARCH effects. When the same tests are done on standardized residuals results ( Table 4 and Table 5) still shows evidence of GARCH effects which means that the GARCH (1, 1) model does not accurately explain the model. We therefore need to fit other models to test if they better fit the data. Comparing the estimation results for the default GARCH (1,1) model with those obtained from fitting a GARCH (2,1) model gives us the following parameters in Table 6. The T-statistic of the GARCH (2) parameter, shows that the parameter adds some explanatory power to the model since it is greater than 2 in magnitude. This corresponds to approximately a 95% confidence interval. A further comparison of the estimation for the GAR CH (2,1) model with those obtained from fitting a GARCH(3,1) model to the NSE20 returns are shown in Table 7. Conducting a likelihood ratio test at the 0.05 significance level the null GARCH (2,1) is rejected in favor of the GARCH(3,1) alternative. The constant conditional mean is therefore given by: (10) and the conditional variance model that best fits the data is given by the GARCH(3,1) conditional variance equation; (11) The conditional mean (Equation 10) and conditional variance (Equation 11) show that the return on the NSE 20 share index can be accurately predicted. According to the weak form efficient market hypothesis, all security prices fully reflect all security market information and it is not easy to 8
- 9. Research Journal of Finance and Accounting www.iiste.org ISSN 2222-1697 (Paper) ISSN 2222-2847 (Online) Vol.4, No.4, 2013 predict the market performance given the past sequence of indices. According to Equation 11 the return on the index, say on a Monday can be accurately predicted given the weighted risk on the returns on Friday, Thursday and Wednesday respectively. For instance th e mean return on Monday will vary by 25.3% of Friday returns, 9.5% of Thursday and 12.05% of Wednesday returns at 0.05 level of significance. This may still indicate inefficiency in the weak form. An investor would be able to predict the market movement by observing activity of the past three days. This also confirms the presence of volatility clustering. In this case it is a three day cycle. 5. Summary Conclusions and Recommendations 5.1 Summary This study has shown that the NSE is still not efficient in the weak form. Using Non-Parametric methods such as the Q-Q and P-P plots, results show that the distribution of returns just approximates the normal curve as they are not quite linear in the middle and tail section respectively. According to the random walk hypothesis, if the distribution is not normal then the data is not completely random meaning the market is inefficient in the weak form. Data summaries also show that the distribution is slightly skewed to the right. The K -S test for normality rejects the hypothesis that the data is normally distributed and based on the number of runs, the Runs test rejects the randomness assumption at the 5% level of significance. Therefore we may conclude that the market is not efficient in the weak form. The autocorrelation plot shows significant degree of autocorrelation between adjacent and near adjacent observations which implies non-randomness. Together with the and partial autocorrelation plot they show that Monday returns may be significantly correlated to Frida y, Thursday and Wednesdays but not Tuesday returns. The Ljung–Box-Pierce Q-Test and the ARCH test confirm the presence of significant autocorrelation of the data and therefore non -randomness. This is confirmed by the GARCH (1,1) model which is fitted. The likelihood ratio test confirms that the GARCH (3,1) model as the best model fit over the GARCH(1,1) and GARCH(2,1) models. The GARCH (3,1) model shows that returns on a particular day would be determined by the mean returns plus a white noise error term which would vary by 25.3% of return on day t-1, 9.5% of return on day t-2 and 12.05% of returns on day t-3 at 0.05 level of significance. 5.2 Conclusion In earlier studies the day of the week effect has been generalized to show that stock returns on particular days of the week such as Monday is significantly different from other days of the week. For emerging market such as the NSE, it has been suggested that a possible explanation of this anomaly is that firms and governments release good news during mark et trading when it is readily absorbed, and store up bad news till the close on Friday when investors cannot react until Monday (Guidi et. al., 2011). In this study we confirm that due to volatility clustering some time periods may be riskier than others and therefore it would not be accurate to generalize that Monday returns are generally lower. Instead we recognize that stock returns on a particular day depends on the previous activity and the notion of a weekly window is rejected. Instead for this period of study one would think of 5 year contiguous return data and using a 3 day window to predict the next days’ activity. For instance if an investor wanted to predict the returns on Monday, then it would be equal to a mean return which will fluctuate depending on the risk of returns of the previous Friday, previous Thursday and previous Wednesday. This is slightly different but more accurate way of predicting stock returns since it takes into account the general economic conditions in the neighborhood of th e day being predicted. Since there is no randomness in the data whatever returns realized today will largely depend on the most recent activity in the market. We conclude that volatility clustering exists in the market and that stock returns does not depen d on the day of the week but rather the returns of the previous 3 days of the week. This being a significant pattern in the data it can be concluded that the market is still not weak form efficient. 5.3 Recommendations Future work in this area may study an inter-period say yearly data during this period to show if it is different from the overall result. If different it would still indicate volatility clustering and researchers would be interested to find out the trend per period of study. It would also be interesting 9
- 10. Research Journal of Finance and Accounting www.iiste.org ISSN 2222-1697 (Paper) ISSN 2222-2847 (Online) Vol.4, No.4, 2013 to see if the market over this period is becoming more efficient. Other GARCH models could also be used such as the E-Garch of GARCH-M models on the same data to observe if other models could be used as well. As long as one is able to consisten tly predict the daily return, it would point out to the inefficiency in the market. References Alagidede, P. and Panagiotidis, T.,( 2009), ‘Calendar Anomalies in the Ghana Stock Exchange’, Journal of Emerging Market Finance, Vol. 8, No. 1, pp. 1-23. Al-Loughani, N. and Chappell, D., (1997) ‘On the validity of the weak-form efficient markets hypothesis applied to the London stock exchange’, Applied financial economics, Vol. 7, pp.173-176. Ariel, R. (1987), “A Monthly Effect on Stock Returns”, Journal of Financial Economics, Vol. 18, pp. 161-174. Bekaert, G., Harvey, C.R., and Lumsdaine, R.L. (2002), “Dating the integration of World Equity Markets, “Journal of Financial Economics”, Bollerslev, T.,(1987), ‘A Conditional Heteroscedastic time series model for speculative prices and rates of return’, Review of Economics and Statistics, Vol. 69, No. 4, pp.542-547. Bos, J.W.D., (1994), ‘Stock Market Efficiency; The Evidence from FTA Indices of Eleven Major Stock Markets’, De Economist, 142, No. 4. Boudreaux, D., Rao, S., and Fuller, P., (2010), ‘An Investigation of the Weekend Effect during different Market Orientations’, Journal of Economics & Finance, Vol. 34, No. 3, pp. 257-268. Bouges, J. C., Jain, R. and Puri, Y.R., (2009), ‘American Depository Receipts and Calendar Anomalies’, Applied Financial Economics, Vol. 19, No. 1, pp. 17-25. Corhay, A., Rad, T.A. (1994), ‘Statistical Properties of Daily Returns: Evidence from European Stock Markets’, Journal of Business Finance and Accounting’, Vol.21, No. 2, pp. 271-282. Cross, F., (1973), ‘The Behaviour of Stock Prices on Fridays & Mondays, ‘Financial Analysts Journal, Vol. 29, November/ December , pp. 67-69. Devore, J.L., ( 2004), ‘Probability and Statistics for engineering and the Sciences’, 6th ed.,Brooks/ Cole, California. Dickinson, J., and Muragu, K., (1995), ‘Market Efficiency in Developing Countries: A Case Study of the Nairobi Stock Exchange’, Journal of Business Finance and Accounting, Vol. 21, No. 1., pp. 133-150. D’Mello, R.,Ferris, S.P., and Hwang, C.H.,( 2003), ‘The Tax-loss selling Hypothesis, market liquidity, and price pressure around the turn of the year’,Journal of Financial Markets, Vol. 6, pp. 73-98. Dryden, M., (1969), ‘Share Price Movement : A Markovian approach’, The journal of Finance, Vol. 24, No. 1, pp. 73-98. Engle, R., (2001), ‘GARCH 1010: the Use of ARCH/GARCH Models in Applied Econometrics’, Journal of Economic Perspectives, Vol. 15, No. 4., , pp. 157-168. Engle, R.F., (1982), ‘Autoregressive Conditional Heteroscedasticity with Estimates of Variance of United Kingdom Inflation’, Econometrica, Vol. 50, No. 4, pp.987-1007. Fama, E., (1970), ‘Efficient Capital Markets: A Review of theory and Empirical Work’,Journal of Finance, Vol. 25, pp.383-417. Fama, E.F., (1991), ‘Efficient Capital Markets II’, The Journal of Finance, XLVI, No. 5. Fama, E.F., Fisher, L., Jensen and Roll, (1969), ‘The Adjustment of stock Price to New Information’, International Economic Review, Vol. 10, No. 1, pp 1-21 French, K., (1980), ‘Stock Returns and the Weekend Effect’, Journal of Financial Economics, Vol. 8, pp. 55-59. Galai, D. and Kedar-Levy, H., (2005), ‘Day-of-the-Week Effect in High Moments’, Financial Markets, Institutions and Instruments, Vol. 14, No. 3, pp. 169-186. Galai, D., Kedar-Levy, H. and Schreiber, B.Z., (2008), ‘Seasonality in Outliers of Daily Stock Return: A Tail that Wags the Dog?’, International Review of Financial Analysis, Vol. 17, No.5, pp 784-792. 10
- 11. Research Journal of Finance and Accounting www.iiste.org ISSN 2222-1697 (Paper) ISSN 2222-2847 (Online) Vol.4, No.4, 2013 Guidi, F., Rakesh, G., and Suneel, M.(2011), ‘Weak-form Market Efficiency and Calendar Anomalies for Eastern Europe Equity Markets, Journal of Emerging Market Finance, Vol. 10, No 337. Haque, M., Hassan, M.K. and Lawrence, S.B, ‘The Empirical Analysis of Emerging Stock Markets of Europe’, Quarterly Journal of Business and Economics, Vol. 45.1-2, pp. 31. Jain, P.C., (1986), ‘Relation between Market Model Predicted Errors and Omitted Variables: A Methodological Note”, Journal of Accounting Research, Vol. 24, No. 2, pp.187-193 Jefferis, K., and Smith, G., (2005), ‘The Changing Efficiency of African Stock Markets’, South African Journal of Economics, Vol. 73, No. 1, pp. 54-67 Jefferis, K. and Okeahalam, C. (1999), ‘International Stock Market Linkages in Southern Africa, South African Journal of Accounting Research, Vol. 13, No. 2, pp. 1-25. Kamau, D.S., (2002), ‘Turn of the Month and January Effects on Stock prices at the NSE’, Unpublished MBA Project, University of Nairobi. Kato, K., and Schallheim, J.S., (1985) ‘Seasonal and Size Anomalies in the Japanese Stock Market’, Journal of Financial Quantitative Analysis, Vol. 20, pp.243-260. Kerandi, A.M., (1993), ‘Testing the Predictive Ability of the Dividend Valuation model on Ordinary Shares’, Unpublished MBA Project, University of Nairobi. Kross, W., (1982), ‘Profitability, Earnings announcement Time Lags and Stock Prices’,Journal of Business Finance and Accounting, Vol. 9, No. 3. Lakonishok, J. and Smidt, S., (1988), ‘Are Seasonal Anomalies Real? A Ninety Year Perspective’, Review of Financial Studies, Vol. 1, No. 4, pp.403-425. Maddala, G.S., (2001), ‘Introduction to Econometrics’, 3rd ed., John Wiley & Sons, Sussex, United Kingdom. Mokua, E.M., (2003), ‘Empirical Study of The Weekend Effect on Stocks at NSE’, Unpublished MBA Project, University of Nairobi. Mwangi, M. N., (1997), ‘An analysis of Price movement for selected Stocks at Nairobi Stock Exchange’, Unpublished MBA Project, University of Nairobi. Munga, D.N., (1974), ‘The Nairobi Stock Exchange; Its History Organization and Role in the Kenyan Economy’, Unpublished MBA Project, University of Nairobi. Muriithi- Ollows, L.W., (2001), ‘The extent to which Interim Earnings can be used to Forecast’, Unpublished MBA Project, University of Nairobi. Musto, D.K., (1997), ‘Portfolio disclosures and Year-end Price Shifts’, The Journal of Finance, Vol. 52, No. 4, pp 1563-1588. Mutoko, R.K., (2006) ‘Analyzing the effect of Treasury Bills rates on Stock Market Returns’ Unpublished MBA Project, University of Nairobi. Ng, L. and Wang, Q., (2004), ‘Institutional Trading and Turn-of-the Year Effect’, Journal of Financial Economics, Vol. 74, pp. 343-366. Omosa, F., (1989), ‘Predicted ability of selected Asset Pricing Models on The Nairobi Stock Exchange’, Unpublished MBA Project, University of Nairobi. Onyuma,S.O.(2009), ‘Day-of-the-week and Month-of-the-year effect on the Kenyan Stock Market Returns’, EASSRR, Vol. XXV,No.2, pp.53-74. Pal, K., and Mittal, R., (2011), ‘Impact of Macroeconomic Indicators on Indian Capital Markets’, Journal of Risk Finance, Vol. 12, No. 2, pp.84-97. Perry, M.J., and Mehdian, S. (2001), ‘The Reversal of The Monday Effect’ :New Evidence From US Equity Markets’, Journal of Business Finance and Accounting, Vol. 28, No. 7 & 8. pp. 1043-1065. Poshakwale, S.,(1997), ‘Evidence on Weak Form Efficiency and Day of the Week Effect in the Indian Stock Market’, Finance India, Vol. X., No. 3, pp. 605-616. Rioba, G.O., (2003), ‘Predictability of Ordinary Stock Returns at the NSE in Kenya’, Unpublished MBA Project, University of Nairobi. 11
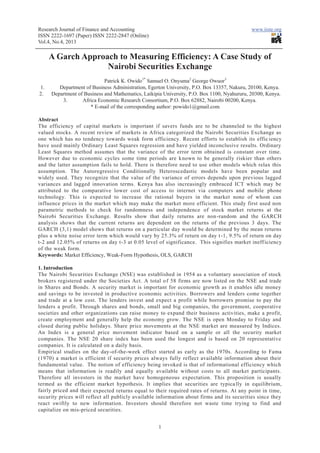
- 12. Research Journal of Finance and Accounting www.iiste.org ISSN 2222-1697 (Paper) ISSN 2222-2847 (Online) Vol.4, No.4, 2013 Rozeff, M. and Kinney, W.R., (1976), ‘Capital Market Seasonality; the Case of Stock Returns’, Journal of Financial Economics, Vol 3. No.4, pp. 379-402. Starks, L.T. , Yong, L. and Zheng, L., (2006), ‘Tax-Loss Selling and the January Effect: Evidence from Municipal Bond Closed-End Funds’, The Journal if Finance, Vol. LXI, No. 6., pp. 3049-3067. Washer, K., Nippani, S., Wingender, J., (2011), ‘Day of The Week Effect in Canadian Money Market’, Managerial Finance, Vol. 37, No.9. Yu, H.C., Chiou, I. and Jordan-Wagner, J., (2008), ‘Does the Weekday effect of the yen/dollar Spot rates exist in Tokyo, London and New York?’, Applied Economics, Vol.40, No. 20, pp. 2631-43. ACF with Bounds for NSE20 Series 0.8 Sample Autocorrelation 0.6 0.4 0.2 0 -0.2 0 2 4 6 8 10 12 14 16 18 20 Lag Figure 1: Autocorrelation Function for NSE20 Retur PACF with bounds for NSE20 Return Series 0.8 Sample Partial Autocorrelations 0.6 0.4 0.2 0 -0.2 0 2 4 6 8 10 12 14 16 18 20 Lag Figure 2: Partial Autocorrelation Function for NSE20 Returns The ACF and PACF plots show that the time series of the return on the Index has a rather considerable degree of autocorrelation between adjacent and near -adjacent observations. The ACF plot shows that if the first observation is Monday, it is highly positively correlated to F riday, Thursday and Wednesday but not as much to Tuesday or Monday. This can be seen as Friday, Thursday and Wednesday values have surpassed the upper standard deviation confidence bounds, while last Tuesday and Monday values are still within the confidenc e bounds. 12
- 13. Research Journal of Finance and Accounting www.iiste.org ISSN 2222-1697 (Paper) ISSN 2222-2847 (Online) Vol.4, No.4, 2013 Table 1. Ljung-Box-Pierce Q-Test for Index Returns H p-Value Statistic Critical Value ------------- ----------- ----------- ----------- 1.0000 0 505.5491 18.3070 1.0000 0 508.7089 24.9958 1.0000 0 529.3595 31.4104 The Ljung-Box-Pierce Q-test quantifies this departure from randomness based on the ACF of the data. The test results show that the null hypothesis H=1, is not rejected (p-Value =0.00). It can be concluded that there is significant correlation present in the Index returns at the 0.05 level. Table 2. ARCH Test for Index Returns H P-Value Statistic Critical Value ----- ---------- ----------- --------- 1.0000 0 367.2795 18.3070 1.0000 0 367.5249 24.9958 1.0000 0 379.9646 31.4104 The ARCH test results reports significant eviden ce of correlation in support of GARCH effects. NSE 20 Share Index (2006- 2011) 6500 6000 5500 5000 NSE 20 Share Index 4500 4000 3500 3000 2500 2000 0 500 1000 1500 Index Values (2006- 2011) Figure 3: Plot of the NSE 20 Share Index (2006-2011) 13
- 14. Research Journal of Finance and Accounting www.iiste.org ISSN 2222-1697 (Paper) ISSN 2222-2847 (Online) Vol.4, No.4, 2013 Returns on the NSE 20 Share Index 0.08 0.06 0.04 Daily Returns 0.02 0 -0.02 -0.04 -0.06 0 500 1000 1500 Return Series Figure 4: Plot of the Returns on the NSE 20 Share Index (2006 -2011) The plot of the NSE20 Share Index in Figure 3 and plot of Daily returns on the Index in Figure 4 for the period confirms that the data exhibits volatility clustering over the period of study. Table 3: GARCH Model Parameter estimates Standard T Parameter Value Error Statistic ----------- - ---------- ----------- ----------- C 2.4915e-005 0.00015697 0.1587 K 8.968e-006 1.0838e-006 8.2748 GARCH(1) 0.53723 0.0244 22.0179 ARCH(1) 0.39289 0.031095 12.6353 Results from fitting a GARCH(1,1) model to the NSE 20 return data Innovations 0.1 Innovation 0 -0.1 0 500 1000 1500 Conditional Standard Deviations Standard Deviation 0.1 0.05 0 0 500 1000 1500 Returns 0.1 Return 0 -0.1 0 500 1000 1500 Figure 5: Residuals, Conditional Standard Deviations and Returns Series Plots A comparison of the residuals, standard deviation and return series data obtained from the fitted model shows that the innovations (residuals) exhibit volatility clustering. 14
- 15. Research Journal of Finance and Accounting www.iiste.org ISSN 2222-1697 (Paper) ISSN 2222-2847 (Online) Vol.4, No.4, 2013 Standardized Innovations 8 6 4 Innovation 2 0 -2 -4 0 500 1000 1500 Observation Figure 6: Plot of Standardized Innovations Standardized innovations (residuals) now appear generally stable with little clustering. ACF of the Squared Standardized Innovations 0.8 Sample Autocorrelation 0.6 0.4 0.2 0 -0.2 0 2 4 6 8 10 12 14 16 18 20 Lag Figure 7: ACF of Standardized Innovations The ACF plot of the squared standardized innovations showing no autocorrelation Table 4. Ljung-Box-Pierce Q-Test for Standardized innovations Standard T Parameter Value Error Statistic ----------- ------------ ----------- ------------ 0 0.4048 10.4162 18.3070 1.0 0.0464 25.2752 24.9958 0 0.1110 27.9330 31.410 Table 5. ARCH Test for Standardized innovations Standard T Parameter Value Error Statistic -------------- ----------- ------------ ----------- 0 0.3793 10.7256 18.3070 1.0000 0.0191 28.4175 24.9958 1.0000 0.0313 33.2951 31.4104 Q and ARCH tests done on standardized residuals results ( Table 4 and Table 5) still show evidence of GARCH effects. 15
- 16. Research Journal of Finance and Accounting www.iiste.org ISSN 2222-1697 (Paper) ISSN 2222-2847 (Online) Vol.4, No.4, 2013 Table 6: GARCH (2,1) Parameter Estimates Standard T Parameter Value Error Statistic ----------- ----------- ------------ ----------- C 9.4777e-005 0.00017827 0.5316 K 9.5379e-006 1.3275e-006 7.1849 GARCH(1) 0.3076 0.068194 4.5107 GARCH(2) 0.18219 0.047318 3.8502 ARCH(1) 0.43206 0.040111 10.7716 Results from fitting a GARCH(2,1) model to the NSE 20 return data Table 7: GARCH (3,1) Parameter Estimates Standard T Parameter Value Error Statistic ----------- --------------- --------------- ----------- C 9.9774e-005 0.00018064 0.5523 K 9.5273e-006 1.3516e-006 7.0489 GARCH(1) 0.25248 0.058122 4.3439 GARCH(2) 0.095245 0.068463 1.3912 GARCH(3) 0.12059 0.053279 2.2634 ARCH(1) 0.45286 0.043833 10.3314 Results from fitting a GARCH(3,1) model to the NSE 20 return data 16
- 17. This academic article was published by The International Institute for Science, Technology and Education (IISTE). The IISTE is a pioneer in the Open Access Publishing service based in the U.S. and Europe. The aim of the institute is Accelerating Global Knowledge Sharing. More information about the publisher can be found in the IISTE’s homepage: http://www.iiste.org CALL FOR PAPERS The IISTE is currently hosting more than 30 peer-reviewed academic journals and collaborating with academic institutions around the world. There’s no deadline for submission. Prospective authors of IISTE journals can find the submission instruction on the following page: http://www.iiste.org/Journals/ The IISTE editorial team promises to the review and publish all the qualified submissions in a fast manner. All the journals articles are available online to the readers all over the world without financial, legal, or technical barriers other than those inseparable from gaining access to the internet itself. Printed version of the journals is also available upon request of readers and authors. IISTE Knowledge Sharing Partners EBSCO, Index Copernicus, Ulrich's Periodicals Directory, JournalTOCS, PKP Open Archives Harvester, Bielefeld Academic Search Engine, Elektronische Zeitschriftenbibliothek EZB, Open J-Gate, OCLC WorldCat, Universe Digtial Library , NewJour, Google Scholar