Advertising M&A Summary 2019
•
1 recomendación•307 vistas

Analysis of recent transactions in Advertising Industry detailing on Transaction Multiples (Revenue & EBITDA), Multiples Chart, Active Buyers & Transaction Data. A goldmine of resource for Entrepreneurs.

Recomendados
Recomendados
Más contenido relacionado
La actualidad más candente
La actualidad más candente (14)
Similar a Advertising M&A Summary 2019
Similar a Advertising M&A Summary 2019 (20)
Más de Alps Venture Partners
Más de Alps Venture Partners (20)
Último
Último (20)
Advertising M&A Summary 2019
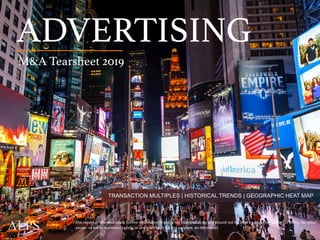
- 1. page A L P S V E N T U R E P A R T N E R S 1 TRANSACTION MULTIPLES | HISTORICAL TRENDS | GEOGRAPHIC HEAT MAP This report is intended solely for the informational and is not intended to be and should not be used by any other person or entity. No other person or entity is entitled to rely, in any manner or for any purpose, on this report. ADVERTISING! M&A Tearsheet 2019!
- 2. page A L P S V E N T U R E P A R T N E R S 2 Merger & Acquisition Summary - Advertising Valuation Summary Total Deal Value ($mm) 46,515 Average Deal Value ($mm) 150 Average TEV/Revenue 2.6x Average TEV/EBITDA 14.9x Average Day Prior Premium (%) 18% Average Week Prior Premium (%) 21% Average Month Prior Premium (%) 21% *Source: CapitalIQ, AlpsVP Analysis Date Range: Jain 1, 2013 – March 25, 2019 info@alpsvp.com Transaction Ranges Greater than $1 billion 9 $500 - $999.9 mm 12 $100 - $499.9 mm 37 Less than $100 mm 253
- 3. page A L P S V E N T U R E P A R T N E R S 3 Transaction Multiples - Trends *Source – CapitalIQ, AlpsVP Analysis 2.8x 2.3x 3.1x 2.1x 2.2x 4.4x 17.8x 13.9x 14.3x 13.6x 14.8x 19.1x 0.0x 5.0x 10.0x 15.0x 20.0x 25.0x 2014 2015 2016 2017 2018 2019 Multiples Average TEV/Revenue Average TEV/EBITDA Historical Multiples 2014 2015 2016 2017 2018 2019 5 Year Average TEV/Revenue 2.8x 2.3x 3.1x 2.1x 2.2x 4.4x 2.5x Average TEV/EBITDA 17.8x 13.9x 14.3x 13.6x 14.8x 19.1x 14.9x info@alpsvp.com
- 4. page A L P S V E N T U R E P A R T N E R S 4 Transaction Numbers - Trends *Source – CapitalIQ, AlpsVP Analysis 1 3 - 3 1 1 6 1 2 1 2 - 8 3 13 6 6 1 41 66 59 50 33 4 - 10 20 30 40 50 60 70 2014 2015 2016 2017 2018 2019 Number of Transactions > $1 billion $500 - $999.9mm $100 - $499.9mm Less than $100mm (in $ Million) 2014 2015 2016 2017 2018 2019 5 Year Average Deal Value 180.0 137.2 79.6 146.9 242.4 256.0 157.2 info@alpsvp.com
- 5. page A L P S V E N T U R E P A R T N E R S 5 Geographic Heat Map *Source – CapitalIQ, AlpsVP Analysis; Number of transactions in Major Regions; Asia Pacific – 24.6% Americas – 34.1% Europe/MENA/Africa – 41.2% info@alpsvp.com Region / Transactions Number Total Value Average Size Asia Pacific 144 11,464 80 Europe/MENA/Africa 108 19,172 178 Americas 59 15,878 269
- 6. page A L P S V E N T U R E P A R T N E R S 6 Investment Focus *Source – Data based on transactions during Jan 01, 2013 and March 25, 2019 from CapitalIQ, AlpsVP Analysis info@alpsvp.com Geographic Location Number of Transactions Average Historical Multiples Average Transaction size (USD mn) China 57 4.8x 89.8 United States 54 2.8x 293.4 United Kingdom 46 1.6x 173.4 Japan 19 1.5x 159.0 Thailand 14 2.4x 5.6 Australia 14 1.9x 137.6 Hong Kong 13 3.0x 23.6 Poland 11 1.6x 4.1 Germany 10 1.2x 56.7 South Korea 9 1.2x 87.7 France 8 1.4x 865.5 Singapore 5 3.0x 14.5 Malaysia 5 2.8x 9.6 Italy 5 1.3x 5.7 Switzerland 4 1.9x 454.0 Others 37 2.1x 52.7
- 7. page A L P S V E N T U R E P A R T N E R S 7 Largest Transactions Target Deal Value ($mm) UBM plc $6,164 Oath Inc. $4,720 Havas SA $3,216 Conversant LLC $2,449 Havas SA $1,782 Havas SA $1,628 Asatsu-DK Inc. $1,208 Infront Sports & Media AG $1,189 OOO KEH eCommerce $1,160 Dealer Dot Com, Inc. $994 *Source – CapitalIQ, AlpsVP Analysis info@alpsvp.com
- 8. page A L P S V E N T U R E P A R T N E R S 8 IND UST RY INSIG HT S
- 9. page A L P S V E N T U R E P A R T N E R S 9 Industry Outlook (1/2) [1] Source: Advertising Agencies in US published by IBISWorld, Feb 2019 info@alpsvp.com US Advertising Agencies Industry1 The Advertising Agencies industry provides creative services, advice, account management and production of advertising material across different channels for its clients. Industry operators also plan and buy media space in periodicals, newspapers, radio and TV or other media. Over the five years to 2019, the Advertising Agencies industry has benefited from growing corporate profit, consumer spending and per capita disposable income. As a result, companies have increasingly sought industry services to help them capture a growing portion of consumer spending. Overall, IBISWorld estimates industry revenue to increase an annualized 4.2% during the five-year period to $54.5 billion, including growth of 3.3% in 2019 alone. Profit, measured as earnings before taxes and interest, is expected to comprise 7.6% of industry revenue in 2019. 14.2% 13.8% 12.1% 10.1%9.2% 8.6% 7.7% 24.3% Automotive Consumer packaged goods Technology, media and telecommunication Food and beverage producers Retail Travel and entertainment Financial Services Others Growing consumer spending and low unemployment, combined with increased corporate profit, have provided companies with the means and motivation to invest in advertising services. Businesses have been able to allocate more funds toward marketing as the broader economy and corporate profit have grown. Corporate profit is estimated to increase at an annualized rate of 1.8% over the five years to 2019. During the period, rising demand for digital services has motivated more companies to enter the industry. Over the five years to 2019, the number of industry enterprises is estimated to grow at an annualized rate of 2.0% to 70,139 companies. Merger and acquisition activity has also been high, particularly amid larger companies that have sought to expand their digital capabilities by acquiring specialized agencies.
- 10. page A L P S V E N T U R E P A R T N E R S 10 Industry Outlook (2/2) [1] Source: Advertising Agencies in US published by IBISWorld, Feb 2019 info@alpsvp.com US Advertising Agencies Industry1 Over the five years to 2024, industry revenue is anticipated to continue growing at an annualized rate of 2.2% to $60.8 billion. Industry operators are anticipated to continue benefiting from growing corporate profit and consumer spending. Furthermore, as companies adapt to benefits from the growth of digital platforms, clients will seek integrated marketing solutions that combine multiple media platforms, resulting in more demand for industry services. To an extent, cross- platform advertising has posed an arduous task for advertisers, due to hurdles related to securing methodology and metrics for cross-platform analysis. Ultimately, however, it poses a potential opportunity moving forward for new companies to differentiate themselves in the industry. 46.5 49.1 50.8 52.7 54.5 55.7 56.8 57.9 59.3 60.8 4.7% 5.7% 3.5% 3.8% 3.3% 2.2% 1.9% 2.0% 2.4% 2.5% 0.0% 1.0% 2.0% 3.0% 4.0% 5.0% 6.0% 0 10 20 30 40 50 60 70 2015 2016 2017 2018 2019 2020 2021 2022 2023 2024 AdvertisingAgenciesinUSRevenue($B) Market Size ($B) Growth (%age)
- 11. page A L P S V E N T U R E P A R T N E R S 11 Alps Venture Partners has established a team of experts that have experience in valuing businesses across diverse industry sectors and all developmental stages; ranging from clients with seed funding to pre-IPO stage. With the team having experience of both valuations and audits, our detailed and insightful valuation appraisal reports, along with our responsive support, help our clients easily pass through any stringent audit review process in a smooth, efficient and time-bound manner.
- 12. page A L P S V E N T U R E P A R T N E R S 12 Corporate Finance Services We provide clients with high quality research, analytical and advisory support for transactions. We offer a range of services such as initial opportunity assessment, market analysis, financial modeling, commercial and financial due diligence, valuation, capital structure planning, and deal structuring. v Investment Opportunity Assessment v Target Identification v Preparation of Pitch Books v Buyer & Seller Services v Fairness Opinions v Financial Modeling v Business and Financial Due Diligence etc. Transaction advisory Financial Modeling Whether it is evaluating new business ventures, proposed transactions or financial and operational strategies, a robust and dynamic financial model is an integral component to the decision- making process. Transaction Identification We can help by global target identification considering the requirements with maximum synergy. The financial due diligence process is a necessity to any transaction. Our aim is to enable owners and managers to make such investments with confidence by supporting and advising at every stage. We will help reduce the risk – and stress – of investing at home or in another country. Due Diligence Custom Research We provide clients with customized research report, model, decks with client specific requirements such as: v Business plan development, v Diagnostic review of operations v Competitor benchmark analysis v Intellectual Property info@alpsvp.com
- 13. page A L P S V E N T U R E P A R T N E R S 13 Financial Reporting and Tax Compliance Services IRC 409a We have experience of handling more than 2000+ 409a valuations across Industries. With the team having experience of both valuations and audits, our detailed and insightful Section 409A appraisal reports, along with our responsive support, help our clients easily pass through any stringent audit review process in a smooth, efficient and time-bound manner. Fair Value Measurement We help PE and VC clients to comply with ASC 820 and IFRS 13 standard’s complex provisions and avoid any audit issues in their quarterly and annual reporting. Relative TSR Programs We value the awards with Relative TSR metrics, using sophisticated modeling techniques which allow clients to quickly and accurately value new grants. Our business valuation experienced team along with the team of veteran Patent lawyers position us uniquely to assist clients in completing annual Goodwill and Investment Impairment testing. ASC 350 / IAS 38 ASC 718 (FAS 123R)/IFRS 2 Our experienced team at Alps Venture Partners has performed hundreds of stock options valuations for ASC 718 for privately held companies and publicly listed companies across diverse industry sectors and enterprise development stages. ASC 805 / IFRS 3 We have unmatched proficiency in delivering Business Combinations Accounting solutions to clients in v a r i e d i n d u s t r i e s . O u r comprehensive USPAP compliant appraisal reports are auditable and cost-effective, and help our clients stay focused on the deal. IRC 83 B Election Alps Venture Partners has extensive experience in assisting companies seeking to comply with IRC 83 B election. Failing to make a timely 83(b) election may lead to disastrous tax consequences for a start-up company founder or employee. info@alpsvp.com
- 14. page A L P S V E N T U R E P A R T N E R S 14 Disclaimer The contents of this presentation are protected by copyright. You may read the contents and make copies for your own personal use. You may also give copies of reasonable extracts, on an occasional basis, free of charge to your contacts for their personal use provided that Alps Venture Partners is acknowledged as the source, the text is not altered in any way, and this warning is brought to their attention. Any other use or copying of the contents of this presentation is prohibited, unless Alps Venture Partners gives its prior written consent. For further information please contact us at info@alpsvp.com Pursuant to Title 17, United States Code, Section 512(c)(2), notifications of claimed copyright infringement under United States copyright law should be sent to Service Provider’s Designated Agent. ALL INQUIRIES NOT RELEVANT TO THE ABOVE PROCEDURE WILL RECEIVE NO RESPONSE. This Agreement (and any further rules, policies, or guidelines incorporated by reference) shall be governed and construed in accordance with the laws of the United States (USA), United Kingdom, Canada, Brazil, France, and India without giving effect to any principles of conflicts of law. Alps Venture Partners welcomes your questions or comments regarding this Statement of Privacy. If you believe that Alps Venture Partners has not adhered to this Statement, please contact Alps Venture Partners at our given toll free contact numbers. Copyright © 2019 ALPS VENTURE PARTNERS. All Rights Reserved