Traditional asset classes appear to offer uninspiring beta returns at present, and recent years’ hedge fund returns have disappointed both in magnitude and diversification benefits, likely reflecting capacity pressures associated with the concentration of AUM and inflows with larger funds. We argue that, by contrast, Emerging hedge funds offer a rich opportunity set with far fewer capacity issues where skilled managers with concrete competitive advantages in less efficient, smaller capitalization market segments can generate better, more sustainable and less correlated excess returns. Emerging managers do involve more investment and operational risk than larger peers; to that challenge we offer some suggestions on a thoughtful and rigorous approach to constructing an Emerging Managers allocation and balancing effective due diligence with scalability.
logistics industry development power point ppt.pdf
Why Emerging Managers Now? - Infusion Global Partners Whitepaper
1. 1
Why Emerging Managers Now?
Infusion Global Partners
Whitepaper May 5, 2015
Abstract:
Traditional asset classes appear to offer uninspiring beta returns at present, and recent years’ hedge fund
returns have disappointed both in magnitude and diversification benefits, likely reflecting capacity pressures
associated with the concentration of AUM and inflows with larger funds. We argue that, by contrast,
Emerging hedge funds offer a rich opportunity set with far fewer capacity issues where skilled managers
with concrete competitive advantages in less efficient, smaller capitalization market segments can generate
better, more sustainable and less correlated excess returns. Emerging managers do involve more investment
and operational risk than larger peers; to that challenge we offer some suggestions on a thoughtful and
rigorous approach to constructing an Emerging Managers allocation and balancing effective due diligence
with scalability.
2. 2
1. Introduction: Searching for Beta and Alpha
Most investors would agree that the current market environment makes their return goals particularly
challenging. Equity markets are at or near all-time highs and relatively expensive by most metrics. Prospects
for bond returns continue to be severely repressed by central bank policy – to negative yields in several
cases! – and credit spreads offer little compensation for default risk that is likely to grow as the current
expansion ages and becomes more fragile. Real estate has been significantly bid up in the global search for
yield and shows signs of overcapacity in a growing number of markets and segments, and the supply-demand
imbalances that have pressured commodities lower over the past year look set to continue for some time.
With “beta” returns thus expected to offer meager risk-adjusted returns over the near term, many investors
have increased their focus on alternatives, and hedge funds in particular. In fact, assets continue to flow into
hedge funds; hedge fund AUM is estimated to have grown at an average rate of 16% since 2008 and reached
a peak of $2.5 trillion in 2014 according to Eurekahedge.1
However, this dynamic may have a self-defeating
aspect in at least two ways. Larger asset volumes are more likely to face capacity pressures that limit return
potential (which we will discuss in more detail), and to increase correlations with broad market indexes and
thus reduce diversification benefits. Both trends are evident in the data from recent years: Figure 1 below
shows that average hedge fund returns fluctuated in a range mostly above 10% until 2011 (with a large dip
through the Global Financial Crisis), but since that time have languished around or even below 5%. Figure 2
illustrates the deterioration of diversification benefits, as hedge fund correlations with major market indexes
now exceed 0.75 in some cases.
1
Hedge fund reporting is voluntary, so figures vary across data providers, but other estimates are similar.
-20.0%
-15.0%
-10.0%
-5.0%
0.0%
5.0%
10.0%
15.0%
20.0%
25.0%
Jan2006
Jul2006
Jan2007
Jul2007
Jan2008
Jul2008
Jan2009
Jul2009
Jan2010
Jul2010
Jan2011
Jul2011
Jan2012
Jul2012
Jan2013
Jul2013
Jan2014
Jul2014
Jan2015
Figure 1: Hedge Fund Returns Lower in Recent Years
Eurekahedge Main Hedge Fund Index, Rolling 12-month returns. Source: Eurekahedge.
3. 3
One attractive alternative may be to focus on Emerging hedge funds – those with smaller assets under
management that are much less likely to be hampered by capacity issues. The opportunity set of emerging
managers is many times the size that of larger funds, with literally thousands of funds under $200 million in
assets under management (a common but arbitrary definition). Evidence shows that smaller managers have
historically outperformed larger managers on average, and above-average emerging managers have
outperformed correspondingly above-average (e.g. 60th
percentile in respective universes) larger managers
more substantially. Several rationales support the logic of an emerging manager focus, including the ability
to operate, and focus more heavily on best ideas, in smaller capitalization segments of markets which tend to
be less efficient and where concrete competitive advantages are more plausible and viable. Smaller funds do
entail additional investment and operational risk, which we address in the final section of this whitepaper.
2. Are Smaller Capitalization Market Segments Less Efficient?
Market efficiency is a multi-dimensional concept about which investors have widely differing opinions. A
market’s efficiency is thought to be correlated with its trading volume, depth of analyst coverage,
transparency of pricing, and other factors. Most of these factors are correlated with each other, providing
support for the view that larger capitalization markets are relatively more efficient and smaller capitalization
markets less efficient. However, is it possible to measure market efficiency objectively and quantitatively?
The most widely accepted academic definition is that a market is efficient if it is not possible to earn excess
risk-adjusted returns using publicly available information. This is commonly approximated by testing for
statistical significance in the prediction of returns using public information. A simple measure of such
predictability is autocorrelation, the correlation of a security’s returns with its own lagged returns.2
To
compare the efficiency of large vs. small cap US stocks, we computed autocorrelations using daily returns
over the period 2011-2014, for each constituent of the Russell 2000 and S&P 500 universes. The expected
value for each autocorrelation under the assumption of market efficiency is zero, with a standard deviation of
about 0.03. Figure 3 below plots the resulting distributions of the 2000 and 500 coefficients for the two
universes, along with the confidence interval where estimated coefficients are not significantly different from
2
This measure was used in Fama’s seminal 1970 paper on testing market efficiency.
0.50
0.55
0.60
0.65
0.70
0.75
0.80
0.85
0.90 Jan2006
Jul2006
Jan2007
Jul2007
Jan2008
Jul2008
Jan2009
Jul2009
Jan2010
Jul2010
Jan2011
Jul2011
Jan2012
Jul2012
Jan2013
Jul2013
Jan2014
Jul2014
Jan2015
Figure 2: High Hedge Fund-Market Correlations
Rolling 36-month correlation between Eurekahedge main Hedge Fund Index and S&P 500
4. 4
zero. It shows that the small cap universe has a much larger percentage of stocks (and number of stocks,
since the universe is four times larger) with significant autocorrelations, consistent with the smallcap market
being much less efficient.
A broader view of market efficiency comes from academic and practitioner research on the many
“anomalies”, including value, price and earnings momentum, and other factors, that have been shown to
generate excess risk-adjusted returns in a wide range of markets and time periods.3
Researchers have
consistently found that returns to these anomalies are larger and more statistically significant in smaller cap
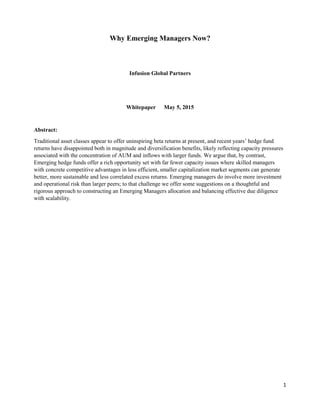
market segments. Figure 4 is a recent example from a paper by Israel and Moskowitz, showing long/short
returns for Value (measured by book-to-price ratio) and Momentum (measured by past one-year returns,
excluding the most recent month) in US stocks divided into five groups by market capitalization. The dark
section of the bars shows the return from the top 1/5 of stocks ranked by the factor, and the lighter section
represents the return from shorting the bottom 1/5 of stocks in each cap bin. For momentum, the returns in
the largest cap bin (approximately the S&P 500) averaged 300 to 400 basis points lower than the returns in
the smaller cap bins, and for value the returns in the two largest cap bins were far below those in the smaller
cap bins, again consistent with larger capitalization markets being more efficient.4
3
Amongst a very lengthy list of references, see Asness, Moskowitz and Pedersen, “Value and Momentum Everywhere”
[2010] and Fama and French “Dissecting Anomalies” [2008].
4
The smallest cap bin is primarily microcap; bins 2 and 3 correspond to the smaller and larger half of smallcap, bin 4 to
mid-cap, and bin 5 to large cap. See Israel and Moskowitz (2013) for more details.
0.0%
5.0%
10.0%
15.0%
20.0%
25.0%
30.0%
35.0%
40.0%
45.0%
-0.25 -0.2 -0.15 -0.1 -0.05 0 0.05 0.1 0.15 0.2 0.25
Figure 3: Distribution of Autocorrelation Coefficients
Russell 2000 S&P 500
95% confidence interval
5. 5
Figure 4: Returns to Momentum and Value in US Equities by Size Category
3. Benefits of Being Small
a) Concrete Competitive Advantages
Every active investment manager strives to have some edge that will allow them to outperform. These
competitive advantages are usually a function of proprietary information that the manager is able to obtain or
generate, about the securities and forces affecting them in the target universe. Larger capitalization markets,
almost without exception, have greater analyst coverage, newsflow, and other readily available information,
making it harder for any manager to have a concrete edge in that segment of the market. We believe that
areas with less analyst coverage and newsflow, where information is scarcer and more proprietary, offer
greater opportunities for a manager to have an edge. These markets usually have lower capitalization and less
liquidity, which constrains the size of managers able to operate in those market segments.
b) Best Ideas and Market Niches
Most managers have a formal or informal process for ranking their candidate investments, and believe that
their top ideas are likely to outperform others further down the spectrum. This is supported by academic
evidence confirming that best ideas outperform other portfolio constituents, across a wide range of
investment styles and time periods.5
It almost goes without saying that smaller managers are more able to operate in smaller capitalization market
segments, both in terms of the positions they hold and in their trading. To illustrate, consider a large fund
with AUM of $1b and an emerging manager with $100m, both considering a $500m capitalization small cap
stock as a best idea. 5% is a common figure both as an upper bound of the amount a manager would want to
hold of any company’s stock, and a portfolio weighting large enough to be a meaningful high-conviction
position. 5% of a billion dollars is $50 million, or an unacceptably high 10% of the stock’s capitalization;
5
“Best Ideas”, Cohen, Polk and Silli, MIT working paper 2010.
6. 6
building such a position would also entail either a long time period or taking a large majority of daily trading
volume for several days which would likely move the price so much that it degrades the return opportunity
(and present issues in exiting the position as well). The small manager, by contrast, can amass a 5% portfolio
position in the stock by owning only 1% of the outstanding shares, and since volume for many stocks
exceeds 1% of outstanding shares daily, trading in and out of such a position would be quite feasible.
4. The Emerging Manager Opportunity Set
Having established that smaller capitalization market segments tend to be less efficient, and that smaller
funds are more able to operate and have an edge in those segments, we now take a look at the emerging
manager opportunity set.
Figure 4 is a scatter plot of Eurekahedge’s database of 16,000+ funds’ annualized returns against their assets
under management, with each point in the cloud representing a fund.6
The dominant feature in the data is the
much greater dispersion of returns for smaller managers vs. larger peers. While some of that dispersion is on
the downside, we see rich potential in the thousands of funds in the northwest corner of the chart.
Specifically, there are more than 2500 funds under $200m with annualized returns over 10%, and only 186
funds over $1 billion with comparable performance. Many of those high-performance, smaller funds operate
6
We exclude all funds with AUM listed as either 0 or missing, and outlier returns above +50% (of which there are 93)
or below -30% (of which there are 61), resulting in 14,302 datapoints. Returns are from inception through March 2015
(or last reporting date – data includes dead funds to limit survivorship bias); AUM figures are as of the end of the return
period. Vertical clusters are often different currency share classes of a fund.
-30
-20
-10
0
10
20
30
40
50
0 500 1000 1500 2000 2500 3000 3500 4000 4500 5000
%
USD millions
Figure 5: Annualized Return vs. AUM
Source: Eurekahedge
7. 7
in less efficient market segments with concrete competitive advantages. We now turn to some suggestions
for how to validate those characteristics and mitigate associated investment and operational risk.
5. Constructing an Emerging Managers Allocation
a) Inefficiencies, Structural Advantages, and Risk/Return Evaluation
As mentioned above, we believe that skilled managers are more likely to be able to generate a sustainable
competitive advantage in less efficient market segments, which underlies our preference for small cap.
However, capitalization is only one dimension of efficiency. Here we briefly touch on some other
characteristics of markets associated with inefficiencies.
One relates to the investor base. If a substantial percentage of the capital in a space is not focused on return
maximization, to the point of being the marginal buyer or seller, that is likely to leave opportunities for
alpha-seeking participants. A large and important such investor group is the world’s central banks, with their
involvement in bond and currency markets. In our estimation, fund manager returns from trying to predict
central banks’ effects on these markets have been quite mixed, but there is no question that the magnitudes,
breadth and persistence of those effects have been sizeable.
A second class of market participant that is often not return optimizing, and that has grown dramatically in
recent years, is ETFs. Many ETFs follow rules for trading and security inclusion/exclusion that create
opportunities that others may exploit, such as mechanically rolling futures contracts or pro-rata purchases of
eligible offerings. A third theme that has been important in recent years is demand for yield with much less
regard for total return, which has fueled appreciation of high-dividend shares.
Market efficiency can also be hampered by impediments to the flow of information about prices and trading
volumes. For example, real-time pricing is available for most equities, government bonds, and foreign
exchange, but US municipal bonds (a $3.7 trillion market) have no centralized source for intraday pricing
and a large percentage of the thousands of bonds in that market do not trade on a typical day. Similar
conditions exist for structured products such as residential and commercial mortgage-backed securities and
some high-yield bonds. This provides an opportunity for funds with superior price estimation capabilities –
perhaps based on data or modeling – to have a concrete edge over competitors.
While Emerging Managers typically have short track records, we believe it is still important to evaluate as
rigorously as possibly their live performance, not only on an absolute and risk-adjusted basis, but also in the
context of the investment environment. This may be facilitated by relevant and verifiable track records from
previous organizations, which can partially ameliorate the challenges of short track records. In our view,
however, there is no substitute for a thorough understanding of the manager’s investment process from idea
generation through to trade execution.
One measure we find quite useful is “unlevered real alpha”, which we define to be the returns generated after
adjusting for leverage and any passive exposure to a market. For example, if a manager generated returns of
18%, using 200% gross exposure and a beta to the relevant market of 0.5 in a year where the market was up
10%, the unlevered alpha would be 6.5% = (18 – 0.5*10)/2 since 5% of the returns were attributable to beta
and half of the remaining 13% came from leverage. Unlevered real alpha is a useful reference value for
comparing managers’ underlying return generation capability and, when broken down in different
dimensions such as long vs. short, per trade, by sector, etc. can greatly deepen understanding of a strategy.
8. 8
b) Investment Risk Management
Emerging Managers are viewed as being substantially more risky than their larger peers, which makes sense,
since smaller portfolios can take positions in smaller, more volatile securities than large funds, smaller
portfolios may be less diversified, and small funds likely have more limited resources for independent risk
and middle/back office functions. In fact, however, the difference is often not large: for example, the median
Eurekahedge fund under $200m AUM has a volatility of returns of about 10%, while that of the median fund
larger than $200m is about 7.5%. It is not difficult to construct a portfolio of 5-10 emerging manager
strategies with volatility below 7.5%, which is more in the range of bonds than equities.
However, volatility is a crude proxy for the downside investment risk that most investors are truly concerned
with, in the case of emerging as with larger managers. Direct, statistical analysis of downside risk using
measures such as Sortino, MAR and Omega ratios is helpful but often provides limited benefit even with
several years of data to work with, given that important risks can lie in tails and are rarely observed. As with
the investment process, we believe there is no substitute for a good understanding of the key sources of
investment risk: exposure concentration, leverage, and liquidity. It is essential to validate that constraints and
procedures are in place to mitigate excessive risk exposure, such as limits on individual position sizes and
exposures to the overall market and particular industries, sectors, countries, or currencies.
Leverage is another key source of risk that can be challenging to understand and compare across strategies
since it may be defined, employed, and obtained in different ways depending on the context. For example,
futures and options contain embedded leverage and a strategy may implicitly have considerable leverage-
related risk despite a large percentage of AUM kept in cash (low margin to equity ratio). In cash-instrument
strategies, a given amount of leverage may lead to dramatically different risk depending on how hedged the
resulting leveraged positions are. For example, one fund may run at 500% gross exposure ($5 invested for
each $1 of AUM) but keep the portfolio very close to neutral exposure in all key dimensions, and be less
risky than a more directional fund with little or no leverage.
Liquidity is a third key source of risk that has been the driving factor in many hedge fund failures. In our
view, it is crucial to understand and validate that the liquidity of portfolio holdings is consistent with the
liquidity terms of the fund, so that managers do not find themselves needing to be a forced seller to meet
redemptions, or even to gate. Of course this needs to be evaluated under both normal and stress conditions,
since in some asset classes liquidity can deteriorate quickly and dramatically (though in equities and many
futures markets, trading volumes typically rise in a crisis).
A key tool in the risk kit is transparency. At its essence is the idea that to control something you need to be
able to measure it. Managers need to know their cash positions and exposures in order to accurately assess
risk, and analytic risk software packages take position or exposure level data as inputs. Historically, hedge
fund managers have maintained considerable secrecy about the details of their portfolios, in part to protect
their intellectual property. However, with the increase in concern about risk in recent years, and the shift in
hedge fund AUM from a primarily high net worth/family office base to a more institutional orientation,
investors are demanding, and managers are providing, more transparency.
We believe that portfolio transparency can greatly mitigate risks of emerging managers in two important
ways. The first is in facilitating understanding of each manager’s behavior, where a key concern is style drift.
Generally a manager has been hired based on his or her expertise in a particular area – pairs trading, merger
arb, fundamentally valuing US healthcare stocks – and any deviation from past patterns of holdings, trading
frequency, or risk exposures should be questioned and understood (and may be cause for withdrawal). The
second benefit of transparency is in understanding the aggregation of exposures across the portfolio to any
9. 9
market, industry, currency, commodity, or liquidity. We advocate the use of separately managed accounts
whenever possible, both for the transparency they provide and for their operational and liquidity advantages.
c) Operational Risk Management
A significant component of the perceived risks of investing with emerging managers relates to operations.
With small teams, short track records, and niche strategies – which may be located outside the US and more
difficult to understand than more standard approaches like long/short equity, – investors are rightly
concerned about middle and back office matters. We believe that it is essential to perform operational due
diligence to confirm that the team has effective and professional processes for settling and confirming trades,
prime broker and administrator relationships and processes, meets regulatory requirements, has controls to
mitigate fraud risk, and disaster recovery procedures amongst the many aspects of Op DD.
d) Constructing an Emerging Managers Allocation
Overall, we believe that emerging hedge funds offer a rich opportunity set without the capacity issues
impacting the broader hedge fund market, where skilled managers with concrete competitive advantages in
less efficient, smaller capitalization market segments can generate better, more sustainable and less
correlated excess returns. The investment and operational risks should not be underestimated, but evaluated
in the same way alternative risk/reward choices are traditionally assessed: by estimating the degree to which
the risk can be mitigated and diversified, and then whether the additional expected return justifies the
increased risk.
The resource commitment required to assess this risk-return tradeoff, when combined with the limited
capacity that is inherent in the more attractive emerging manager strategies, may present a challenge to
investors who either need to allocate substantial minimums or have limited staff availability or expertise. In
this case, it may make sense to outsource the emerging manager allocation to a specialist who can identify,
diligence and monitor best-in-class funds, and combine them in a portfolio to achieve both diversification
benefits as well as more scalability than individual funds would be able to offer.
References
Asness, C.J., T.J. Moskowitz and L.H. Pederson, “Value and Momentum Everywhere,” Journal of
Finance 2013.
Cohen, Polk and Silli, “Best Ideas,” MIT Working Paper, 2010.
Fama, E., “Efficient Capital Markets: A Review of Theory and Empirical Work,” Journal of Finance
1970.
Fama, E. and K. French, “Dissecting Anomalies,” Journal of Finance 2008.
Israel, R. and T.J. Moskowitz, “The role of shorting, firm size, and time on market anomalies”, Journal
of Financial Economics 2013.