1. Please refer to important disclosures at the end of this report 1
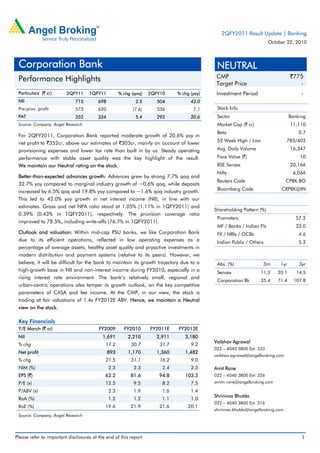
Particulars (` cr) 2QFY11 1QFY11 % chg (qoq) 2QFY10 % chg (yoy)
NII 715 698 2.5 504 42.0
Pre-prov. profit 573 620 (7.6) 536 7.1
PAT 352 334 5.4 292 20.6
Source: Company, Angel Research
For 2QFY2011, Corporation Bank reported moderate growth of 20.6% yoy in
net profit to `352cr, above our estimates of `303cr, mainly on account of lower
provisioning expenses and lower tax rate than built in by us. Steady operating
performance with stable asset quality was the key highlight of the result.
We maintain our Neutral rating on the stock.
Better-than-expected advances growth: Advances grew by strong 7.7% qoq and
32.7% yoy compared to marginal industry growth of ~0.6% qoq, while deposits
increased by 6.5% qoq and 19.8% yoy compared to ~1.6% qoq industry growth.
This led to 42.0% yoy growth in net interest income (NII), in line with our
estimates. Gross and net NPA ratio stood at 1.05% (1.11% in 1QFY2011) and
0.39% (0.43% in 1QFY2011), respectively. The provision coverage ratio
improved to 78.5%, including write-offs (76.7% in 1QFY2011).
Outlook and valuation: Within mid-cap PSU banks, we like Corporation Bank
due to its efficient operations, reflected in low operating expenses as a
percentage of average assets, healthy asset quality and proactive investments in
modern distribution and payment systems (relative to its peers). However, we
believe, it will be difficult for the bank to maintain its growth trajectory due to a
high-growth base in NII and non-interest income during FY2010, especially in a
rising interest rate environment. The bank’s relatively small, regional and
urban-centric operations also temper its growth outlook, on the key competitive
parameters of CASA and fee income. At the CMP, in our view, the stock is
trading at fair valuations of 1.4x FY2012E ABV. Hence, we maintain a Neutral
view on the stock.
Key Financials
Y/E March (` cr) FY2009 FY2010 FY2011E FY2012E
NII 1,691 2,210 2,911 3,180
% chg 17.2 30.7 31.7 9.2
Net profit 893 1,170 1,360 1,482
% chg 21.5 31.1 16.2 9.0
NIM (%) 2.3 2.3 2.4 2.3
EPS (`) 62.2 81.6 94.8 103.3
P/E (x) 12.5 9.5 8.2 7.5
P/ABV (x) 2.3 1.9 1.6 1.4
RoA (%) 1.2 1.2 1.1 1.0
RoE (%) 19.6 21.9 21.6 20.1
Source: Company, Angel Research
NEUTRAL
CMP `775
Target Price -
Investment Period -
Stock Info
Sector Banking
Market Cap (` cr) 11,110
Beta 0.7
52 Week High / Low 785/402
Avg. Daily Volume 16,347
Face Value (`) 10
BSE Sensex 20,166
Nifty 6,066
Reuters Code CPBK.BO
Bloomberg Code CRPBK@IN
Shareholding Pattern (%)
Promoters 57.2
MF / Banks / Indian Fls 33.0
FII / NRIs / OCBs 4.6
Indian Public / Others 5.2
Abs. (%) 3m 1yr 3yr
Sensex 11.3 20.1 14.5
Corporation Bk 35.4 71.4 107.8
Vaibhav Agrawal
022 – 4040 3800 Ext: 333
vaibhav.agrawal@angelbroking.com
Amit Rane
022 – 4040 3800 Ext: 326
amitn.rane@angelbroking.com
Shrinivas Bhutda
022 – 4040 3800 Ext: 316
shrinivas.bhutda@angelbroking.com
2QFY2011 Result Update | Banking
October 22, 2010
Corporation Bank
Performance Highlights
3. Corporation Bank | 2QFY2011 Result Update
October 22, 2010 3
Strong advances growth continues
During 2QFY2011, Corporation Bank witnessed higher-than-industry growth in
advances and deposits. Advances increased by a robust 32.7% yoy and 7.7% qoq
to `69,780cr, considerably above the industry’s sequential growth of ~0.6%.
Deposits grew by a healthy 19.8% yoy and 6.5% qoq to `96,920cr, above the
industry’s sequential growth rate of ~1.6%. As a result, the credit-deposit ratio
came in at 72.0%, registering an improvement of 80bp from 1QFY2011. The key
drivers for growth in advances were SME loans and agricultural loans, which grew
by 40.1% yoy and 50.9% yoy, respectively.
The bank’s CASA ratio improved to 25.0% in 2QFY2011 from 24.1% in
1QFY2011. By FY2011, the bank aims to improve its CASA ratio further to 26%.
Exhibit 3: Trend in advances and deposits
Source: Company, Angel Research
Exhibit 4: CASA ratio continues to be low at 25%
Source: Company, Angel Research
60.0
64.0
68.0
72.0
76.0
-
20,000
40,000
60,000
80,000
100,000
120,000
3QFY08
4QFY08
1QFY09
2QFY09
3QFY09
4QFY09
1QFY10
2QFY10
3QFY10
4QFY10
1QFY11
2QFY11
Advances (LHS) Deposits (LHS) Credt-Deposit ratio (RHS)
(` cr) (%)
10
18
9 8 9 15 9 10
15
14
15 14 14
14
15 15
75
69
77 78 77
71
76 75
0%
20%
40%
60%
80%
100%
3QFY09
4QFY09
1QFY10
2QFY10
3QFY10
4QFY10
1QFY11
2QFY11CA SA Term Deposits
4. Corporation Bank | 2QFY2011 Result Update
October 22, 2010 4
Improvement in CD ratio drives NII growth
On the back of strong lending in 2QFY2011, the bank’s NII increased by 42.0%
yoy and 2.5% qoq to `715cr (from `698cr in 1QFY2011), driven by a 80bp
sequential improvement in the CD ratio to 71.0%. The bank’s reported NIM
improved marginally to 2.64% in 2QFY2011 from 2.62% in 1QFY2011.
Going forward, the bank is expected to face NIM pressure in a rising interest rate
environment on account of its relatively low CASA.
Exhibit 5: Trend in reported NIM
Source: Company, Angel Research
Non-interest income declines due to a high base effect
During 2QFY2011, total non-interest income declined by 25.3% yoy to `226.1cr
due to lower treasury gains. Non-interest income excluding treasury declined by
2.8% yoy to `222cr. Profit from exchange transaction declined by 56.0% yoy to
`17cr, while income from recovery of written-off accounts increased by 13.3% yoy
to `31cr. As expected, Corporation Bank recorded lower treasury gain of `4.5cr
during 1QFY2011 compared to `74.7cr in 2QFY2010.
Stable asset quality
During the quarter, asset quality largely remained stable and the bank improved
its provision coverage ratio to 78.5% in 2QFY2011 from 76.7% in 1QFY2011.
Gross NPAs increased marginally by 1.9% sequentially to `740cr. Net NPAs stood
at `270cr compared to `276cr in 1QFY2011. Gross and net NPA ratio of the
bank stood at 1.05% (1.11% in 1QFY2011) and 0.39% (0.43% in 1QFY2011),
respectively. The provisioning expenses were substantially lower than expected.
The provision/average assets ratio came by 9bp sequentially to 0.34% during the
2QFY2011. With the improvement in asset quality, we have reduced the
provisioning expenses estimates for FY2011 by 13.8% and for FY2012 by 12.4%.
The bank additionally restructured advances worth `100cr during the quarter.
Restructured advances as a percentage of total advances and net worth stood at
4% and 43.2%, respectively.
2.26 2.30
2.54 2.50
2.62 2.64
1.60
2.00
2.40
2.80
1QFY10 2QFY10 3QFY10 4QFY10 1QFY11 2QFY11
Reported NIM(%)
5. Corporation Bank | 2QFY2011 Result Update
October 22, 2010 5
Exhibit 6: Trend in asset quality
Source: Company, Angel Research; Note: Coverage ratio excluding technical write-offs till 3QFY2010
Operating costs rise
Operating costs increased by 35.9% yoy and 7.2% qoq to `368cr during the
quarter. The cost-to-income ratio stood at 39.1%, substantially higher than its
eight-quarter average of 35.3%. The bank has adequately provided for gratuity as
per the revised norms. As per the management, the pension liability is estimated to
be `600cr, if all the employees opt for the new pension scheme.
During the quarter, Corporation Bank opened 12 branches, taking its total branch
network to 1,171. The number of ATMs increased to 1,159 in 2QFY2011
compared to 1,145 in 1QFY2011.
Exhibit 7: Trend in opex
Source: Company, Angel Research
40
50
60
70
80
90
-
200
400
600
800
3QFY08
4QFY08
1QFY09
2QFY09
3QFY09
4QFY09
1QFY10
2QFY10
3QFY10
4QFY10
1QFY11
2QFY11
Gross NPAs Net NPAs Coverage (RHS)(` cr) (%)
40.1 39.5 40.9
26.8
30.9
33.6 35.2
40.3
35.6
39.1
-
10.0
20.0
30.0
40.0
50.0
-
50
100
150
200
250
1QFY09
2QFY09
3QFY09
4QFY09
1QFY10
2QFY10
3QFY10
4QFY10
1QFY11
2QFY11
Staff costs (` cr) Other opex (` cr) Cost-to-income ratio (%, RHS)
6. Corporation Bank | 2QFY2011 Result Update
October 22, 2010 6
Capital adequacy – One of the best in PSU banks
Corporation Bank is one of the well-capitalised banks among PSU banks. As per
Basel-II norms, the bank’s capital adequacy ratio (CAR) stood comfortable at
14.5% during 2QFY2011, with Tier-I ratio of 8.3%.
Exhibit 8: Comfortable capital adequacy
Source: Company, Angel Research
9.7 8.9 9.6 10.8 10.4 9.3 8.6 8.3
3.1 4.7
6.7
7.4 6.9
6.1 6.5 6.2
-
4.0
8.0
12.0
16.0
20.0
3QFY09
4QFY09
1QFY10
2QFY10
3QFY10
4QFY10
1QFY11
2QFY11
Tier-I CAR Tier-II CAR
7. Corporation Bank | 2QFY2011 Result Update
October 22, 2010 7
Investment arguments
Modern, cost-efficient network to support moderate CASA growth
From FY2007–10, growth in average CASA deposits was robust relative to peers at
22.4%. We believe the bank’s efficient and expanding network, supported by a
consistent track record in early adoption of emerging technologies, creates a
positive traction in its deposit franchise, which is tempered mainly by substantial
competition from larger banks.
Low operating cost, superior asset quality owing to corporate,
urban-centric business
Large corporates comprise 38% of the bank’s credit book, leading to relatively low
yield on advances but, at the same time, offering superior asset quality to the
bank. Corporation Bank is also amongst the most cost-efficient PSU banks, both in
terms of opex/average assets as well as branch and employee productivity.
Outlook and valuation
Within mid-cap PSU banks, we like Corporation Bank due to its efficient
operations, reflected in low operating expenses as a percentage of average assets,
healthy asset quality and proactive investments in modern distribution and
payment systems (relative to its peers). However, we believe it will be difficult for
the bank to maintain its growth trajectory due to a high-growth base in NII and
non-interest income reported in FY2010, especially in a rising interest rate
environment. Further, the bank’s relatively small, regional and urban-centric
operations temper its growth outlook, primarily on the key competitive parameters
of CASA and fee income.
At the CMP, the stock is trading at fair valuation of 1.40x FY2012E ABV. Hence,
we maintain a Neutral view on the stock.
12. Corporation Bank | 2QFY2011 Result Update
October 22, 2010 12
Research Team Tel: 022 - 4040 3800 E-mail: research@angeltrade.com Website: www.angeltrade.com
DISCLAIMER
This document is solely for the personal information of the recipient, and must not be singularly used as the basis of any investment
decision. Nothing in this document should be construed as investment or financial advice. Each recipient of this document should make
such investigations as they deem necessary to arrive at an independent evaluation of an investment in the securities of the companies
referred to in this document (including the merits and risks involved), and should consult their own advisors to determine the merits and
risks of such an investment.
Angel Broking Limited, its affiliates, directors, its proprietary trading and investment businesses may, from time to time, make
investment decisions that are inconsistent with or contradictory to the recommendations expressed herein. The views contained in this
document are those of the analyst, and the company may or may not subscribe to all the views expressed within.
Reports based on technical and derivative analysis center on studying charts of a stock's price movement, outstanding positions and
trading volume, as opposed to focusing on a company's fundamentals and, as such, may not match with a report on a company's
fundamentals.
The information in this document has been printed on the basis of publicly available information, internal data and other reliable
sources believed to be true, but we do not represent that it is accurate or complete and it should not be relied on as such, as this
document is for general guidance only. Angel Broking Limited or any of its affiliates/ group companies shall not be in any way
responsible for any loss or damage that may arise to any person from any inadvertent error in the information contained in this report.
Angel Broking Limited has not independently verified all the information contained within this document. Accordingly, we cannot testify,
nor make any representation or warranty, express or implied, to the accuracy, contents or data contained within this document. While
Angel Broking Limited endeavours to update on a reasonable basis the information discussed in this material, there may be regulatory,
compliance, or other reasons that prevent us from doing so.
This document is being supplied to you solely for your information, and its contents, information or data may not be reproduced,
redistributed or passed on, directly or indirectly.
Angel Broking Limited and its affiliates may seek to provide or have engaged in providing corporate finance, investment banking or
other advisory services in a merger or specific transaction to the companies referred to in this report, as on the date of this report or in
the past.
Neither Angel Broking Limited, nor its directors, employees or affiliates shall be liable for any loss or damage that may arise from or in
connection with the use of this information.
Note: Please refer to the important `Stock Holding Disclosure' report on the Angel website (Research Section). Also, please
refer to the latest update on respective stocks for the disclosure status in respect of those stocks. Angel Broking Limited and
its affiliates may have investment positions in the stocks recommended in this report.
Disclosure of Interest Statement Corporation Bank
1. Analyst ownership of the stock No
2. Angel and its Group companies ownership of the stock Yes
3. Angel and its Group companies' Directors ownership of the stock No
4. Broking relationship with company covered No
Note: We have not considered any Exposure below `1 lakh for Angel, its Group companies and Directors.
Ratings (Returns): Buy (> 15%) Accumulate (5% to 15%) Neutral (-5 to 5%)
Reduce (-5% to 15%) Sell (< -15%)