SlideShare una empresa de Scribd logo
1 de 92
The following table lists the components required to 
assembly an end item and quantities on hand. 
Item End B C D E F G H 
Amou 
0 10 10 25 12 30 5 0 
nt on 
hand 
B (2) C D (3) 
E (2) F (3) G (2) E (2) 
H (4) E (2) 
End Item 
If 20 Units of the end items are to be assembled, how many 
additional units of E are required.
B: 20 x 2 = 40 – 10 
= 30 
C: 20 x 1 = 20 – 10 
= 10 
D: 20 x 3 = 60 – 
25 = 35 
E: 30 x 2 = 60 – 12 
= 48 
E: 10 x 2 = 20 E: 35 x 2 = 70 
Total: 48 + 20 + 70 = 138
Inventory Management
Inventory Management 
• Inventories are important to all types of 
organizations 
– They have to be counted, paid for, used in 
operations, used to satisfy customers, and 
managed 
– Too much inventory reduces profitability 
– Too little inventory damages customer 
confidence 
– Inventory trade-offs
Functions of Inventory 
Inventories are resources maintained in various 
forms: 
- Raw Materials 
- Purchased and Manufactured parts 
- Sub assemblies 
- Finished Products 
Important: Since Inventories represent a sizable investment 
in a logistic system, we must be aware of the functions they 
perform
Important categories of Stocks 
Inventory 
To satisfy the 
expected customer 
demand 
(Anticipation 
Inventory) 
To protect 
against price 
increases and 
to take 
advantage of 
Quantity 
Discounts 
To avoid 
stock outs 
(Safety Stock 
or Buffer 
Stock) 
To provide buffer 
between successive 
operations 
(Decoupling 
Inventory or Work-in-process 
Inventory) 
To satisfy periods of 
seasonal high 
demand (Seasonal 
Inventory) 
To minimize 
the total cost 
by ordering 
the Economic 
Order 
Quantity 
(Cycle Stock) 
To act as a buffer 
between various 
elements of the Supply- 
Chain (Suppliers- 
Producers-Distributors- 
Wholesalers-Retailers- 
Customers) (Pipeline or 
Transit Stock)
Inventory Related Costs 
Procurement Costs 
Cost of Goods 
Ordering Cost 
Cost / Order generally fixed 
Not dependant on order quantity 
- Administrative cost 
- Handling 
- Transportation 
- Inspection of arrivals
Inventory Holding Costs 
Costs associated with existence of Inventories 
(Supply exceeds demand) 
Cost/unit/unit time 
iC 
(i = inventory carrying cost rate) 
- Storage and handing 
- Interest or tied up capital 
- Property taxes 
- Insurance 
- Spoilage 
- Obsolescence 
- pilferage
Shortage Costs 
Costs associated with stockouts 
(Demand exceeds Supply) 
(Cost/unit) (Cost/unit /unit time) 
- Loss of customer goodwill 
- Loss of sales
Types of Inventory Management Systems 
Inventory Management 
Systems 
Independent Demand Inventory 
Management Systems 
Dependent Demand 
Inventory Management 
Systems 
Material 
Requirements 
Planning (MRP) 
Systems 
Just-In-Time 
(JIT) 
Systems 
Hybrid MRP-JIT 
Systems 
For Retailers For Manufacturers 
ABC 
Classification 
of Items 
EOQ Model for 
Manufacturers 
Category 
A Items 
Category 
B Items 
Category 
C Items 
Periodic 
Review 
System 
Basic Economic 
Order Quantity 
(EOQ) Model 
EOQ Model 
with Quantity 
Discounts 
EOQ Model with 
Differential 
Discounting 
EOQ Model 
with Safety 
Stock 
EOQ Model 
with Intentional 
Shortages
ABC Analysis 
• Stock-keeping units (SKU) 
• Identify the classes so management 
can control inventory levels 
• A Pareto chart
ABC Analysis 
10 20 30 40 50 60 70 80 90 100 
Percentage of SKUs 
100 — 
Percentage of dollar value 
90 — 
80 — 
70 — 
60 — 
50 — 
40 — 
30 — 
20 — 
10 — 
0 — 
Class C 
Class A 
Class B
ABC Analysis 
• Class A 
– 5 – 15 % of units (approx.) 
– 70 – 80 % of value (approx.) 
• Class B 
– 30 % of units (approx.) 
– 15 % of value (approx.) 
• Class C 
– 50 – 60 % of units (approx.) 
– 5 – 10 % of value (approx.)
Solved Problem 1 
Booker’s Book Bindery divides SKUs into three classes, 
according to their dollar usage. Calculate the usage 
values of the following SKUs and determine which is 
most likely to be classified as class A. 
SKU Number Description 
Quantity Used 
per Year 
Unit Value 
($) 
1 Boxes 500 3.00 
2 Cardboard 
(square feet) 
18,000 0.02 
3 Cover stock 10,000 0.75 
4 Glue (gallons) 75 40.00 
5 Inside covers 20,000 0.05 
6 Reinforcing tape 
(meters) 
3,000 0.15 
7 Signatures 150,000 0.45
Solved Problem 1 
SOLUTION 
The annual dollar usage for each item is determined by multiplying the 
annual usage quantity by the value per unit. As shown in Figure 12.11, 
the SKUs are then sorted by annual dollar usage, in declining order. 
Finally, A–B and B–C class lines are drawn roughly, according to the 
guidelines presented in the text. Here, class A includes only one SKU 
(signatures), which represents only 1/7, or 14 percent, of the SKUs but 
accounts for 83 percent of annual dollar usage. Class B includes the 
next two SKUs, which taken together represent 28 percent of the SKUs 
and account for 13 percent of annual dollar usage. The final four SKUs, 
class C, represent over half the number of SKUs but only 4 percent of 
total annual dollar usage.
Solved Problem 1 
SKU 
Number 
Description 
Quantity 
Used per 
Year 
Unit Value 
($) 
Annual Dollar 
Usage ($) 
1 Boxes 500  3.00 = 1,500 
2 Cardboard 
(square feet) 
18,000  0.02 = 360 
3 Cover stock 10,000  0.75 = 7,500 
4 Glue (gallons) 75  40.00 = 3,000 
5 Inside covers 20,000  0.05 = 1,000 
6 Reinforcing tape 
(meters) 
3,000  0.15 = 450 
7 Signatures 150,000  0.45 = 67,500 
Total 81,310
Solved Problem 1
Class C 
Class B 
Percentage of SKUs 
Percentage of Dollar Value 
100 – 
90 – 
80 – 
70 – 
60 – 
50 – 
40 – 
30 – 
20 – 
10 – 
Class 
0 – 
A 
10 20 30 40 50 60 70 80 90 100
Unsolved Problem 1 
Lockwood Ind. Is considering the use of ABC analysis to focus on the most 
critical SKUs in its inventory. For a random sample of 8 SKUs, following table 
shows the annual dollar usage. Rank the SKUs and assign them to A,B or C 
class 
SKU Dollar Value ($) Annual Usage 
1 .01 1200 
2 .03 120,000 
3 .45 100 
4 1.00 44,000 
5 4.50 900 
6 .90 350 
7 .30 70,000 
8 1.50 200
Cumulative 
% 
Cumulative 
% 
SKU 
# 
Descripti 
on 
Qty 
Used/Year 
Value Dollar 
Usage 
Pct of 
Total 
of Dollar 
Value 
of SKUs Class 
4 44,000 $1.00 $44,000 60.0% 60.0% 12.5% A 
7 70,000 $0.30 $21,000 28.6% 88.7% 25.0% A 
5 900 $4.50 $4,050 5.5% 94.2% 37.5% B 
2 120,000 $0.03 $3,600 4.9% 99.1% 50.0% B 
6 350 $0.90 $315 0.4% 99.5% 62.5% C 
8 200 $1.50 $300 0.4% 99.9% 75.0% C 
3 100 $0.45 $45 0.1% 100.0% 87.5% C 
1 1,200 $0.01 $12 0.0% 100.0% 100.0% C 
Total $73,322
SKUs
OBJECTIVE OF ABC ANALYSIS: 
Rationalization of Ordering Policies 
EQUAL TREATMENT TO ALL 
Item no. Annual Consumption 
Value (Rs.) 
Number of 
Orders 
Value per order Average inventory 
1 
2 
3 
60,000 
4,000 
1,000 
4 
4 
4 
15,000 
1,000 
250 
7500 
500 
125 
Total Inventory: Rs. 8125 
PREFERENTIAL TREATMENT on basis of ABC analysis 
1 
2 
3 
60,000 
4,000 
1,000 
8 
3 
1 
7,500 
1,333 
1,000 
3750 
667 
500 
Total Inventory 
Rs 4917 
The optimum no of orders can be arrived at by using models of inventory 
control eg. EOQ 
time 
inventory 
Annual cost 
Q* 
Total cost 
carriage 
ordering
Economic Order Quantity 
The lot size, Q, that minimizes total annual inventory 
holding and ordering costs 
 Five assumptions 
1. Demand rate is constant and known with certainty 
2. No constraints are placed on the size of each lot 
3. The only two relevant costs are the inventory holding 
cost and the fixed cost per lot for ordering or setup 
4. Decisions for one item can be made independently of 
decisions for other items 
5. The lead time is constant and known with certainty
Calculating EOQ 
Inventory 
depletion (demand 
rate) 
Receiv 
e order 
1 cycle 
On-hand inventory 
(units) 
Time 
Q 
Average 
cycle 
inventory 
Q 
2
Calculating EOQ 
• Annual holding cost 
Annual holding cost = (Average cycle inventory) 
 (Unit holding cost) 
 Annual ordering cost 
Annual ordering cost = (Number of orders/Year) 
 (Ordering costs) 
 Total annual cycle-inventory cost 
Total costs = Annual holding cost 
+ Annual ordering cost
Annual cost (dollars) 
Calculating EOQ 
Lot Size (Q) 
Holding cost 
Ordering cost 
Total cost 
Graphs of Annual Holding, Ordering, and Total Costs
Calculating EOQ 
 Total annual cycle-inventory and ordering cost 
where 
Q 
2 
D 
Q 
C = (H) + (S) 
C = total annual cycle-inventory cost 
Q = lot size 
H = holding cost per unit per year 
D = annual demand 
S = ordering or setup costs per lot
The Cost of a Lot-Sizing Policy 
EXAMPLE 12.1 
• A museum of natural history opened a gift shop which operates 
52 weeks per year. 
• Managing inventories has become a problem. 
• Top-selling SKU is a bird feeder. 
• Sales are 18 units per week, the supplier charges $60 per unit. 
• Ordering cost is $45. 
• Annual holding cost is 25 percent of a feeder’s value. 
• Management chose a 390-unit lot size. 
• What is the annual cycle-inventory cost of the current policy of 
using a 390-unit lot size? 
• Would a lot size of 468 be better?
The Cost of a Lot-Sizing Policy 
SOLUTION 
We begin by computing the annual demand and holding cost as 
D = 
H = 
(18 units/week)(52 weeks/year) = 936 units 
0.25($60/unit) = $15 
The total annual cycle-inventory cost for the current policy is 
Q 
2 
D 
Q 
C = (H) + (S) 
390 
2 
936 
390 
= ($15) + ($45) 
= $2,925 + $108 = $3,033 
The total annual cycle-inventory cost for the alternative lot 
size is 
468 
2 
936 
468 
C = ($15) + ($45) = $3,510 + $90 = $3,600
The Cost of a Lot-Sizing Policy 
3000 – 
2000 – 
1000 – 
Total 
cost = (H) + (S) 
Q 
2 
Holding cost = (H) 
0 – | | | | | | | | 
50 100 150 200 250 300 350 400 
Lot Size (Q) 
Annual cost (dollars) 
Current 
Q 
Current 
cost 
Lowest 
cost 
Best Q 
(EOQ) 
Q 
2 
D 
Q 
D 
Q 
Ordering cost = (S)
Calculating EOQ 
• The EOQ formula: 
EOQ = 
2DS 
H 
 Time between orders 
EOQ 
D 
TBOEOQ = (12 months/year)
Finding the EOQ, Total Cost, TBO 
EXAMPLE 12.2 
For the bird feeders in Example 12.1, calculate the EOQ and its total 
annual cycle-inventory cost. How frequently will orders be placed if 
the EOQ is used? 
SOLUTION 
Using the formulas for EOQ and annual cost, we get 
2DS 
H 
EOQ = = 
= 74.94 or 75 units 
2(936)(45) 
15
Finding the EOQ, Total Cost, TBO 
Figure shows that the total annual cost is much less than the $3,033 cost 
of the current policy of placing 390-unit orders.
Finding the EOQ, Total Cost, TBO 
When the EOQ is used, the TBO can be expressed in various 
ways for the same time period. 
TBOEOQ = 
EOQ 
D 
EOQ 
D 
75 
936 
= = 0.080 year 
TBOEOQ = (12 months/year) 
EOQ 
D 
TBOEOQ = (52 weeks/year) 
EOQ 
D 
TBOEOQ = (365 days/year) 
75 
936 
= (12) = 0.96 month 
75 
936 
= (52) = 4.17 weeks 
75 
936 
= (365) = 29.25 days
Application 12.1 
Suppose that you are reviewing the inventory policies on an $80 
item stocked at a hardware store. The current policy is to replenish 
inventory by ordering in lots of 360 units. Additional information is: 
D = 60 units per week, or 3,120 units per year 
S = $30 per order 
H = 25% of selling price, or $20 per unit per year 
What is the EOQ? 
2DS 
H 
EOQ = = 
= 97 units 
2(3,120)(30) 
20 
SOLUTION
Application 12.1 
What is the total annual cost of the current policy (Q = 360), and 
how does it compare with the cost with using the EOQ? 
Current Policy EOQ Policy 
Q = 360 units Q = 97 units 
C = (360/2)(20) + (3,120/360)(30) 
C = 3,600 + 260 
C = $3,860 
C = (97/2)(20) + (3,120/97)(30) 
C = 970 + 965 
C = $1,935
Application 12.1 
What is the time between orders (TBO) for the current policy and 
the EOQ policy, expressed in weeks? 
TBO360 = 
TBOEOQ = 
(52 weeks per year) = 6 weeks 
360 
3,120 
(52 weeks per year) = 1.6 weeks 
97 
3,120 
SOLUTION
Problem 2 
Nelson’s Hardware Store stocks a 19.2 volt cordless drill that is a popular 
seller. Annual demand is 5,000 units, the ordering cost is $15, and the 
inventory holding cost is $4/unit/year. 
a. What is the economic order quantity? 
b. What is the total annual cost for this inventory item?
Solved Problem 2 
SOLUTION 
a. The order quantity is 
2DS 
H 
EOQ = = 
2(5,000)($15) 
$4 
= 37,500 = 193.65 or 194 drills 
b. The total annual cost is 
Q 
2 
D 
Q 
C = (H) + (S) = 
($4) + ($15) = $774.60 
194 
2 
5,000 
194
Inventory Control Systems 
 Nature of demand 
 Independent demand 
 Dependent demand
Inventory Control Systems 
• Continuous review (Q) system 
– Reorder point system (ROP) and fixed 
order quantity system 
– For independent demand items 
– Tracks inventory position (IP) 
– Includes scheduled receipts (SR), on-hand 
inventory (OH), and back orders (BO) 
Inventory position = On-hand inventory + Scheduled receipts 
– Backorders 
IP = OH + SR – BO
Selecting the Reorder Point 
Time 
On-hand inventory 
Order 
received 
L L 
Order 
received 
TBO TBO 
Order 
received 
TBO 
L 
Order 
placed 
Order 
placed 
Order 
placed 
IP IP IP 
R 
Q Q Q 
OH OH OH 
Order 
received 
Q System When Demand and Lead Time Are Constant 
and Certain
Application 
The on-hand inventory is only 10 units, and the reorder point R is 100. 
There are no backorders and one open order for 200 units. Should a new 
order be placed? 
IP = OH + SR – BO = 10 + 200 – 0 = 210 
R = 100 
SOLUTION 
Decision: Place no new order
Placing a New Order 
EXAMPLE Demand for chicken soup at a supermarket is always 25 
cases a day and the lead time is always 4 days. The shelves were 
just restocked with chicken soup, leaving an on-hand inventory of 
only 10 cases. No backorders currently exist, but there is one open 
order in the pipeline for 200 cases. What is the inventory position? 
Should a new order be placed? 
SOLUTION 
R = Total demand during lead time = (25)(4) = 100 cases 
IP = OH + SR – BO 
= 10 + 200 – 0 = 210 cases
Continuous Review Systems 
Selecting the reorder point with variable demand and 
constant lead time 
Reorder point = Average demand during lead time 
+ Safety stock 
= dL + safety stock 
where 
d = average demand per week (or day or months) 
L = constant lead time in weeks (or days or months)
Reorder Point 
1. Choose an appropriate service-level policy 
– Select service level or cycle service level 
– Protection interval 
2. Determine the demand during lead time 
probability distribution 
3. Determine the safety stock and reorder 
point levels
Demand During Lead Time 
• Specify mean and standard deviation 
• Standard deviation of demand during lead time 
σdLT = σd 
2L = σd L 
Safety stock and reorder point 
Safety stock = zσdLT 
where 
z = number of standard deviations needed to achieve the 
cycle-service level 
σdLT = stand deviation of demand during lead time 
Reorder point = R = dL + safety stock
Demand During Lead Time 
Average 
demand 
during 
lead time 
Cycle-service level = 85% 
Probability of stockout 
(1.0 – 0.85 = 0.15) 
zσdLT 
R 
Finding Safety Stock with a Normal Probability Distribution for an 85 Percent Cycle- 
Service Level
Reorder Point for Variable Demand 
EXAMPLE 
Let us return to the bird feeder in Example. 
The EOQ is 75 units. Suppose that the 
average demand is 18 units per week with 
a standard deviation of 5 units. The lead 
time is constant at two weeks. Determine 
the safety stock and reorder point if 
management wants a 90 percent cycle-service 
level.
Reorder Point for Variable Demand 
SOLUTION 
In this case, σd = 5, d = 18 units, and L = 2 weeks, so 
σdLT = σd L = 5 2 = 7.07. Consult the body of the table in the 
Normal Distribution appendix for 0.9000, which corresponds to 
a 90 percent cycle-service level. The closest number is 0.8997, 
which corresponds to 1.2 in the row heading and 0.08 in the 
column heading. Adding these values gives a z value of 1.28. 
With this information, we calculate the safety stock and reorder 
point as follows: 
Safety stock = zσdLT = 1.28(7.07) = 9.05 or 9 units 
Reorder point = dL + Safety stock = 2(18) + 9 = 45 units
Application 12.3 
Suppose that the demand during lead time is normally distributed 
with an average of 85 and σ= 40. Find the safety stock, and 
dLT reorder point R, for a 95 percent cycle-service level. 
SOLUTION 
Safety stock = zσ= 
1.645(40) = 65.8 or 66 units 
dLT R = Average demand during lead time + Safety stock 
R = 85 + 66 = 151 units 
Find the safety stock, and reorder point R, for an 85 percent 
cycle-service level. 
Safety stock = zσdLT = 1.04(40) = 41.6 or 42 units 
R = Average demand during lead time + Safety stock 
R = 85 + 42 = 127 units
Reorder Point for Variable Demand 
and Lead Time 
• Often the case that both are variable 
• The equations are more complicated 
Safety stock = zσdLT 
R = (Average weekly demand  Average lead time) 
where 
+ Safety stock 
= dL + Safety stock 
d = Average weekly (or daily or monthly) demand 
L = Average lead time 
σ= Standard deviation of weekly (or daily or monthly) demand 
d σ= Standard deviation of the lead time 
LT σ= Lσ2 + d2σ2 
dLT d 
LT
Reorder Point 
EXAMPLE 12.5 
The Office Supply Shop estimates that the average demand for a 
popular ball-point pen is 12,000 pens per week with a standard 
deviation of 3,000 pens. The current inventory policy calls for 
replenishment orders of 156,000 pens. The average lead time from 
the distributor is 5 weeks, with a standard deviation of 2 weeks. If 
management wants a 95 percent cycle-service level, what should 
the reorder point be?
Reorder Point 
SOLUTION 
We have d = 12,000 pens, σd = 3,000 pens, L = 5 weeks, 
and σLT = 2 weeks 
σdLT = Lσd 
2 + d2σLT 
2 = 
(5)(3,000)2 + (12,000)2(2)2 
= 24,919.87 pens 
From the Normal Distribution appendix for 0.9500, the 
appropriate z value = 1.65. We calculate the safety stock and 
reorder point as follows: 
Safety stock = zσdLT = 
(1.65)(24,919.87) 
= 41,117.79 or 41,118 pens 
Reorder point = dL + Safety stock = 
(12,000)(5) + 41.118 
= 101,118 pens
Application 12.4 
Grey Wolf lodge is a popular 500-room hotel in the North 
Woods. Managers need to keep close tabs on all of the 
room service items, including a special pint-scented bar 
soap. The daily demand for the soap is 275 bars, with a 
standard deviation of 30 bars. Ordering cost is $10 and 
the inventory holding cost is $0.30/bar/year. The lead 
time from the supplier is 5 days, with a standard 
deviation of 1 day. The lodge is open 365 days a year. 
What should the reorder point be for the bar of soap if 
management wants to have a 99 percent cycle-service?
Application 12.4 
SOLUTION 
d = 275 bars 
L = 5 days 
σ= 30 bars 
d σ= 1 day 
LT σ = Lσ2 + d2σ2 = 
283.06 bars dLT d 
LT 
From the Normal Distribution appendix for 0.9900, z = 2.33. 
We calculate the safety stock and reorder point as follows; 
Safety stock = zσdLT = 
Reorder point + safety stock = dL + safety stock 
(2.33)(283.06) = 659.53 or 660 bars 
= (275)(5) + 660 = 2,035 bars
Continuous Review Systems 
• Two-Bin system 
– Visual system 
– An empty first bin signals the need to place an order 
Calculating total systems costs 
Total cost = Annual cycle inventory holding cost 
+ Annual ordering cost 
+ Annual safety stock holding cost 
Q 
2 
D 
Q 
C = (H) + (S) + (H) (Safety stock)
Application 12.5 
The Discount Appliance Store uses a continuous review system 
(Q system). One of the company’s items has the following 
characteristics: 
Demand = 10 units/wk (assume 52 weeks per 
year) 
Ordering and setup cost (S) = $45/order 
Holding cost (H) = $12/unit/year 
Lead time (L) = 3 weeks (constant) 
Standard deviation in weekly demand = 8 units 
Cycle-service level = 70%
Application 12.5 
SOLUTION 
What is the EOQ for this item? 
D = 10/wk  52 wks/yr = 520 units 
2DS 
H 
EOQ = = 
= 62 units 
2(520)(45) 
12 
What is the desired safety stock? 
σdLT = σd L = 8 3 = 14 units 
Safety stock = zσdLT = 0.525(14) = 8 units
Application 12.5 
What is the desired reorder point R? 
R = Average demand during lead time + Safety stock 
R = 
3(10) + 8 = 38 units 
What is the total annual cost? 
520 
62 C = 
($12) + ($45) + 8($12) = $845.42 
62 
2
Application 12.5 
Suppose that the current policy is Q = 80 and R = 150. What will be the 
changes in average cycle inventory and safety stock if your EOQ and R 
values are implemented? 
Reducing Q from 80 to 62 
Cycle inventory reduction = 40 – 31 = 9 units 
Safety stock reduction = 120 – 8 = 112 units 
Reducing R from 150 to 38
Periodic Review System (P) 
Order placed for variable amount after fixed passage 
of time 
 Four of the original EOQ assumptions 
maintained 
 No constraints are placed on lot size 
 Holding and ordering costs only 
 Independent demand 
 Lead times are certain 
 Order is placed to bring the inventory position 
up to the target inventory level, T, when the 
predetermined time, P, has elapsed
How Much to Order in a P System 
EXAMPLE 12.6 
A distribution center has a backorder for five 36-inch color TV sets. 
No inventory is currently on hand, and now is the time to review. 
How many should be reordered if T = 400 and no receipts are 
scheduled? 
SOLUTION 
IP = OH + SR – BO 
= 0 + 0 – 5 = –5 sets 
T – IP = 400 – (–5) = 405 sets 
That is, 405 sets must be ordered to bring the inventory 
position up to T sets.
Application 12.6 
The on-hand inventory is 10 units, and T is 400. There are no back orders, 
but one scheduled receipt of 200 units. Now is the time to review. How 
much should be reordered? 
SOLUTION 
IP = OH + SR – BO 
= 10 + 200 – 0 = 210 
T – IP = 400 – 210 = 190 
The decision is to order 190 units
Periodic Review System 
Selecting the time between reviews, choosing P 
and T 
 Selecting T when demand is variable and 
lead time is constant 
 IP covers demand over a protection interval of 
P + L 
 The average demand during the protection 
interval is d(P + L), or 
T = d(P + L) + safety stock for protection interval 
Safety stock = zσP + L , where σP + L = P L d  
Calculating P and T 
EXAMPLE 12.7 
Again, let us return to the bird feeder example. Recall 
that demand for the bird feeder is normally distributed 
with a mean of 18 units per week and a standard 
deviation in weekly demand of 5 units. The lead time is 2 
weeks, and the business operates 52 weeks per year. 
The Q system developed in Example 12.4 called for an 
EOQ of 75 units and a safety stock of 9 units for a cycle-service 
level of 90 percent. What is the equivalent P 
system?
Calculating P and T 
SOLUTION 
We first define D and then P. Here, P is the time between reviews, 
expressed in weeks because the data are expressed as demand per 
week: 
D =(18 units/week)(52 weeks/year) = 936 units 
EOQ 
D 
P = (52) = 
(52) = 4.2 or 4 weeks 
75 
936 
With d = 18 units per week, an alternative approach is to 
calculate P by dividing the EOQ by d to get 75/18 = 4.2 or 4 
weeks. Either way, we would review the bird feeder 
inventory every 4 weeks.
Calculating P and T 
We now find the standard deviation of demand over the protection 
interval (P + L) = 6: 
   5 6 12.25 units  P L P L d   
Before calculating T, we also need a z value. For a 90 
percent cycle-service level z = 1.28. The safety stock 
becomes 
Safety stock = zσP + L 1=. 28(12.25) = 15.68 or 16 units 
We now solve for T: 
T = Average demand during the protection interval + Safety stock 
= d(P + L) + safety stock 
= (18 units/week)(6 weeks) + 16 units = 124 units
Comparative Advantages 
• Primary advantages of P systems 
– Convenient 
– Only need to know IP when review is made 
 Primary advantages of Q systems 
 Review frequency may be individualized 
 Fixed lot sizes can result in quantity 
discounts 
 Lower safety stocks
Unsolved Problems
Unsolved # Qn 3 
Yellow pages Inc. buys paper in 1500 pound 
rolls for printing. Annual demand is 2500 
rolls. The cost per roll is $8,00 and the 
annual holding cost is 15% of the cost. Each 
order costs $50. 
A) How many rolls should Yellow press order 
at a time 
B) What is the time between orders
Unsolved # Qn 7 
Sam’s CAT hotel operates 52 weeks per year, 6 days per week, and uses a 
continuous review inventory system. It purchases kitty litters for $ 11.70 
per bag. The following information is available about these bags: 
- Demand = 90 bags / week; Order cost = $54 per order; Annual holding 
cost = 27 percent of cost; Desired cycle service level = 80%; Lead T= 3 
weeks (18 working days); SD of weekly demand = 15 bags; Current on 
hand inventory is 320 bags, with no open orders or backorders. 
A) What is the EOQ? what would be the average time between orders (in 
weeks) 
B) What should R be 
C) An inventory withdrawl of 10 bags was just made. Is it time to reorder 
D) The store currently uses a lot size of 500 bags (Q=500). What is the 
annual holding cost of this policy? Annual ordering cost? Without 
calculating the EOQ, how can you conclude from these 2 calculations that 
the current lot size is too large 
E) What should be the annual cost saved by shifting from the 500 bag lot 
size to the EOQ
Unsolved # Qn 8 
Consider again the Kitty litter ordering policy for Sam’s CAT hotel in previous 
problem. 
A) Suppose that the weekly demand forecast of 90 bags is incorrect and 
actual demand averages only 60 bags per week. How much higher will 
total costs be, owing to the distorted EOQ caused by this forecast error 
B) Suppose that actual demand is 60 bags but that ordering costs are 
cut to only $6 by using internet to automate order placing. However, the 
buyer does not tell anyone and the EOQ is not adjusted to reflect this 
reduction in S. How much higher will total costs be, compared to what 
they could be, if EOQ were adjusted
Unsolved # Qn 24 
The farmer’s wife is a country store specializing in knickknacks suitable for a 
farm house décor. One item experiencing a considerable buying frenzy is a 
miniature Holstein cow. Average weekly demand is 30 cows, with a SD of 5 
cows. The cost to place a replenishment order is $15 and the holding cost is 
$.75/ cow /year. The supplier however is in China. The LT for new orders is 8 
weeks, with a SD of 2 weeks. The farmer’s wife which is open only 50 weeks 
a year wants to develop a continuous review system for this item with a 
cycle service level of 90 percent. 
A. Specify the continuous review system for cows. Explain how it would 
work in practice 
B. What is the total annual cost for the system you develop
Solved Problem 2 
Nelson’s Hardware Store stocks a 19.2 volt cordless drill that is a popular 
seller. Annual demand is 5,000 units, the ordering cost is $15, and the 
inventory holding cost is $4/unit/year. 
a. What is the economic order quantity? 
b. What is the total annual cost for this inventory item? 
SOLUTION 
a. The order quantity is 
2DS 
H 
EOQ = = 
2(5,000)($15) 
$4 
= 37,500 = 193.65 or 194 drills 
b. The total annual cost is 
Q 
2 
D 
Q 
C = (H) + (S) = 
($4) + ($15) = $774.60 
194 
2 
5,000 
194
Solved Problem 3 
A regional distributor purchases discontinued appliances from 
various suppliers and then sells them on demand to retailers in the 
region. The distributor operates 5 days per week, 52 weeks per year. 
Only when it is open for business can orders be received. 
Management wants to reevaluate its current inventory policy, which 
calls for order quantities of 440 counter-top mixers. The following 
data are estimated for the mixer: 
Average daily demand (d) = 100 mixers 
Standard deviation of daily demand (σd) = 30 mixers 
Lead time (L) = 3 days 
Holding cost (H) = $9.40/unit/year 
Ordering cost (S) = $35/order 
Cycle-service level = 92 percent 
The distributor uses a continuous review (Q) system
Solved Problem 3 
a. What order quantity Q, and reorder point, R, should be used? 
b. What is the total annual cost of the system? 
c. If on-hand inventory is 40 units, one open order for 440 mixers is 
pending, and no backorders exist, should a new order be placed?
Solved Problem 3 
SOLUTION 
a. Annual demand is 
D = (5 days/week)(52 weeks/year)(100 mixers/day) 
= 26,000 mixers/year 
The order quantity is 
2DS 
H 
EOQ = = 
2(26,000)($35) 
$9.40 
= 193,167 = 440.02 or 440 mixers
Solved Problem 3 
The standard deviation of the demand during lead time distribution is 
σdLT = σd L = 30 3 = 51.96 
A 92 percent cycle-service level corresponds to z = 1.41 
Safety stock = zσdLT = 1.41(51.96 mixers) = 73.26 or 73 mixers 
Average demand during lead time = dL = 100(3) = 300 mixers 
Reorder point (R) = Average demand during lead time + Safety stock 
= 300 mixers + 73 mixers = 373 mixers 
With a continuous review system, Q = 440 and R = 373
Solved Problem 3 
b. The total annual cost for the Q systems is 
Q 
2 
D 
Q 
C = (H) + (S) + (H)(Safety stock) 
440 
2 
26,000 
440 
C = ($9.40) + ($35) + ($9.40)(73) = $4,822.38 
c. Inventory position = On-hand inventory + Scheduled receipts 
– Backorders 
IP = OH + SR – BO = 40 + 440 – 0 = 480 mixers 
Because IP (480) exceeds R (373), do not place a new order
Solved Problem 4 
Suppose that a periodic review (P) system is used at the distributor in 
Solved Problem 3, but otherwise the data are the same. 
a. Calculate the P (in workdays, rounded to the nearest day) 
that gives approximately the same number of orders per 
year as the EOQ. 
b. What is the target inventory level, T? Compare the P system 
to the Q system in Solved Problem 3. 
c. What is the total annual cost of the P system? 
d. It is time to review the item. On-hand inventory is 40 mixers; 
receipt of 440 mixers is scheduled, and no backorders exist. 
How much should be reordered?
Solved Problem 4 
SOLUTION 
a. The time between orders is 
EOQ 
D 
P = (260 days/year) = 
(260) = 4.4 or 4 days 
440 
26,000 
b. Figure 12.12 shows that T = 812 and safety stock 
= (1.41)(79.37) = 111.91 or about 112 mixers. The 
corresponding Q system for the counter-top mixer requires 
less safety stock.
Solved Problem 4 
c. The total annual cost of the P system is 
dP 
2 
D 
dP 
C = (H) + (S) + (H)(Safety stock) 
100(4) 
C = ($9.40) + ($35) + ($9.40)(1.41)(79.37) 
2 
26,000 
100(4) 
= $5,207.80 
d. Inventory position is the amount on hand plus scheduled 
receipts minus backorders, or 
IP = OH + SR – BO = 40 + 440 – 0 = 480 mixers 
The order quantity is the target inventory level minus the 
inventory position, or 
Q = T – IP = 
812 mixers – 480 mixers = 332 mixers 
An order for 332 mixers should be placed.
Solved Problem 5 
Grey Wolf Lodge is a popular 500-room hotel in the North Woods. 
Managers need to keep close tabs on all room service items, including a 
special pine-scented bar soap. The daily demand for the soap is 275 bars, 
with a standard deviation of 30 bars. Ordering cost is $10 and the 
inventory holding cost is $0.30/bar/year. The lead time from the supplier is 
5 days, with a standard deviation of 1 day. The lodge is open 365 days a 
year. 
a. What is the economic order quantity for the bar of soap? 
b. What should the reorder point be for the bar of soap if 
management wants to have a 99 percent cycle-service level? 
c. What is the total annual cost for the bar of soap, assuming a 
Q system will be used?
Solved Problem 5 
SOLUTION 
a. We have D = (275)(365) = 100,375 bars of soap; S = $10; and H = $0.30. 
The EOQ for the bar of soap is 
2DS 
H 
EOQ = = 
2(100,375)($10) 
$0.30 
= 6,691,666.7 = 2,586.83 or 2,587 bars
Solved Problem 5 
b. We have d = 275 bars/day, σd = 30 bars, L = 5 days, 
and σLT = 1 day. 
σdLT = Lσd 
2 + d2σLT 
2 = (5)(30)2 + (275)2(1)2 = 283.06 bars 
Consult the body of the Normal Distribution appendix for 
0.9900. The closest value is 0.9901, which corresponds to 
a z value of 2.33. We calculate the safety stock and reorder 
point as follows: 
Safety stock = zσdLT = (2.33)(283.06) = 659.53 or 660 bars 
Reorder point = dL + Safety stock = (275)(5) + 660 = 2,035 bars
Solved Problem 5 
c. The total annual cost for the Q system is 
Q 
2 
D 
Q 
C = (H) + (S) + (H)(Safety stock) 
2,587 
C = ($0.30) + ($10) + ($0.30)(660) = $974.05 
2 
100,375 
2,587
Solved Problem 6 
Zeke’s Hardware Store sells furnace filters. The cost to place an order to the 
distributor is $25 and the annual cost to hold a filter in stock is $2. The 
average demand per week for the filters is 32 units, and the store operates 
50 weeks per year. The weekly demand for filters has the probability 
distribution shown on the left below. 
The delivery lead time from the distributor is uncertain and has the 
probability distribution shown on the right below. 
Suppose Zeke wants to use a P system with P = 6 weeks and a cycle-service 
level of 90 percent. What is the appropriate value for T and the associated 
annual cost of the system?
Solved Problem 6 
Demand Probability 
24 0.15 
28 0.20 
32 0.30 
36 0.20 
40 0.15 
Lead Time (wks) Probability 
1 0.05 
2 0.25 
3 0.40 
4 0.25 
5 0.05
Solved Problem 6 
SOLUTION 
Figure 12.13 contains output from the Demand During the Protection 
Interval Simulator from OM Explorer.
Solved Problem 6 
Given the desired cycle-service level of 90 percent, the appropriate T 
value is 322 units. The simulation estimated the average demand 
during the protection interval to be 289 units, consequently the safety 
stock is 322 – 289 = 33 units. 
The annual cost of this P system is 
6(32) 
2 
50(32) 
6(32) 
C = ($2) + ($25) + (33)($2) 
= $192.00 + $208.33 + $66.00 = $466.33
Solved Problem 7 
Consider Zeke’s inventory in Solved Problem 6. Suppose that he 
wants to use a continuous review (Q) system for the filters, with an 
order quantity of 200 and a reorder point of 140. Initial inventory is 
170 units. If the stockout cost is $5 per unit, and all of the other 
data in Solved Problem 6 are the same, what is the expected cost 
per week of using the Q system? 
SOLUTION 
Figure 12.14 shows output from the Q System Simulator in 
OM Explorer. Only weeks 1 through 13 and weeks 41 
through 50 are shown in the figure. The average total cost 
per week is $305.62. Notice that no stockouts occurred in 
this simulation. These results are dependent on Zeke’s 
choices for the reorder point and lot size. It is possible that 
stockouts would occur if the simulation were run for more 
than 50 weeks.

Más contenido relacionado

La actualidad más candente

Reorder point
Reorder pointReorder point
Reorder pointDon Paul
 
Inventory management
Inventory managementInventory management
Inventory managementMayank Ghosh
 
Inventory management
Inventory managementInventory management
Inventory managementrajeev227
 
Material requirement planning (mrp1)
Material requirement planning (mrp1)Material requirement planning (mrp1)
Material requirement planning (mrp1)saleh asgari
 
Inventory Control Model
Inventory Control ModelInventory Control Model
Inventory Control Modelyashpal01
 
Ops management lecture 8 inventory management
Ops management lecture 8 inventory managementOps management lecture 8 inventory management
Ops management lecture 8 inventory managementjillmitchell8778
 
Warehouse Operations and Inventory Management
Warehouse Operations and Inventory Management Warehouse Operations and Inventory Management
Warehouse Operations and Inventory Management Thomas Tanel
 
Inventory management
Inventory managementInventory management
Inventory managementsaurabhsabiba
 
Supply Chain Management chap 12
Supply Chain Management chap 12Supply Chain Management chap 12
Supply Chain Management chap 12Umair Arain
 
Inventory management ppt @ bec doms
Inventory management ppt @ bec domsInventory management ppt @ bec doms
Inventory management ppt @ bec domsBabasab Patil
 
INVENTORY DECISION MAKING
INVENTORY DECISION MAKINGINVENTORY DECISION MAKING
INVENTORY DECISION MAKINGAshish Hande
 

La actualidad más candente (20)

Reorder point
Reorder pointReorder point
Reorder point
 
Ch14. inventory management
Ch14. inventory managementCh14. inventory management
Ch14. inventory management
 
Inventory management
Inventory managementInventory management
Inventory management
 
Lot Sizing Techniques
Lot Sizing TechniquesLot Sizing Techniques
Lot Sizing Techniques
 
Inventory management
Inventory managementInventory management
Inventory management
 
Material requirement planning (mrp1)
Material requirement planning (mrp1)Material requirement planning (mrp1)
Material requirement planning (mrp1)
 
Cycle inventory
Cycle inventoryCycle inventory
Cycle inventory
 
Reordering point
Reordering pointReordering point
Reordering point
 
Inventory Control Model
Inventory Control ModelInventory Control Model
Inventory Control Model
 
Ops management lecture 8 inventory management
Ops management lecture 8 inventory managementOps management lecture 8 inventory management
Ops management lecture 8 inventory management
 
Warehouse Operations and Inventory Management
Warehouse Operations and Inventory Management Warehouse Operations and Inventory Management
Warehouse Operations and Inventory Management
 
Inventory management
Inventory managementInventory management
Inventory management
 
Supply Chain Management chap 12
Supply Chain Management chap 12Supply Chain Management chap 12
Supply Chain Management chap 12
 
INVENTORY MODELS
INVENTORY MODELSINVENTORY MODELS
INVENTORY MODELS
 
Design of supply chain networks
Design of supply chain networksDesign of supply chain networks
Design of supply chain networks
 
Inventory management ppt @ bec doms
Inventory management ppt @ bec domsInventory management ppt @ bec doms
Inventory management ppt @ bec doms
 
Inventory models
Inventory modelsInventory models
Inventory models
 
INVENTORY DECISION MAKING
INVENTORY DECISION MAKINGINVENTORY DECISION MAKING
INVENTORY DECISION MAKING
 
Inventory
InventoryInventory
Inventory
 
Inventory Planning & Control
Inventory Planning & ControlInventory Planning & Control
Inventory Planning & Control
 

Similar a Inventory management

3. good inventory-management-edited-ppt
3. good  inventory-management-edited-ppt3. good  inventory-management-edited-ppt
3. good inventory-management-edited-pptshahidch44
 
Inventory management
Inventory managementInventory management
Inventory managementAdnan Khan
 
Topic 4 Inventory Management Model.pptx
Topic 4 Inventory Management Model.pptxTopic 4 Inventory Management Model.pptx
Topic 4 Inventory Management Model.pptxHassanHani5
 
Session 6
Session 6Session 6
Session 6thangv
 
Inventory management
Inventory managementInventory management
Inventory managementKaizer Dave
 
Inventory management
Inventory managementInventory management
Inventory managementHriday Bora
 
24867879 inventory-management-control-lecture-3
24867879 inventory-management-control-lecture-324867879 inventory-management-control-lecture-3
24867879 inventory-management-control-lecture-3Harshawardhan Thakare
 
Inventory management 091104161506 Phpapp02
Inventory management 091104161506 Phpapp02Inventory management 091104161506 Phpapp02
Inventory management 091104161506 Phpapp02jasonhian
 
Lession - 1(Inventory Management).pptx
Lession - 1(Inventory Management).pptxLession - 1(Inventory Management).pptx
Lession - 1(Inventory Management).pptxRajeevRanjan743854
 
Lecture 2_Inventory Management_EOQ_EPQ.pdf
Lecture 2_Inventory Management_EOQ_EPQ.pdfLecture 2_Inventory Management_EOQ_EPQ.pdf
Lecture 2_Inventory Management_EOQ_EPQ.pdfRaymondCabrera9
 
EOQ_EDITED (1).ppt
EOQ_EDITED (1).pptEOQ_EDITED (1).ppt
EOQ_EDITED (1).pptssuserc008c5
 
Warehouse and Logistics Sessions 3 - 4 (Day 2)
Warehouse and Logistics Sessions 3 - 4 (Day 2)Warehouse and Logistics Sessions 3 - 4 (Day 2)
Warehouse and Logistics Sessions 3 - 4 (Day 2)Abdullah AlGhamdi (CSCP)
 
Admissions in india for b.tech
Admissions in india for b.techAdmissions in india for b.tech
Admissions in india for b.techCss Founder
 
PPT_01_Inventory_Management_Introduction (2).ppt
PPT_01_Inventory_Management_Introduction (2).pptPPT_01_Inventory_Management_Introduction (2).ppt
PPT_01_Inventory_Management_Introduction (2).pptAnanthAuditor1
 
Managing Inventory In SC Lect#12 in.pptx
Managing Inventory In SC Lect#12 in.pptxManaging Inventory In SC Lect#12 in.pptx
Managing Inventory In SC Lect#12 in.pptxSahilAgrawal80
 

Similar a Inventory management (20)

3. good inventory-management-edited-ppt
3. good  inventory-management-edited-ppt3. good  inventory-management-edited-ppt
3. good inventory-management-edited-ppt
 
Inventory management
Inventory managementInventory management
Inventory management
 
Topic 4 Inventory Management Model.pptx
Topic 4 Inventory Management Model.pptxTopic 4 Inventory Management Model.pptx
Topic 4 Inventory Management Model.pptx
 
Chapter 6_OM
Chapter 6_OMChapter 6_OM
Chapter 6_OM
 
Session 6
Session 6Session 6
Session 6
 
Inventory management
Inventory managementInventory management
Inventory management
 
Inventory management
Inventory managementInventory management
Inventory management
 
24867879 inventory-management-control-lecture-3
24867879 inventory-management-control-lecture-324867879 inventory-management-control-lecture-3
24867879 inventory-management-control-lecture-3
 
Inventory management 091104161506 Phpapp02
Inventory management 091104161506 Phpapp02Inventory management 091104161506 Phpapp02
Inventory management 091104161506 Phpapp02
 
Eoq model
Eoq modelEoq model
Eoq model
 
Lession - 1(Inventory Management).pptx
Lession - 1(Inventory Management).pptxLession - 1(Inventory Management).pptx
Lession - 1(Inventory Management).pptx
 
Lecture 2_Inventory Management_EOQ_EPQ.pdf
Lecture 2_Inventory Management_EOQ_EPQ.pdfLecture 2_Inventory Management_EOQ_EPQ.pdf
Lecture 2_Inventory Management_EOQ_EPQ.pdf
 
ECONOMIC ORDER QTY
ECONOMIC ORDER QTYECONOMIC ORDER QTY
ECONOMIC ORDER QTY
 
EOQ_EDITED (1).ppt
EOQ_EDITED (1).pptEOQ_EDITED (1).ppt
EOQ_EDITED (1).ppt
 
Warehouse and Logistics Sessions 3 - 4 (Day 2)
Warehouse and Logistics Sessions 3 - 4 (Day 2)Warehouse and Logistics Sessions 3 - 4 (Day 2)
Warehouse and Logistics Sessions 3 - 4 (Day 2)
 
Goods16
Goods16Goods16
Goods16
 
Admissions in india for b.tech
Admissions in india for b.techAdmissions in india for b.tech
Admissions in india for b.tech
 
Inventory notes
Inventory notesInventory notes
Inventory notes
 
PPT_01_Inventory_Management_Introduction (2).ppt
PPT_01_Inventory_Management_Introduction (2).pptPPT_01_Inventory_Management_Introduction (2).ppt
PPT_01_Inventory_Management_Introduction (2).ppt
 
Managing Inventory In SC Lect#12 in.pptx
Managing Inventory In SC Lect#12 in.pptxManaging Inventory In SC Lect#12 in.pptx
Managing Inventory In SC Lect#12 in.pptx
 

Último

Tech Startup Growth Hacking 101 - Basics on Growth Marketing
Tech Startup Growth Hacking 101  - Basics on Growth MarketingTech Startup Growth Hacking 101  - Basics on Growth Marketing
Tech Startup Growth Hacking 101 - Basics on Growth MarketingShawn Pang
 
A DAY IN THE LIFE OF A SALESMAN / WOMAN
A DAY IN THE LIFE OF A  SALESMAN / WOMANA DAY IN THE LIFE OF A  SALESMAN / WOMAN
A DAY IN THE LIFE OF A SALESMAN / WOMANIlamathiKannappan
 
VIP Kolkata Call Girl Howrah 👉 8250192130 Available With Room
VIP Kolkata Call Girl Howrah 👉 8250192130  Available With RoomVIP Kolkata Call Girl Howrah 👉 8250192130  Available With Room
VIP Kolkata Call Girl Howrah 👉 8250192130 Available With Roomdivyansh0kumar0
 
BEST ✨ Call Girls In Indirapuram Ghaziabad ✔️ 9871031762 ✔️ Escorts Service...
BEST ✨ Call Girls In  Indirapuram Ghaziabad  ✔️ 9871031762 ✔️ Escorts Service...BEST ✨ Call Girls In  Indirapuram Ghaziabad  ✔️ 9871031762 ✔️ Escorts Service...
BEST ✨ Call Girls In Indirapuram Ghaziabad ✔️ 9871031762 ✔️ Escorts Service...noida100girls
 
Lucknow 💋 Escorts in Lucknow - 450+ Call Girl Cash Payment 8923113531 Neha Th...
Lucknow 💋 Escorts in Lucknow - 450+ Call Girl Cash Payment 8923113531 Neha Th...Lucknow 💋 Escorts in Lucknow - 450+ Call Girl Cash Payment 8923113531 Neha Th...
Lucknow 💋 Escorts in Lucknow - 450+ Call Girl Cash Payment 8923113531 Neha Th...anilsa9823
 
7.pdf This presentation captures many uses and the significance of the number...
7.pdf This presentation captures many uses and the significance of the number...7.pdf This presentation captures many uses and the significance of the number...
7.pdf This presentation captures many uses and the significance of the number...Paul Menig
 
RE Capital's Visionary Leadership under Newman Leech
RE Capital's Visionary Leadership under Newman LeechRE Capital's Visionary Leadership under Newman Leech
RE Capital's Visionary Leadership under Newman LeechNewman George Leech
 
Call Girls In DLf Gurgaon ➥99902@11544 ( Best price)100% Genuine Escort In 24...
Call Girls In DLf Gurgaon ➥99902@11544 ( Best price)100% Genuine Escort In 24...Call Girls In DLf Gurgaon ➥99902@11544 ( Best price)100% Genuine Escort In 24...
Call Girls In DLf Gurgaon ➥99902@11544 ( Best price)100% Genuine Escort In 24...lizamodels9
 
Mysore Call Girls 8617370543 WhatsApp Number 24x7 Best Services
Mysore Call Girls 8617370543 WhatsApp Number 24x7 Best ServicesMysore Call Girls 8617370543 WhatsApp Number 24x7 Best Services
Mysore Call Girls 8617370543 WhatsApp Number 24x7 Best ServicesDipal Arora
 
Socio-economic-Impact-of-business-consumers-suppliers-and.pptx
Socio-economic-Impact-of-business-consumers-suppliers-and.pptxSocio-economic-Impact-of-business-consumers-suppliers-and.pptx
Socio-economic-Impact-of-business-consumers-suppliers-and.pptxtrishalcan8
 
Vip Dewas Call Girls #9907093804 Contact Number Escorts Service Dewas
Vip Dewas Call Girls #9907093804 Contact Number Escorts Service DewasVip Dewas Call Girls #9907093804 Contact Number Escorts Service Dewas
Vip Dewas Call Girls #9907093804 Contact Number Escorts Service Dewasmakika9823
 
It will be International Nurses' Day on 12 May
It will be International Nurses' Day on 12 MayIt will be International Nurses' Day on 12 May
It will be International Nurses' Day on 12 MayNZSG
 
Catalogue ONG NUOC PPR DE NHAT .pdf
Catalogue ONG NUOC PPR DE NHAT      .pdfCatalogue ONG NUOC PPR DE NHAT      .pdf
Catalogue ONG NUOC PPR DE NHAT .pdfOrient Homes
 
Catalogue ONG NƯỚC uPVC - HDPE DE NHAT.pdf
Catalogue ONG NƯỚC uPVC - HDPE DE NHAT.pdfCatalogue ONG NƯỚC uPVC - HDPE DE NHAT.pdf
Catalogue ONG NƯỚC uPVC - HDPE DE NHAT.pdfOrient Homes
 
Ensure the security of your HCL environment by applying the Zero Trust princi...
Ensure the security of your HCL environment by applying the Zero Trust princi...Ensure the security of your HCL environment by applying the Zero Trust princi...
Ensure the security of your HCL environment by applying the Zero Trust princi...Roland Driesen
 
Best VIP Call Girls Noida Sector 40 Call Me: 8448380779
Best VIP Call Girls Noida Sector 40 Call Me: 8448380779Best VIP Call Girls Noida Sector 40 Call Me: 8448380779
Best VIP Call Girls Noida Sector 40 Call Me: 8448380779Delhi Call girls
 
Regression analysis: Simple Linear Regression Multiple Linear Regression
Regression analysis:  Simple Linear Regression Multiple Linear RegressionRegression analysis:  Simple Linear Regression Multiple Linear Regression
Regression analysis: Simple Linear Regression Multiple Linear RegressionRavindra Nath Shukla
 
Eni 2024 1Q Results - 24.04.24 business.
Eni 2024 1Q Results - 24.04.24 business.Eni 2024 1Q Results - 24.04.24 business.
Eni 2024 1Q Results - 24.04.24 business.Eni
 
VIP Call Girls In Saharaganj ( Lucknow ) 🔝 8923113531 🔝 Cash Payment (COD) 👒
VIP Call Girls In Saharaganj ( Lucknow  ) 🔝 8923113531 🔝  Cash Payment (COD) 👒VIP Call Girls In Saharaganj ( Lucknow  ) 🔝 8923113531 🔝  Cash Payment (COD) 👒
VIP Call Girls In Saharaganj ( Lucknow ) 🔝 8923113531 🔝 Cash Payment (COD) 👒anilsa9823
 
Call Girls in Gomti Nagar - 7388211116 - With room Service
Call Girls in Gomti Nagar - 7388211116  - With room ServiceCall Girls in Gomti Nagar - 7388211116  - With room Service
Call Girls in Gomti Nagar - 7388211116 - With room Servicediscovermytutordmt
 

Último (20)

Tech Startup Growth Hacking 101 - Basics on Growth Marketing
Tech Startup Growth Hacking 101  - Basics on Growth MarketingTech Startup Growth Hacking 101  - Basics on Growth Marketing
Tech Startup Growth Hacking 101 - Basics on Growth Marketing
 
A DAY IN THE LIFE OF A SALESMAN / WOMAN
A DAY IN THE LIFE OF A  SALESMAN / WOMANA DAY IN THE LIFE OF A  SALESMAN / WOMAN
A DAY IN THE LIFE OF A SALESMAN / WOMAN
 
VIP Kolkata Call Girl Howrah 👉 8250192130 Available With Room
VIP Kolkata Call Girl Howrah 👉 8250192130  Available With RoomVIP Kolkata Call Girl Howrah 👉 8250192130  Available With Room
VIP Kolkata Call Girl Howrah 👉 8250192130 Available With Room
 
BEST ✨ Call Girls In Indirapuram Ghaziabad ✔️ 9871031762 ✔️ Escorts Service...
BEST ✨ Call Girls In  Indirapuram Ghaziabad  ✔️ 9871031762 ✔️ Escorts Service...BEST ✨ Call Girls In  Indirapuram Ghaziabad  ✔️ 9871031762 ✔️ Escorts Service...
BEST ✨ Call Girls In Indirapuram Ghaziabad ✔️ 9871031762 ✔️ Escorts Service...
 
Lucknow 💋 Escorts in Lucknow - 450+ Call Girl Cash Payment 8923113531 Neha Th...
Lucknow 💋 Escorts in Lucknow - 450+ Call Girl Cash Payment 8923113531 Neha Th...Lucknow 💋 Escorts in Lucknow - 450+ Call Girl Cash Payment 8923113531 Neha Th...
Lucknow 💋 Escorts in Lucknow - 450+ Call Girl Cash Payment 8923113531 Neha Th...
 
7.pdf This presentation captures many uses and the significance of the number...
7.pdf This presentation captures many uses and the significance of the number...7.pdf This presentation captures many uses and the significance of the number...
7.pdf This presentation captures many uses and the significance of the number...
 
RE Capital's Visionary Leadership under Newman Leech
RE Capital's Visionary Leadership under Newman LeechRE Capital's Visionary Leadership under Newman Leech
RE Capital's Visionary Leadership under Newman Leech
 
Call Girls In DLf Gurgaon ➥99902@11544 ( Best price)100% Genuine Escort In 24...
Call Girls In DLf Gurgaon ➥99902@11544 ( Best price)100% Genuine Escort In 24...Call Girls In DLf Gurgaon ➥99902@11544 ( Best price)100% Genuine Escort In 24...
Call Girls In DLf Gurgaon ➥99902@11544 ( Best price)100% Genuine Escort In 24...
 
Mysore Call Girls 8617370543 WhatsApp Number 24x7 Best Services
Mysore Call Girls 8617370543 WhatsApp Number 24x7 Best ServicesMysore Call Girls 8617370543 WhatsApp Number 24x7 Best Services
Mysore Call Girls 8617370543 WhatsApp Number 24x7 Best Services
 
Socio-economic-Impact-of-business-consumers-suppliers-and.pptx
Socio-economic-Impact-of-business-consumers-suppliers-and.pptxSocio-economic-Impact-of-business-consumers-suppliers-and.pptx
Socio-economic-Impact-of-business-consumers-suppliers-and.pptx
 
Vip Dewas Call Girls #9907093804 Contact Number Escorts Service Dewas
Vip Dewas Call Girls #9907093804 Contact Number Escorts Service DewasVip Dewas Call Girls #9907093804 Contact Number Escorts Service Dewas
Vip Dewas Call Girls #9907093804 Contact Number Escorts Service Dewas
 
It will be International Nurses' Day on 12 May
It will be International Nurses' Day on 12 MayIt will be International Nurses' Day on 12 May
It will be International Nurses' Day on 12 May
 
Catalogue ONG NUOC PPR DE NHAT .pdf
Catalogue ONG NUOC PPR DE NHAT      .pdfCatalogue ONG NUOC PPR DE NHAT      .pdf
Catalogue ONG NUOC PPR DE NHAT .pdf
 
Catalogue ONG NƯỚC uPVC - HDPE DE NHAT.pdf
Catalogue ONG NƯỚC uPVC - HDPE DE NHAT.pdfCatalogue ONG NƯỚC uPVC - HDPE DE NHAT.pdf
Catalogue ONG NƯỚC uPVC - HDPE DE NHAT.pdf
 
Ensure the security of your HCL environment by applying the Zero Trust princi...
Ensure the security of your HCL environment by applying the Zero Trust princi...Ensure the security of your HCL environment by applying the Zero Trust princi...
Ensure the security of your HCL environment by applying the Zero Trust princi...
 
Best VIP Call Girls Noida Sector 40 Call Me: 8448380779
Best VIP Call Girls Noida Sector 40 Call Me: 8448380779Best VIP Call Girls Noida Sector 40 Call Me: 8448380779
Best VIP Call Girls Noida Sector 40 Call Me: 8448380779
 
Regression analysis: Simple Linear Regression Multiple Linear Regression
Regression analysis:  Simple Linear Regression Multiple Linear RegressionRegression analysis:  Simple Linear Regression Multiple Linear Regression
Regression analysis: Simple Linear Regression Multiple Linear Regression
 
Eni 2024 1Q Results - 24.04.24 business.
Eni 2024 1Q Results - 24.04.24 business.Eni 2024 1Q Results - 24.04.24 business.
Eni 2024 1Q Results - 24.04.24 business.
 
VIP Call Girls In Saharaganj ( Lucknow ) 🔝 8923113531 🔝 Cash Payment (COD) 👒
VIP Call Girls In Saharaganj ( Lucknow  ) 🔝 8923113531 🔝  Cash Payment (COD) 👒VIP Call Girls In Saharaganj ( Lucknow  ) 🔝 8923113531 🔝  Cash Payment (COD) 👒
VIP Call Girls In Saharaganj ( Lucknow ) 🔝 8923113531 🔝 Cash Payment (COD) 👒
 
Call Girls in Gomti Nagar - 7388211116 - With room Service
Call Girls in Gomti Nagar - 7388211116  - With room ServiceCall Girls in Gomti Nagar - 7388211116  - With room Service
Call Girls in Gomti Nagar - 7388211116 - With room Service
 

Inventory management

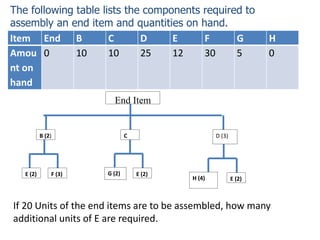
  • 1. The following table lists the components required to assembly an end item and quantities on hand. Item End B C D E F G H Amou 0 10 10 25 12 30 5 0 nt on hand B (2) C D (3) E (2) F (3) G (2) E (2) H (4) E (2) End Item If 20 Units of the end items are to be assembled, how many additional units of E are required.
  • 2. B: 20 x 2 = 40 – 10 = 30 C: 20 x 1 = 20 – 10 = 10 D: 20 x 3 = 60 – 25 = 35 E: 30 x 2 = 60 – 12 = 48 E: 10 x 2 = 20 E: 35 x 2 = 70 Total: 48 + 20 + 70 = 138
  • 4. Inventory Management • Inventories are important to all types of organizations – They have to be counted, paid for, used in operations, used to satisfy customers, and managed – Too much inventory reduces profitability – Too little inventory damages customer confidence – Inventory trade-offs
  • 5. Functions of Inventory Inventories are resources maintained in various forms: - Raw Materials - Purchased and Manufactured parts - Sub assemblies - Finished Products Important: Since Inventories represent a sizable investment in a logistic system, we must be aware of the functions they perform
  • 6. Important categories of Stocks Inventory To satisfy the expected customer demand (Anticipation Inventory) To protect against price increases and to take advantage of Quantity Discounts To avoid stock outs (Safety Stock or Buffer Stock) To provide buffer between successive operations (Decoupling Inventory or Work-in-process Inventory) To satisfy periods of seasonal high demand (Seasonal Inventory) To minimize the total cost by ordering the Economic Order Quantity (Cycle Stock) To act as a buffer between various elements of the Supply- Chain (Suppliers- Producers-Distributors- Wholesalers-Retailers- Customers) (Pipeline or Transit Stock)
  • 7. Inventory Related Costs Procurement Costs Cost of Goods Ordering Cost Cost / Order generally fixed Not dependant on order quantity - Administrative cost - Handling - Transportation - Inspection of arrivals
  • 8. Inventory Holding Costs Costs associated with existence of Inventories (Supply exceeds demand) Cost/unit/unit time iC (i = inventory carrying cost rate) - Storage and handing - Interest or tied up capital - Property taxes - Insurance - Spoilage - Obsolescence - pilferage
  • 9. Shortage Costs Costs associated with stockouts (Demand exceeds Supply) (Cost/unit) (Cost/unit /unit time) - Loss of customer goodwill - Loss of sales
  • 10. Types of Inventory Management Systems Inventory Management Systems Independent Demand Inventory Management Systems Dependent Demand Inventory Management Systems Material Requirements Planning (MRP) Systems Just-In-Time (JIT) Systems Hybrid MRP-JIT Systems For Retailers For Manufacturers ABC Classification of Items EOQ Model for Manufacturers Category A Items Category B Items Category C Items Periodic Review System Basic Economic Order Quantity (EOQ) Model EOQ Model with Quantity Discounts EOQ Model with Differential Discounting EOQ Model with Safety Stock EOQ Model with Intentional Shortages
  • 11. ABC Analysis • Stock-keeping units (SKU) • Identify the classes so management can control inventory levels • A Pareto chart
  • 12. ABC Analysis 10 20 30 40 50 60 70 80 90 100 Percentage of SKUs 100 — Percentage of dollar value 90 — 80 — 70 — 60 — 50 — 40 — 30 — 20 — 10 — 0 — Class C Class A Class B
  • 13. ABC Analysis • Class A – 5 – 15 % of units (approx.) – 70 – 80 % of value (approx.) • Class B – 30 % of units (approx.) – 15 % of value (approx.) • Class C – 50 – 60 % of units (approx.) – 5 – 10 % of value (approx.)
  • 14. Solved Problem 1 Booker’s Book Bindery divides SKUs into three classes, according to their dollar usage. Calculate the usage values of the following SKUs and determine which is most likely to be classified as class A. SKU Number Description Quantity Used per Year Unit Value ($) 1 Boxes 500 3.00 2 Cardboard (square feet) 18,000 0.02 3 Cover stock 10,000 0.75 4 Glue (gallons) 75 40.00 5 Inside covers 20,000 0.05 6 Reinforcing tape (meters) 3,000 0.15 7 Signatures 150,000 0.45
  • 15. Solved Problem 1 SOLUTION The annual dollar usage for each item is determined by multiplying the annual usage quantity by the value per unit. As shown in Figure 12.11, the SKUs are then sorted by annual dollar usage, in declining order. Finally, A–B and B–C class lines are drawn roughly, according to the guidelines presented in the text. Here, class A includes only one SKU (signatures), which represents only 1/7, or 14 percent, of the SKUs but accounts for 83 percent of annual dollar usage. Class B includes the next two SKUs, which taken together represent 28 percent of the SKUs and account for 13 percent of annual dollar usage. The final four SKUs, class C, represent over half the number of SKUs but only 4 percent of total annual dollar usage.
  • 16. Solved Problem 1 SKU Number Description Quantity Used per Year Unit Value ($) Annual Dollar Usage ($) 1 Boxes 500  3.00 = 1,500 2 Cardboard (square feet) 18,000  0.02 = 360 3 Cover stock 10,000  0.75 = 7,500 4 Glue (gallons) 75  40.00 = 3,000 5 Inside covers 20,000  0.05 = 1,000 6 Reinforcing tape (meters) 3,000  0.15 = 450 7 Signatures 150,000  0.45 = 67,500 Total 81,310
  • 18. Class C Class B Percentage of SKUs Percentage of Dollar Value 100 – 90 – 80 – 70 – 60 – 50 – 40 – 30 – 20 – 10 – Class 0 – A 10 20 30 40 50 60 70 80 90 100
  • 19. Unsolved Problem 1 Lockwood Ind. Is considering the use of ABC analysis to focus on the most critical SKUs in its inventory. For a random sample of 8 SKUs, following table shows the annual dollar usage. Rank the SKUs and assign them to A,B or C class SKU Dollar Value ($) Annual Usage 1 .01 1200 2 .03 120,000 3 .45 100 4 1.00 44,000 5 4.50 900 6 .90 350 7 .30 70,000 8 1.50 200
  • 20. Cumulative % Cumulative % SKU # Descripti on Qty Used/Year Value Dollar Usage Pct of Total of Dollar Value of SKUs Class 4 44,000 $1.00 $44,000 60.0% 60.0% 12.5% A 7 70,000 $0.30 $21,000 28.6% 88.7% 25.0% A 5 900 $4.50 $4,050 5.5% 94.2% 37.5% B 2 120,000 $0.03 $3,600 4.9% 99.1% 50.0% B 6 350 $0.90 $315 0.4% 99.5% 62.5% C 8 200 $1.50 $300 0.4% 99.9% 75.0% C 3 100 $0.45 $45 0.1% 100.0% 87.5% C 1 1,200 $0.01 $12 0.0% 100.0% 100.0% C Total $73,322
  • 21. SKUs
  • 22. OBJECTIVE OF ABC ANALYSIS: Rationalization of Ordering Policies EQUAL TREATMENT TO ALL Item no. Annual Consumption Value (Rs.) Number of Orders Value per order Average inventory 1 2 3 60,000 4,000 1,000 4 4 4 15,000 1,000 250 7500 500 125 Total Inventory: Rs. 8125 PREFERENTIAL TREATMENT on basis of ABC analysis 1 2 3 60,000 4,000 1,000 8 3 1 7,500 1,333 1,000 3750 667 500 Total Inventory Rs 4917 The optimum no of orders can be arrived at by using models of inventory control eg. EOQ time inventory Annual cost Q* Total cost carriage ordering
  • 23. Economic Order Quantity The lot size, Q, that minimizes total annual inventory holding and ordering costs  Five assumptions 1. Demand rate is constant and known with certainty 2. No constraints are placed on the size of each lot 3. The only two relevant costs are the inventory holding cost and the fixed cost per lot for ordering or setup 4. Decisions for one item can be made independently of decisions for other items 5. The lead time is constant and known with certainty
  • 24. Calculating EOQ Inventory depletion (demand rate) Receiv e order 1 cycle On-hand inventory (units) Time Q Average cycle inventory Q 2
  • 25. Calculating EOQ • Annual holding cost Annual holding cost = (Average cycle inventory)  (Unit holding cost)  Annual ordering cost Annual ordering cost = (Number of orders/Year)  (Ordering costs)  Total annual cycle-inventory cost Total costs = Annual holding cost + Annual ordering cost
  • 26. Annual cost (dollars) Calculating EOQ Lot Size (Q) Holding cost Ordering cost Total cost Graphs of Annual Holding, Ordering, and Total Costs
  • 27. Calculating EOQ  Total annual cycle-inventory and ordering cost where Q 2 D Q C = (H) + (S) C = total annual cycle-inventory cost Q = lot size H = holding cost per unit per year D = annual demand S = ordering or setup costs per lot
  • 28. The Cost of a Lot-Sizing Policy EXAMPLE 12.1 • A museum of natural history opened a gift shop which operates 52 weeks per year. • Managing inventories has become a problem. • Top-selling SKU is a bird feeder. • Sales are 18 units per week, the supplier charges $60 per unit. • Ordering cost is $45. • Annual holding cost is 25 percent of a feeder’s value. • Management chose a 390-unit lot size. • What is the annual cycle-inventory cost of the current policy of using a 390-unit lot size? • Would a lot size of 468 be better?
  • 29. The Cost of a Lot-Sizing Policy SOLUTION We begin by computing the annual demand and holding cost as D = H = (18 units/week)(52 weeks/year) = 936 units 0.25($60/unit) = $15 The total annual cycle-inventory cost for the current policy is Q 2 D Q C = (H) + (S) 390 2 936 390 = ($15) + ($45) = $2,925 + $108 = $3,033 The total annual cycle-inventory cost for the alternative lot size is 468 2 936 468 C = ($15) + ($45) = $3,510 + $90 = $3,600
  • 30. The Cost of a Lot-Sizing Policy 3000 – 2000 – 1000 – Total cost = (H) + (S) Q 2 Holding cost = (H) 0 – | | | | | | | | 50 100 150 200 250 300 350 400 Lot Size (Q) Annual cost (dollars) Current Q Current cost Lowest cost Best Q (EOQ) Q 2 D Q D Q Ordering cost = (S)
  • 31. Calculating EOQ • The EOQ formula: EOQ = 2DS H  Time between orders EOQ D TBOEOQ = (12 months/year)
  • 32. Finding the EOQ, Total Cost, TBO EXAMPLE 12.2 For the bird feeders in Example 12.1, calculate the EOQ and its total annual cycle-inventory cost. How frequently will orders be placed if the EOQ is used? SOLUTION Using the formulas for EOQ and annual cost, we get 2DS H EOQ = = = 74.94 or 75 units 2(936)(45) 15
  • 33. Finding the EOQ, Total Cost, TBO Figure shows that the total annual cost is much less than the $3,033 cost of the current policy of placing 390-unit orders.
  • 34. Finding the EOQ, Total Cost, TBO When the EOQ is used, the TBO can be expressed in various ways for the same time period. TBOEOQ = EOQ D EOQ D 75 936 = = 0.080 year TBOEOQ = (12 months/year) EOQ D TBOEOQ = (52 weeks/year) EOQ D TBOEOQ = (365 days/year) 75 936 = (12) = 0.96 month 75 936 = (52) = 4.17 weeks 75 936 = (365) = 29.25 days
  • 35. Application 12.1 Suppose that you are reviewing the inventory policies on an $80 item stocked at a hardware store. The current policy is to replenish inventory by ordering in lots of 360 units. Additional information is: D = 60 units per week, or 3,120 units per year S = $30 per order H = 25% of selling price, or $20 per unit per year What is the EOQ? 2DS H EOQ = = = 97 units 2(3,120)(30) 20 SOLUTION
  • 36. Application 12.1 What is the total annual cost of the current policy (Q = 360), and how does it compare with the cost with using the EOQ? Current Policy EOQ Policy Q = 360 units Q = 97 units C = (360/2)(20) + (3,120/360)(30) C = 3,600 + 260 C = $3,860 C = (97/2)(20) + (3,120/97)(30) C = 970 + 965 C = $1,935
  • 37. Application 12.1 What is the time between orders (TBO) for the current policy and the EOQ policy, expressed in weeks? TBO360 = TBOEOQ = (52 weeks per year) = 6 weeks 360 3,120 (52 weeks per year) = 1.6 weeks 97 3,120 SOLUTION
  • 38. Problem 2 Nelson’s Hardware Store stocks a 19.2 volt cordless drill that is a popular seller. Annual demand is 5,000 units, the ordering cost is $15, and the inventory holding cost is $4/unit/year. a. What is the economic order quantity? b. What is the total annual cost for this inventory item?
  • 39. Solved Problem 2 SOLUTION a. The order quantity is 2DS H EOQ = = 2(5,000)($15) $4 = 37,500 = 193.65 or 194 drills b. The total annual cost is Q 2 D Q C = (H) + (S) = ($4) + ($15) = $774.60 194 2 5,000 194
  • 40. Inventory Control Systems  Nature of demand  Independent demand  Dependent demand
  • 41. Inventory Control Systems • Continuous review (Q) system – Reorder point system (ROP) and fixed order quantity system – For independent demand items – Tracks inventory position (IP) – Includes scheduled receipts (SR), on-hand inventory (OH), and back orders (BO) Inventory position = On-hand inventory + Scheduled receipts – Backorders IP = OH + SR – BO
  • 42. Selecting the Reorder Point Time On-hand inventory Order received L L Order received TBO TBO Order received TBO L Order placed Order placed Order placed IP IP IP R Q Q Q OH OH OH Order received Q System When Demand and Lead Time Are Constant and Certain
  • 43. Application The on-hand inventory is only 10 units, and the reorder point R is 100. There are no backorders and one open order for 200 units. Should a new order be placed? IP = OH + SR – BO = 10 + 200 – 0 = 210 R = 100 SOLUTION Decision: Place no new order
  • 44. Placing a New Order EXAMPLE Demand for chicken soup at a supermarket is always 25 cases a day and the lead time is always 4 days. The shelves were just restocked with chicken soup, leaving an on-hand inventory of only 10 cases. No backorders currently exist, but there is one open order in the pipeline for 200 cases. What is the inventory position? Should a new order be placed? SOLUTION R = Total demand during lead time = (25)(4) = 100 cases IP = OH + SR – BO = 10 + 200 – 0 = 210 cases
  • 45. Continuous Review Systems Selecting the reorder point with variable demand and constant lead time Reorder point = Average demand during lead time + Safety stock = dL + safety stock where d = average demand per week (or day or months) L = constant lead time in weeks (or days or months)
  • 46. Reorder Point 1. Choose an appropriate service-level policy – Select service level or cycle service level – Protection interval 2. Determine the demand during lead time probability distribution 3. Determine the safety stock and reorder point levels
  • 47. Demand During Lead Time • Specify mean and standard deviation • Standard deviation of demand during lead time σdLT = σd 2L = σd L Safety stock and reorder point Safety stock = zσdLT where z = number of standard deviations needed to achieve the cycle-service level σdLT = stand deviation of demand during lead time Reorder point = R = dL + safety stock
  • 48. Demand During Lead Time Average demand during lead time Cycle-service level = 85% Probability of stockout (1.0 – 0.85 = 0.15) zσdLT R Finding Safety Stock with a Normal Probability Distribution for an 85 Percent Cycle- Service Level
  • 49. Reorder Point for Variable Demand EXAMPLE Let us return to the bird feeder in Example. The EOQ is 75 units. Suppose that the average demand is 18 units per week with a standard deviation of 5 units. The lead time is constant at two weeks. Determine the safety stock and reorder point if management wants a 90 percent cycle-service level.
  • 50. Reorder Point for Variable Demand SOLUTION In this case, σd = 5, d = 18 units, and L = 2 weeks, so σdLT = σd L = 5 2 = 7.07. Consult the body of the table in the Normal Distribution appendix for 0.9000, which corresponds to a 90 percent cycle-service level. The closest number is 0.8997, which corresponds to 1.2 in the row heading and 0.08 in the column heading. Adding these values gives a z value of 1.28. With this information, we calculate the safety stock and reorder point as follows: Safety stock = zσdLT = 1.28(7.07) = 9.05 or 9 units Reorder point = dL + Safety stock = 2(18) + 9 = 45 units
  • 51. Application 12.3 Suppose that the demand during lead time is normally distributed with an average of 85 and σ= 40. Find the safety stock, and dLT reorder point R, for a 95 percent cycle-service level. SOLUTION Safety stock = zσ= 1.645(40) = 65.8 or 66 units dLT R = Average demand during lead time + Safety stock R = 85 + 66 = 151 units Find the safety stock, and reorder point R, for an 85 percent cycle-service level. Safety stock = zσdLT = 1.04(40) = 41.6 or 42 units R = Average demand during lead time + Safety stock R = 85 + 42 = 127 units
  • 52. Reorder Point for Variable Demand and Lead Time • Often the case that both are variable • The equations are more complicated Safety stock = zσdLT R = (Average weekly demand  Average lead time) where + Safety stock = dL + Safety stock d = Average weekly (or daily or monthly) demand L = Average lead time σ= Standard deviation of weekly (or daily or monthly) demand d σ= Standard deviation of the lead time LT σ= Lσ2 + d2σ2 dLT d LT
  • 53. Reorder Point EXAMPLE 12.5 The Office Supply Shop estimates that the average demand for a popular ball-point pen is 12,000 pens per week with a standard deviation of 3,000 pens. The current inventory policy calls for replenishment orders of 156,000 pens. The average lead time from the distributor is 5 weeks, with a standard deviation of 2 weeks. If management wants a 95 percent cycle-service level, what should the reorder point be?
  • 54. Reorder Point SOLUTION We have d = 12,000 pens, σd = 3,000 pens, L = 5 weeks, and σLT = 2 weeks σdLT = Lσd 2 + d2σLT 2 = (5)(3,000)2 + (12,000)2(2)2 = 24,919.87 pens From the Normal Distribution appendix for 0.9500, the appropriate z value = 1.65. We calculate the safety stock and reorder point as follows: Safety stock = zσdLT = (1.65)(24,919.87) = 41,117.79 or 41,118 pens Reorder point = dL + Safety stock = (12,000)(5) + 41.118 = 101,118 pens
  • 55. Application 12.4 Grey Wolf lodge is a popular 500-room hotel in the North Woods. Managers need to keep close tabs on all of the room service items, including a special pint-scented bar soap. The daily demand for the soap is 275 bars, with a standard deviation of 30 bars. Ordering cost is $10 and the inventory holding cost is $0.30/bar/year. The lead time from the supplier is 5 days, with a standard deviation of 1 day. The lodge is open 365 days a year. What should the reorder point be for the bar of soap if management wants to have a 99 percent cycle-service?
  • 56. Application 12.4 SOLUTION d = 275 bars L = 5 days σ= 30 bars d σ= 1 day LT σ = Lσ2 + d2σ2 = 283.06 bars dLT d LT From the Normal Distribution appendix for 0.9900, z = 2.33. We calculate the safety stock and reorder point as follows; Safety stock = zσdLT = Reorder point + safety stock = dL + safety stock (2.33)(283.06) = 659.53 or 660 bars = (275)(5) + 660 = 2,035 bars
  • 57. Continuous Review Systems • Two-Bin system – Visual system – An empty first bin signals the need to place an order Calculating total systems costs Total cost = Annual cycle inventory holding cost + Annual ordering cost + Annual safety stock holding cost Q 2 D Q C = (H) + (S) + (H) (Safety stock)
  • 58. Application 12.5 The Discount Appliance Store uses a continuous review system (Q system). One of the company’s items has the following characteristics: Demand = 10 units/wk (assume 52 weeks per year) Ordering and setup cost (S) = $45/order Holding cost (H) = $12/unit/year Lead time (L) = 3 weeks (constant) Standard deviation in weekly demand = 8 units Cycle-service level = 70%
  • 59. Application 12.5 SOLUTION What is the EOQ for this item? D = 10/wk  52 wks/yr = 520 units 2DS H EOQ = = = 62 units 2(520)(45) 12 What is the desired safety stock? σdLT = σd L = 8 3 = 14 units Safety stock = zσdLT = 0.525(14) = 8 units
  • 60. Application 12.5 What is the desired reorder point R? R = Average demand during lead time + Safety stock R = 3(10) + 8 = 38 units What is the total annual cost? 520 62 C = ($12) + ($45) + 8($12) = $845.42 62 2
  • 61. Application 12.5 Suppose that the current policy is Q = 80 and R = 150. What will be the changes in average cycle inventory and safety stock if your EOQ and R values are implemented? Reducing Q from 80 to 62 Cycle inventory reduction = 40 – 31 = 9 units Safety stock reduction = 120 – 8 = 112 units Reducing R from 150 to 38
  • 62. Periodic Review System (P) Order placed for variable amount after fixed passage of time  Four of the original EOQ assumptions maintained  No constraints are placed on lot size  Holding and ordering costs only  Independent demand  Lead times are certain  Order is placed to bring the inventory position up to the target inventory level, T, when the predetermined time, P, has elapsed
  • 63. How Much to Order in a P System EXAMPLE 12.6 A distribution center has a backorder for five 36-inch color TV sets. No inventory is currently on hand, and now is the time to review. How many should be reordered if T = 400 and no receipts are scheduled? SOLUTION IP = OH + SR – BO = 0 + 0 – 5 = –5 sets T – IP = 400 – (–5) = 405 sets That is, 405 sets must be ordered to bring the inventory position up to T sets.
  • 64. Application 12.6 The on-hand inventory is 10 units, and T is 400. There are no back orders, but one scheduled receipt of 200 units. Now is the time to review. How much should be reordered? SOLUTION IP = OH + SR – BO = 10 + 200 – 0 = 210 T – IP = 400 – 210 = 190 The decision is to order 190 units
  • 65. Periodic Review System Selecting the time between reviews, choosing P and T  Selecting T when demand is variable and lead time is constant  IP covers demand over a protection interval of P + L  The average demand during the protection interval is d(P + L), or T = d(P + L) + safety stock for protection interval Safety stock = zσP + L , where σP + L = P L d  
  • 66. Calculating P and T EXAMPLE 12.7 Again, let us return to the bird feeder example. Recall that demand for the bird feeder is normally distributed with a mean of 18 units per week and a standard deviation in weekly demand of 5 units. The lead time is 2 weeks, and the business operates 52 weeks per year. The Q system developed in Example 12.4 called for an EOQ of 75 units and a safety stock of 9 units for a cycle-service level of 90 percent. What is the equivalent P system?
  • 67. Calculating P and T SOLUTION We first define D and then P. Here, P is the time between reviews, expressed in weeks because the data are expressed as demand per week: D =(18 units/week)(52 weeks/year) = 936 units EOQ D P = (52) = (52) = 4.2 or 4 weeks 75 936 With d = 18 units per week, an alternative approach is to calculate P by dividing the EOQ by d to get 75/18 = 4.2 or 4 weeks. Either way, we would review the bird feeder inventory every 4 weeks.
  • 68. Calculating P and T We now find the standard deviation of demand over the protection interval (P + L) = 6:    5 6 12.25 units  P L P L d   Before calculating T, we also need a z value. For a 90 percent cycle-service level z = 1.28. The safety stock becomes Safety stock = zσP + L 1=. 28(12.25) = 15.68 or 16 units We now solve for T: T = Average demand during the protection interval + Safety stock = d(P + L) + safety stock = (18 units/week)(6 weeks) + 16 units = 124 units
  • 69. Comparative Advantages • Primary advantages of P systems – Convenient – Only need to know IP when review is made  Primary advantages of Q systems  Review frequency may be individualized  Fixed lot sizes can result in quantity discounts  Lower safety stocks
  • 71. Unsolved # Qn 3 Yellow pages Inc. buys paper in 1500 pound rolls for printing. Annual demand is 2500 rolls. The cost per roll is $8,00 and the annual holding cost is 15% of the cost. Each order costs $50. A) How many rolls should Yellow press order at a time B) What is the time between orders
  • 72. Unsolved # Qn 7 Sam’s CAT hotel operates 52 weeks per year, 6 days per week, and uses a continuous review inventory system. It purchases kitty litters for $ 11.70 per bag. The following information is available about these bags: - Demand = 90 bags / week; Order cost = $54 per order; Annual holding cost = 27 percent of cost; Desired cycle service level = 80%; Lead T= 3 weeks (18 working days); SD of weekly demand = 15 bags; Current on hand inventory is 320 bags, with no open orders or backorders. A) What is the EOQ? what would be the average time between orders (in weeks) B) What should R be C) An inventory withdrawl of 10 bags was just made. Is it time to reorder D) The store currently uses a lot size of 500 bags (Q=500). What is the annual holding cost of this policy? Annual ordering cost? Without calculating the EOQ, how can you conclude from these 2 calculations that the current lot size is too large E) What should be the annual cost saved by shifting from the 500 bag lot size to the EOQ
  • 73. Unsolved # Qn 8 Consider again the Kitty litter ordering policy for Sam’s CAT hotel in previous problem. A) Suppose that the weekly demand forecast of 90 bags is incorrect and actual demand averages only 60 bags per week. How much higher will total costs be, owing to the distorted EOQ caused by this forecast error B) Suppose that actual demand is 60 bags but that ordering costs are cut to only $6 by using internet to automate order placing. However, the buyer does not tell anyone and the EOQ is not adjusted to reflect this reduction in S. How much higher will total costs be, compared to what they could be, if EOQ were adjusted
  • 74. Unsolved # Qn 24 The farmer’s wife is a country store specializing in knickknacks suitable for a farm house décor. One item experiencing a considerable buying frenzy is a miniature Holstein cow. Average weekly demand is 30 cows, with a SD of 5 cows. The cost to place a replenishment order is $15 and the holding cost is $.75/ cow /year. The supplier however is in China. The LT for new orders is 8 weeks, with a SD of 2 weeks. The farmer’s wife which is open only 50 weeks a year wants to develop a continuous review system for this item with a cycle service level of 90 percent. A. Specify the continuous review system for cows. Explain how it would work in practice B. What is the total annual cost for the system you develop
  • 75. Solved Problem 2 Nelson’s Hardware Store stocks a 19.2 volt cordless drill that is a popular seller. Annual demand is 5,000 units, the ordering cost is $15, and the inventory holding cost is $4/unit/year. a. What is the economic order quantity? b. What is the total annual cost for this inventory item? SOLUTION a. The order quantity is 2DS H EOQ = = 2(5,000)($15) $4 = 37,500 = 193.65 or 194 drills b. The total annual cost is Q 2 D Q C = (H) + (S) = ($4) + ($15) = $774.60 194 2 5,000 194
  • 76. Solved Problem 3 A regional distributor purchases discontinued appliances from various suppliers and then sells them on demand to retailers in the region. The distributor operates 5 days per week, 52 weeks per year. Only when it is open for business can orders be received. Management wants to reevaluate its current inventory policy, which calls for order quantities of 440 counter-top mixers. The following data are estimated for the mixer: Average daily demand (d) = 100 mixers Standard deviation of daily demand (σd) = 30 mixers Lead time (L) = 3 days Holding cost (H) = $9.40/unit/year Ordering cost (S) = $35/order Cycle-service level = 92 percent The distributor uses a continuous review (Q) system
  • 77. Solved Problem 3 a. What order quantity Q, and reorder point, R, should be used? b. What is the total annual cost of the system? c. If on-hand inventory is 40 units, one open order for 440 mixers is pending, and no backorders exist, should a new order be placed?
  • 78. Solved Problem 3 SOLUTION a. Annual demand is D = (5 days/week)(52 weeks/year)(100 mixers/day) = 26,000 mixers/year The order quantity is 2DS H EOQ = = 2(26,000)($35) $9.40 = 193,167 = 440.02 or 440 mixers
  • 79. Solved Problem 3 The standard deviation of the demand during lead time distribution is σdLT = σd L = 30 3 = 51.96 A 92 percent cycle-service level corresponds to z = 1.41 Safety stock = zσdLT = 1.41(51.96 mixers) = 73.26 or 73 mixers Average demand during lead time = dL = 100(3) = 300 mixers Reorder point (R) = Average demand during lead time + Safety stock = 300 mixers + 73 mixers = 373 mixers With a continuous review system, Q = 440 and R = 373
  • 80. Solved Problem 3 b. The total annual cost for the Q systems is Q 2 D Q C = (H) + (S) + (H)(Safety stock) 440 2 26,000 440 C = ($9.40) + ($35) + ($9.40)(73) = $4,822.38 c. Inventory position = On-hand inventory + Scheduled receipts – Backorders IP = OH + SR – BO = 40 + 440 – 0 = 480 mixers Because IP (480) exceeds R (373), do not place a new order
  • 81. Solved Problem 4 Suppose that a periodic review (P) system is used at the distributor in Solved Problem 3, but otherwise the data are the same. a. Calculate the P (in workdays, rounded to the nearest day) that gives approximately the same number of orders per year as the EOQ. b. What is the target inventory level, T? Compare the P system to the Q system in Solved Problem 3. c. What is the total annual cost of the P system? d. It is time to review the item. On-hand inventory is 40 mixers; receipt of 440 mixers is scheduled, and no backorders exist. How much should be reordered?
  • 82. Solved Problem 4 SOLUTION a. The time between orders is EOQ D P = (260 days/year) = (260) = 4.4 or 4 days 440 26,000 b. Figure 12.12 shows that T = 812 and safety stock = (1.41)(79.37) = 111.91 or about 112 mixers. The corresponding Q system for the counter-top mixer requires less safety stock.
  • 83. Solved Problem 4 c. The total annual cost of the P system is dP 2 D dP C = (H) + (S) + (H)(Safety stock) 100(4) C = ($9.40) + ($35) + ($9.40)(1.41)(79.37) 2 26,000 100(4) = $5,207.80 d. Inventory position is the amount on hand plus scheduled receipts minus backorders, or IP = OH + SR – BO = 40 + 440 – 0 = 480 mixers The order quantity is the target inventory level minus the inventory position, or Q = T – IP = 812 mixers – 480 mixers = 332 mixers An order for 332 mixers should be placed.
  • 84. Solved Problem 5 Grey Wolf Lodge is a popular 500-room hotel in the North Woods. Managers need to keep close tabs on all room service items, including a special pine-scented bar soap. The daily demand for the soap is 275 bars, with a standard deviation of 30 bars. Ordering cost is $10 and the inventory holding cost is $0.30/bar/year. The lead time from the supplier is 5 days, with a standard deviation of 1 day. The lodge is open 365 days a year. a. What is the economic order quantity for the bar of soap? b. What should the reorder point be for the bar of soap if management wants to have a 99 percent cycle-service level? c. What is the total annual cost for the bar of soap, assuming a Q system will be used?
  • 85. Solved Problem 5 SOLUTION a. We have D = (275)(365) = 100,375 bars of soap; S = $10; and H = $0.30. The EOQ for the bar of soap is 2DS H EOQ = = 2(100,375)($10) $0.30 = 6,691,666.7 = 2,586.83 or 2,587 bars
  • 86. Solved Problem 5 b. We have d = 275 bars/day, σd = 30 bars, L = 5 days, and σLT = 1 day. σdLT = Lσd 2 + d2σLT 2 = (5)(30)2 + (275)2(1)2 = 283.06 bars Consult the body of the Normal Distribution appendix for 0.9900. The closest value is 0.9901, which corresponds to a z value of 2.33. We calculate the safety stock and reorder point as follows: Safety stock = zσdLT = (2.33)(283.06) = 659.53 or 660 bars Reorder point = dL + Safety stock = (275)(5) + 660 = 2,035 bars
  • 87. Solved Problem 5 c. The total annual cost for the Q system is Q 2 D Q C = (H) + (S) + (H)(Safety stock) 2,587 C = ($0.30) + ($10) + ($0.30)(660) = $974.05 2 100,375 2,587
  • 88. Solved Problem 6 Zeke’s Hardware Store sells furnace filters. The cost to place an order to the distributor is $25 and the annual cost to hold a filter in stock is $2. The average demand per week for the filters is 32 units, and the store operates 50 weeks per year. The weekly demand for filters has the probability distribution shown on the left below. The delivery lead time from the distributor is uncertain and has the probability distribution shown on the right below. Suppose Zeke wants to use a P system with P = 6 weeks and a cycle-service level of 90 percent. What is the appropriate value for T and the associated annual cost of the system?
  • 89. Solved Problem 6 Demand Probability 24 0.15 28 0.20 32 0.30 36 0.20 40 0.15 Lead Time (wks) Probability 1 0.05 2 0.25 3 0.40 4 0.25 5 0.05
  • 90. Solved Problem 6 SOLUTION Figure 12.13 contains output from the Demand During the Protection Interval Simulator from OM Explorer.
  • 91. Solved Problem 6 Given the desired cycle-service level of 90 percent, the appropriate T value is 322 units. The simulation estimated the average demand during the protection interval to be 289 units, consequently the safety stock is 322 – 289 = 33 units. The annual cost of this P system is 6(32) 2 50(32) 6(32) C = ($2) + ($25) + (33)($2) = $192.00 + $208.33 + $66.00 = $466.33
  • 92. Solved Problem 7 Consider Zeke’s inventory in Solved Problem 6. Suppose that he wants to use a continuous review (Q) system for the filters, with an order quantity of 200 and a reorder point of 140. Initial inventory is 170 units. If the stockout cost is $5 per unit, and all of the other data in Solved Problem 6 are the same, what is the expected cost per week of using the Q system? SOLUTION Figure 12.14 shows output from the Q System Simulator in OM Explorer. Only weeks 1 through 13 and weeks 41 through 50 are shown in the figure. The average total cost per week is $305.62. Notice that no stockouts occurred in this simulation. These results are dependent on Zeke’s choices for the reorder point and lot size. It is possible that stockouts would occur if the simulation were run for more than 50 weeks.