A Tale Of Two Purchasing Managers
•
9 recomendaciones•2,611 vistas

It shows the best of practices, it shows the worst of practices. The epic tale of the Spend Analysis journey across two enterprises, illustrated.
Recomendados

Recomendados
Más contenido relacionado
Similar a A Tale Of Two Purchasing Managers
Similar a A Tale Of Two Purchasing Managers (20)
Más de SAP Ariba
Más de SAP Ariba (20)
Último
Último (20)
A Tale Of Two Purchasing Managers
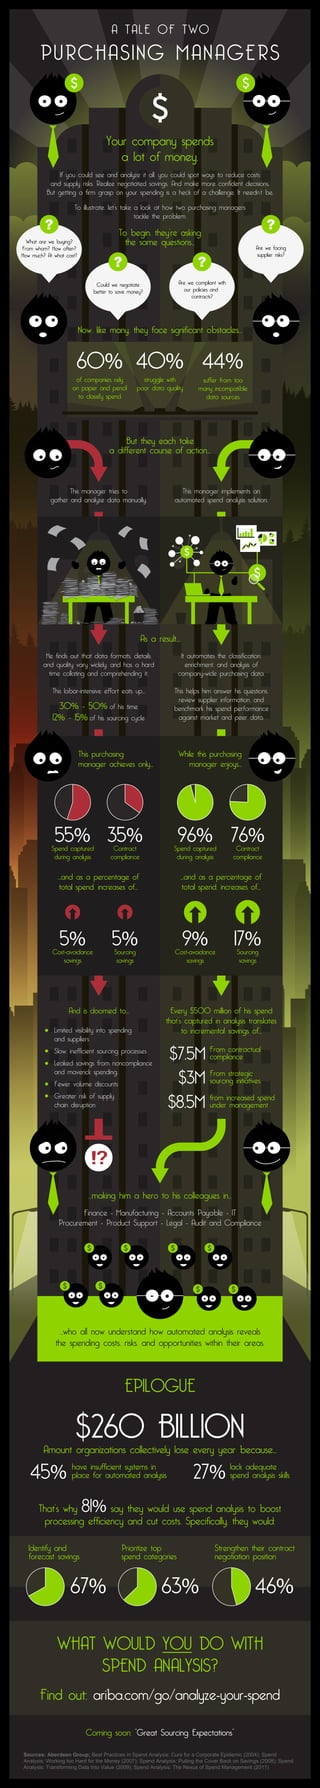
- 1. Sources: Aberdeen Group; Best Practices in Spend Analysis: Cure for a Corporate Epidemic (2004); Spend Analysis: Working too Hard for the Money (2007); Spend Analysis: Pulling the Cover Back on Savings (2008); Spend Analysis: Transforming Data Into Value (2009); Spend Analysis: The Nexus of Spend Management (2011) Coming soon: “Great Sourcing Expectations” Find out: ariba.com/go/analyze-your-spend WHAT WOULD YOU DO WITH SPEND ANALYSIS? Strengthen their contract negotiation position 46% Prioritize top spend categories 63% Identify and forecast savings 67% That’s why 81% say they would use spend analysis to boost processing efficiency and cut costs. Specifically, they would: lack adequate spend analysis skills27%have insufficient systems in place for automated analysis45% Amount organizations collectively lose every year because... $260 BILLION EPILOGUE ...who all now understand how automated analysis reveals the spending costs, risks, and opportunities within their areas. Finance - Manufacturing - Accounts Payable - IT Procurement - Product Support - Legal - Audit and Compliance ...making him a hero to his colleagues in... from increased spend under management$8.5M From strategic sourcing initiatives$3M From contractual compliance$7.5M Every $500 million of his spend that’s captured in analysis translates to incremental savings of... Greater risk of supply chain disruption Fewer volume discounts Leaked savings from noncompliance and maverick spending. Slow, inefficient sourcing processes Limited visibility into spending and suppliers And is doomed to... Sourcing savings 17%Cost-avoidance savings 9% ...and as a percentage of total spend, increases of... Contract compliance 76%Spend captured during analysis 96% While this purchasing manager enjoys... Sourcing savings 5%Cost-avoidance savings 5% ...and as a percentage of total spend, increases of... Contract compliance 35%Spend captured during analysis 55% This purchasing manager achieves only... It automates the classification, enrichment, and analysis of company-wide purchasing data. This helps him answer his questions, review supplier information, and benchmark his spend performance against market and peer data. He finds out that data formats, details, and quality vary widely, and has a hard time collating and comprehending it. This labor-intensive effort eats up... 30% - 50% of his time 12% - 15% of his sourcing cycle As a result... This manager implements an automated spend analysis solution. This manager tries to gather and analyze data manually. But they each take a different course of action... suffer from too many incompatible data sources 44% struggle with poor data quality 40% of companies rely on paper and pencil to classify spend 60% Now, like many, they face significant obstacles... Are we facing supplier risks? Are we compliant with our policies and contracts? Could we negotiate better to save money? What are we buying? From whom? How often? How much? At what cost? To begin, they’re asking the same questions... If you could see and analyze it all, you could spot ways to reduce costs and supply risks. Realize negotiated savings. And make more confident decisions. But getting a firm grasp on your spending is a heck of a challenge. It needn’t be. To illustrate, let’s take a look at how two purchasing managers tackle the problem. Your company spends a lot of money. PURCHASING MANAGERS A TALE OF TWO