Benefit of Serum-Thymidine Kinase 1 Concentration for Risk Assessment from Ga...
AACR 2016 Entinostat_anti-PD-1 poster Final
1. The selective class I HDAC inhibitor entinostat enhances the antitumor effect of PD-1 inhibition in
a syngeneic orthotopic murine model of renal cell carcinoma
Ashley Orillion*1,5,6, Li Shen*3, Remi Adelaiye-Ogala2,5,6, May Elbanna5,6, Sreenivasulu Chintala5, Sreevani Arisa5, Benjamin Elzey7, Chinghai Kao8,
and Roberto Pili4,5,6
1Department of Cancer Genetics, Roswell Park Cancer Institute, Buffalo NY, USA; 2Department of Cancer Pathology and Prevention, Roswell Park Cancer Institute Division, University at Buffalo, Buffalo NY, USA;
3Department of Medicine, Roswell Park Cancer Institute, Buffalo NY, USA; 4Adjunct Faculty, Roswell Park Cancer Institute, Buffalo, NY, USA; 5Genitourinary Program, Indiana University, Indianapolis IN, USA;
6Department of Pharmacology and Toxicology, IUPUI, Indianapolis IN, USA, 7Department of Comparative Pathobiology, Purdue University, Lafayette, IN, 8Department of Microbology and Immunology, IUPUI,
Indianapolis, IN
Background: Recent advances in immunotherapy have highlighted the antitumor effects of immune
checkpoint inhibition. Novel anti-PD-1/PD-L1 immunotherapies have been shown to effectively overcome
tumor avoidance of immune surveillance in several tumor types including renal cell carcinoma. Our group
has recently shown that the selective class I HDAC inhibitor entinostat is effective in suppressing regulatory
T cells and enhancing immunotherapies in murine renal and prostate models, RENCA and Myc-Cap
respectively. In this study we have evaluated the combination of entinostat with an anti-PD-1 antibody in
the RENCA renal cell carcinoma model.
Methods: In two separate studies, BALB/c female mice were implanted with the syngeneic, orthotopic, renal
cell carcinoma mouse model, RENCA – luciferase tagged – at day -8. Treatment (8-9 mice /group) with anti-
mouse-PD-1 (aPD-1; 10mg/kg twice a week, I.P.), entinostat (5mg/kg 5 days a week), or combination of the
two was begun at day 1. Bioluminescence imaging was performed at baseline, midpoint and endpoint time
points to assess the orthotopic tumor growth. End point tumor weights were taken to assess the effect of
combination treatment.
Results: Analysis of tumor growth showed a reduction of bioluminescence across the three time points in
the combination group as compared to the vehicle and single agent treatments. Additionally, end point
analysis of tumor weights revealed an overall reduction in the size of the tumors in the entinostat/anti-mPD-
1 combination group (83.2% inhibition) as compared to the vehicle (p<0.0001), aPD-1 alone (34.9%
inhibition)(p=0.0768), and entinostat alone (52.5% inhibition)(p=0.0015) groups. Examination of the status
of the infiltrating immune cells of the tumor microenvironment via flow cytometry, qRT-PCR,
immunohistochemistry, and/or immunofluorescence analysis is ongoing.
Conclusions: Our preliminary results suggest that the immunomodulatory activity of the selective class I
HDAC inhibitor entinostat may enhance the antitumor effect of PD-1/PD-L1 inhibition and provide the
rationale for the clinical testing of this novel combination in patients with RCC.
ABSTRACT
BACKGROUND
RESULTS
CONCLUSIONS
ACKNOWLEDGEMENTS
This study was supported in part by a research grant from Syndax. The agents were kindly provided by CTEP at NCI through
a MTA.
OBJECTIVE
• Combination of entinostat and anti-PD-1 significantly inhibits tumor growth in the orthotopic murine model of renal
cell carcinoma, RENCA. The data are consistent with our previous findings combining entinostat with IL-2 (Shen et al,
PLoS ONE, 2012).
• Entinostat alone has an inhibitory effect on circulating TReg cells as seen with both the percentage of FoxP3+ cells in
the CD4+ population and the MFI downward shift in the treated groups. However, anti-PD-1, alone and in combination
with entinostat, shows an increase in the presence and protein levels of TRegs in the circulation while showing a
decrease in the tumor microenvironment.
• CD8+ T cells are increased in the tumor microenvironment in the combination group. Additionally, the CD8+ : T-
Regulatory cell ratio is increased in the combination group indicating that anti-PD-1 in combination with entinostat has
a pro-stimulatory effect on the immune cells of the tumor microenvironment.
• Within the tumor microenvironment there is a significant increase in Ly6G+Ly6Clow MDSCs and a moderate increase in
Ly6ChighLy6G- cells. This may indicate a shift in the function of the MDSCs to be more immunostimulatory than
immunosuppressive. Further work is ongoing to assess the functionality of the MDSCs in the tumor microenvironment.
These findings provide reasoning for further investigating the combined anti-tumor effect of entinostat and immune
checkpoint inhibitors in renal cell carcinoma.
• The objective of this study is the preclinical assessment of entinostat in combination with an anti-PD-1
antibody in in vivo models of renal cell carcinoma. Our group has already shown the potential
immunomodulatory activity of entinostat in animal models and has been testing it in a clinical trial
(Kato Y et al. Clinical Cancer Res 2007; Shen L et al. PLoSOne 2012). In view of the immunomodulatory
effect of entinostat we are exploring the combination of this selective HDAC inhibitor with the anti-PD-
1 immune checkpoint inhibitor using the RENCA model for kidney cancer.
Poster
#4906
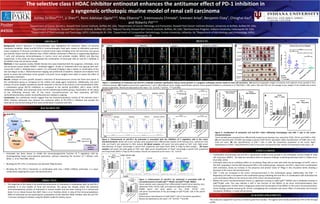
Figure 1. Combination of entinostat and anti-PD-1 antibody treatment significantly reduces tumor growth in a syngeneic orthotopic murine model of renal cell carcinoma. (A) Spectral topography images of baseline and endpoint tumor growth in four
treatment groups. (B) Endpoint tumors from experiments 1 and 2. (C) Endpoint tumor weight quantification (grams) Tumor growth inhibition is calculated as (1-TWt/TWc) x 100, where TWt and TWc are the average tumor weight of the treated and control
groups respectively. Results are expressed as the mean ± SE. *p<0.05, **p<0.01, ****p<0.0001.
Figure 2. Enhancement of anti-PD-1 by entinostat is associated with the inhibition of T regulatory cells in the tumor
microenvironment. Blood and tumor samples were prepared from differentially treated tumor-bearing mice, stained for CD4,
CD8, and FoxP3, and subjected to FACS analysis (A) Blood samples: Left panel: Dot plots gated on CD4+ cells. Right panel:
Quantification of Foxp3+ percentage in parent CD4+ population and Foxp3 levels (MFI) in Tregs by FACS analysis . (B) Tumor
samples: Left panel: Dot plots gated on CD4+ cells. Right panel: Quantification of Foxp3+ percentage in parent CD4+ population
and Foxp3 levels (MFI) in Tregs by FACS analysis. Results are expressed as the mean ± SE. *p<0.05
*p<0.05
** p<0.01
**** p<0.0001
Figure 3. Enhancement of anti-PD-1 by entinostat is associated with an
increased presence of Ly6G+Ly6CLow MDSCs and Ly6ChighLy6G- MDSCs.
Tumor samples were prepared from differentially treated tumor-bearing mice,
stained for CD45, CD11b, Ly6C, and Ly6G and subjected to FACS analysis.
Middle panel: Dot plots gated on live, CD45+ CD11b+ cells.
Left panel: Quantification of the percentage of Ly6ChighLy6G- cells in the parent
population.
Bottom panel: Quantification of Ly6G+Ly6Clow cells in the parent population.
Results are expressed as the mean ± SE. *p<0.05, **p<0.001
A B C
A
B
• Entinostat has been shown to inhibit the immunosuppressive function of T regulatory cells by
downregulating Foxp3 transcriptional expression, without impacting the function of T effector cells
(Shen, L., et al. PLoS ONE ,2012).
• Blocking the PD-1:PD-L1 interaction can decrease TReg function.
• Blocking the PD-1:PD-L1 interaction in combination with class I HDAC inhibitor, entinostat, is a novel
combination targeting the tumor microenvironment.
A
Figure 4. Combination of entinostat and anti-PD-1 alters infiltrating macrophages and CD8+ T cells in the tumor
microenvironment.
Tumor samples were prepared from differentially treated tumor-bearing mice, stained for CD45, CD11b, and F4/80 or CD8.
(A) Left: Quantification of F4/80+ percentage in parent CD45+CD11b+ population. Right: Quantification of F4/80+ cells in the
total cell count. (B) Left: Quantification of CD8+ T cells in total live lymphocyte population of the tumor. Right:
Quantification of CD8+ / Treg (CD4+FoxP3+) ratio in the tumor microenvironment. Results are expressed as the mean ± SE.
B