SlideShare una empresa de Scribd logo
1 de 10
Descargar para leer sin conexión
 

News Release
Aviva plc  
2013 Preliminary Announcement 

Aviva plc
2013 Preliminary Results Announcement

Cash flow

Cash remittances1 to Group up 40% at £1,269 million2 (FY12: £904 million)
Operating capital generation1 £1,772 million (FY12: £1,859 million)
Remittance ratio 72%1,2 (FY12: 49%)
Final dividend per share 9.4p (FY12: 9p). Full year dividend per share 15p.

Profit

Operating profit1 6% higher at £2,049 million (FY12: £1,926 million)
IFRS profit after tax £2,151 million (FY12: loss after tax £2,934 million)

Expenses

Operating expenses £3,006 million1,3, down 7%
£360 million cost savings already achieved
2013 cost savings ahead of plan

Value of new business

Value of new business5 up 13% at £835 million (FY12: £738 million)
Poland, Turkey and Asia5 contributed 21% of Group VNB (FY12: 16%) and collectively
grew 49%

Combined operating ratio

Combined operating ratio 97.3% (FY12: 97.0%)
2014 flood losses of £60 million in the UK in January and February, in line with long
term average

Balance sheet

Intercompany loan reduced by £1.7 billion to £4.1 billion at end of February 2014
(FY12: £5.8 billion)
Agreed plan to reduce inter-company loan to £2.2 billion by end of 2015, utilising
£450 million of existing cash resources and £1.45 billion of other actions
Liquidity of £1.6 billion at end of February 2014
Economic capital surplus4 £8.3 billion (FY12: £7.1 billion4), coverage ratio 182%
IFRS net asset value per share 270p (FY12: 278p)
MCEV net asset value per share 445p (FY12: 422p)

Mark Wilson, Group Chief Executive Officer, said:

“The turnaround at Aviva is intensifying. We have focused the business on ‘cash flow plus growth’ and the benefits are starting to be
reflected in our performance. Cash flows to the Group are up 40%, operating expenses are down 7%, operating profit is up 6% and
Value of New Business is up 13%. After a £2.9 billion loss after tax last year, Aviva has delivered a £2.2 billion profit.
“Following our exit from a number of low margin, underperforming or non-strategic businesses, Aviva is simpler, more focused and
better managed. We have significantly improved our capital surplus, increased our liquidity and have a stronger leadership team.
“Although we have made progress in 2013, I want to guard against complacency. Aviva still has issues to address. Have we made
progress? Yes, some. Is it a little faster than anticipated? Probably. Have we unlocked the full potential at Aviva? Not yet.”

1
2
3
4
5

On a continuing basis, excluding US Life and Delta Lloyd
Cash remittances include amounts received from UK General Insurance in January 2014 in respect of activity in 2013.
Operating expenses excludes integration and restructuring costs and US Life
The pro forma surplus at FY12 included the benefit of disposals and an increase in pension scheme risk allowance from five to ten years of stressed contributions. The economic capital surplus represents an estimated position. The
capital requirement is based on Aviva’s own internal assessment and capital management policies. The term ‘economic capital’ does not imply capital as required by regulators or other third parties.
Excluding Malaysia and Sri Lanka.
Aviva plc
2013 Preliminary Announcement

Key financial metrics

Cash
Cash remitted to Group

Operating capital generation

Continuing operations, excluding Delta Lloyd

2013
£m

2012
£m

Sterling%
change

2013
£m

Restated1
2012
£m

Sterling%
change

United Kingdom & Ireland Life
United Kingdom & Ireland general insurance & health2
Europe
Canada
Asia and Other

370
347
388
130
34

150
150
343
136
125

147%
131%
13%
(4)%
(73)%

595
374
558
177
68

688
376
571
192
32

(14)%
(1)%
(2)%
(8)%
113%

1,269

904

40%

1,772

1,859

(5)%

Total

Operating profit: IFRS basis
Continuing operations, excluding Delta Lloyd

2013
£m

Restated1
2012
£m

Life business
General insurance and health
Fund management
Other*

1,901
797
93
(742)

1,831
894
51
(850)

Total

2,049

1,926

*

Sterling%
change

4%
(11)%
82%
13%
6%

Includes other operations, Corporate Centre costs and Group debt and other interest costs.

Expenses
2013
£m

2012
£m

Sterling%
change

Operating expenses
Integration & restructuring costs

3,006
363

3,234
461

(7)%
(21)%

Expense base

3,369

3,695

(9)%

Continuing operations

2013
£m

2012
£m

Sterling %
change

United Kingdom
Ireland
France
Poland
Italy
Spain
Turkey & Other Europe
Asia – excluding Malaysia & Sri Lanka

435
6
166
51
15
33
38
91

420
(8)
119
35
29
56
32
55

Value of new business – excluding Malaysia & Sri Lanka

835

738

13%

1

8

(88)%

836

746

12%

Continuing operations

Value of new business

Malaysia & Sri Lanka
Value of new business

4%
175%
39%
46%
(48)%
(41)%
19%
65%

General insurance combined operating ratio
Continuing operations

2013

2012

Change

United Kingdom & Ireland
Europe
Canada

97.2%
98.1%
94.6%

98.6%
99.4%
93.4%

(1.4)pp
(1.3)pp
1.2pp

General insurance combined operating ratio

97.3%

97.0%

0.3pp

2013
£m

2012
£m

Sterling%
change

IFRS Profit after tax
IFRS profit/(loss) after tax

2,151

(2,934)

n/a

Dividend
2013

2012

9.4p
15.0p

9.0p
19.0p

2013
£bn

2012
£bn

Pro forma4
2012
£bn

Estimated economic capital surplus3

8.3

5.3

7.1

Estimated IGD solvency surplus3

3.6

3.8

3.9

IFRS net asset value per share
MCEV5 net asset value per share

270p
445p

278p
422p

Final dividend
Total dividend per share

Capital position

1
2
3
4
5

The Group adopted the amendments to IAS19 and IFRS10 during the period and the requirements of the revised standards have been applied retrospectively.
Cash remittances include amounts received from Aviva Insurance Limited in January 2014 in respect of 2013 activity.
The economic capital surplus and IGD solvency surplus represent an estimated position. The economic capital requirement is based on Aviva’s own internal assessment and capital management policies. The term ‘economic capital’
does not imply capital as required by regulators or other third parties.
The pro forma economic capital and IGD surplus at FY12 includes the benefit of completing the US Life, Aseval, Delta Lloyd and Malaysia transactions and, for economic capital only, an increase in pension scheme risk allowance from
five to ten years of stressed contributions.
In preparing the MCEV information, the directors have done so in accordance with the European Insurance CFO Forum MCEV Principles with the exception of stating held for sale operations at their expected fair value, as represented
by expected sale proceeds, less cost to sell.
Aviva plc
2013 Preliminary Announcement

Overview

Group Chief Executive Officer’s Report

The turnaround at Aviva is intensifying. We have focused the business on ‘cash flow plus growth’ and
are beginning to see the benefits of this reflected in our performance. Cash flows are up 40%,
operating expenses are down 7%, operating profit is up 6% and Value of New Business is up 13%.
After a £2.9 billion loss after tax last year, Aviva has delivered a £2.2 billion profit after tax.
To deliver our investment thesis of cash flow plus growth we need to be financially robust. In 2013, we
increased economic capital surplus from £7.1 billion1 to £8.3 billion and liquidity at the Group Centre
has increased significantly to £1.6 billion at the end of February 2014. With reference to earnings and
cash flow improvements, the Board has proposed a 9.4p dividend.
Reducing the inter-company loan has been a key priority in 2013. Over the past 12 months, we have
reduced the loan by £1.7 billion to £4.1 billion2. We have agreed a comprehensive plan to reduce the
inter-company loan to £2.2 billion, utilising £450 million of existing cash resources and £1.45 billion of
other actions. We have reached agreement with the Prudential Regulation Authority (“PRA”) and I
believe the execution of this plan will take the issue of our inter-company loan off the table.
We have also completed significant disposals in the US, Aseval in Spain, Malaysia, Netherlands and
announced a disposal in Italy. I believe Aviva is now more focused and better managed.
Aviva has an extraordinary depth of talented people who understand the core insurance businesses
and this depth means we have strong core underwriting businesses. Nevertheless, we needed to
strengthen some aspects of our skill set and since the start of 2013, Aviva’s senior management pool
has been deepened with key appointments in finance, asset management, human resources, IT and
transformation, together with numerous internal promotions.
Although we have made progress in 2013, turnarounds are rarely linear and the improving results
should be tempered by the realism that the business still has issues to address and is performing
nowhere near its full potential.

Cash flow
Cash remitted to
Group of £1,269
million3 up 40%
72% remittance ratio
(FY12: 49%)

Operating profit
Operating profit:
£2,049 million, up
6%

The first part of our ‘cash flow plus growth’ investment thesis is to convert more of our profits into
cash remitted to Group. Higher cash remittances allow for optimal capital allocation and dividend
flexibility. In 2013, cash remittances were £1,269 million3, a 40% increase over the 2012 comparative.
This represents a remittance ratio of 72% of operating capital generation (OCG) and is progress
towards my ambition to get the remittance ratio above 80%.
Our cash generators, UK, France and Canada, generated a 59% increase in cash remittances, making
up 80% of the total cash remitted to Group. Following the resumption of dividends from Ireland and
Italy, all our turnaround businesses are now remitting cash to Group.

2013 operating profit increased 6% to £2,049 million (FY12: £1,926 million). The stability of our
profit stream underlines our ‘cash flow plus growth’ investment proposition. After a £2.9 billion loss
last year principally due to the write-down of Aviva USA, our profit after tax increased to £2.2 billion.
While satisfactory at a Group level, there remain a number of opportunities to improve our operating
profit. Declines in our Italian and Spanish life businesses need to be reversed and our growth markets
need over time to contribute more to operating profit. Aviva Investors grew its fund management
contribution 74%, but at around 3% of group operating profit and with assets under management of
£241 billion, this remains inadequate. Plans are in place to address these issues over the coming years
and Euan Munro brings much needed leadership and impetus to Aviva Investors.

 
1
2
3

The pro forma surplus at FY12 included the benefit of disposals and an increase in pension scheme risk allowance from five to ten years of stressed contributions.
At end of February 2014.
Includes £347 million remitted by UK General Insurance in January 2014 in respect of activity in 2013.
Aviva plc
2013 Preliminary Announcement

Expenses
Operating expenses
£360 million lower
than 2011 baseline
at £3,006 million

Group Chief Executive Officer’s Report continued

Our 2013 operating expense base is now 11% below the 2011 baseline with £360 million of expense
reductions coming through operating profit. We are well on track to deliver our £400 million expense
reduction target by the end of 2014.
There remains significant opportunity to reduce expenses further but some of these additional savings
will be reallocated in the near term towards initiatives to manage our existing books of business more
efficiently and serve customers more effectively through deploying the latest digital and automation
technology. I am confident that whatever reallocation is made will produce attractive returns and a
short payback period, without significant disruption to our workforce.
Going forward, we will measure our expense efficiency using a ratio of operating expenses to revenue.
The group expense ratio for 2013 is 54% (FY12: 57%). Lower expense ratios are essential for us to
offer competitive products to our customers and to produce the necessary returns for our
shareholders. It is my intention to show improvement in this ratio year after year.

Value of new
business
VNB4 up 13% to
£835 million

We measure our growth in life insurance by growth in value of new business (VNB), which is a good
proxy for future cash flows. In 2013, VNB4 increased 13% to £835 million (FY12: £738 million) with
stand-out performances in France and our growth markets.
Our life cash-generators in the UK and France grew VNB 4% and 39% respectively. We have achieved
this through better product and business mix and we have initiatives underway to increase productivity
in both countries. France in particular, has demonstrated that significant growth is possible in mature
markets.
We have made a number of structural changes to our turnaround businesses - such as reducing the
capital intensity of our Italian business - that should ensure more focus and better VNB growth.
Our future cash generators of Poland, Turkey, China and Asia4 contributed 21% of Group VNB (FY12:
16%) and collectively grew 49%. Our new joint venture in Indonesia is an example of how we can
expand our presence in emerging markets, without impacting the cash flow part of our investment
thesis.

Combined
operating ratio
COR at 97.3%

 
4

Excluding Malaysia and Sri Lanka.
 

In general insurance, the combined operating ratio (COR) deteriorated slightly to 97.3% (FY12:
97.0%), entirely due to adverse weather in the year. Floods in Alberta and Toronto Canada cost the
Group £129 million and the December storms in the UK had a £60 million operating profit impact,
although the impact of the UK storms was offset by better than expected weather earlier in the year.
Bad weather in the UK has persisted in January and February 2014 with claims of approximately £60
million recorded. However, this is broadly in line with our weather expectations for January and
February. Our overriding focus is to help our customers affected by the bad weather and our teams of
loss adjustors, surveyors and claims experts – the largest in the UK - have been on hand 7 days a week,
offering advice and support.
Group Chief Executive Officer’s Report continued

Aviva plc
2013 Preliminary Announcement

Financial strength
Economic capital
surplus1 £8.3 billion
Inter-company loan
reduced by £1.7
billion to £4.1 billion2

Strengthening our financial position has been a focus in 2013. Our economic capital surplus has
increased to £8.3 billion, which represents a 182% coverage ratio and includes our defined benefit
pension on a more conservative fully-funded basis. We welcome the progress made by our regulators
on Solvency II and the level playing field that this is likely to create.
Over the last 12 months there has been substantial focus on the intercompany loan (ICL) and 2013 has
seen considerable progress in this area. As at the end of February 2014, the ICL was £4.1 billion (Q1
2013: £5.8 billion), reduced by a cash contribution of £0.45 billion and non-cash measures of £1.25
billion. We have reached agreement with the PRA on the appropriate level and plans for the ICL and
will complete implementation of our plans by the end of 2015. Our target level for the loan is £2.2
billion. We plan on using a further £0.45 billion of cash and £1.45 billion of other measures to achieve
the £2.2 billion target. The cash is to come from existing liquidity, putting no extra strain on our
ongoing cash generation.
Our external leverage ratio is at 50% (FY12: 50%) of IFRS tangible capital. On a more broadly
recognised S&P basis, this ratio has reduced to 32% (FY12: 33%). We have recently stated our
intention to call two tranches of bonds, with principal of £240 million and coupon above 10%. Over
time we expect to reduce our external leverage ratio to below 40% of tangible capital.
One of the priorities in 2013 was to strengthen the management team to bring in new skills into the
group and progress has been made in this area. We have appointed new leaders in asset
management, human resources, IT, Europe, Asia, UK General Insurance and transformation through a
combination of senior internal promotions and external hires.

People

I would like to thank Pat Regan for his many contributions to the Group over the past four years and in
particular for his support of me over the past year. I wish him well in his future career in Australia. We
have announced that Tom Stoddard will succeed Pat as CFO. Tom is a high calibre individual who will
provide sound judgement and challenge.
An essential part of the company’s transformation is embedding a higher performance culture across
Aviva. We are introducing a new set of values which will guide the day to day actions of our 28,000
people. These values provide the framework on which decisions are being made. These values are:
Create Legacy, Kill Complexity, Never Rest and Care More.
One of the strengths of Aviva is the dedication and commitment of our people. This has been
exemplary in 2013 and I would like to thank them for their tireless work on behalf of our customers
and shareholders.

Outlook

In summary, our performance in 2013 shows progress towards delivering what we said we would. Our
turnaround is intensifying as we focus more on improving operational performance. We plan on using
big data to be more disruptive in predictive analytics, take advantage of our brand strength to grow
our digital direct business and drive further efficiency through automation. We will be selective in our
investments with a clinical approach to the allocation of capital.
As a business it is important that we build on the progress made in 2013. Aviva is a self-help story with
a balanced and increasingly focused portfolio of businesses. The tendency with self help or turnaround
businesses is to focus on the successes rather than the issues and as a result become complacent. I
want to guard against this happening at Aviva. Have we made progress? Yes, some. Is it a little faster
than anticipated? Probably. Have we unlocked the full potential at Aviva? No, there is more to come.

Mark Wilson,
Group Chief Executive Officer


1

The economic capital surplus represents an estimated position. The capital requirement is based on Aviva’s own internal assessment and capital management policies. The term ‘economic capital’ does not imply capital as required by
regulators or other third parties.

2

At the end of February 2014.

 
Aviva plc
2013 Preliminary Announcement

Group Chief Financial Officer’s


Overview


2013 was a year in which the financial position of the group improved, cash flow and earnings were
higher and we finalised a plan to reduce the inter-company loan to a sustainable level by the end of
2015.
We have sharpened the focus of the group, completing disposals of our US insurance business, remaining
holding in Delta Lloyd, Aseval in Spain and Malaysian business. In addition, we have announced the
disposal of our 39% stake in Italian insurer Eurovita.
The financial strength of the group has improved significantly. At the end of 2013, our economic capital
surplus increased to £8.3 billion from a pro forma surplus of £7.1 billion at FY12. Our IGD surplus has
reduced modestly to £3.6 billion (FY12: £3.8 billion) and group liquidity was £1.6 billion at the end of
February 2014.
During the year we have increased cash remittances 40% to £1,269 million (FY12: £904 million),
representing a remittance ratio of 72% of operating capital generation.
As we continue to make progress resolving our balance sheet issues, our focus will shift to improving
performance. In this area progress has already been made, particularly in improving expense and capital
efficiency.


Business Unit
Performance 

In UK life, our largest business, life operating profit grew 5%, operating expenses were 16% lower,
remittances doubled and value of new business (VNB) was 4% higher. The VNB growth came despite the
difficult comparator in the fourth quarter of 2012, when annuity sales were elevated ahead of the gender
directive implementation. The business has adapted well to the retail distribution review (RDR), with
strong net flows in our platform and SME-focused corporate pensions offering. Individual protection sales
are lower however, as banks have pulled back from advised selling. Going forward, we expect to
capitalise on our market leading position in annuities, benefit from a partial rebound in protection sales in
the bancassurance channel and extract greater efficiency from our back book.
Our UK general insurance business (“UK GI”) grew its underwriting result to £117 million (FY12: £48
million) and the combined operating ratio improved to 97% (FY12: 98.3%). Despite a stormy end to
2013, the UK results benefitted from relatively benign weather over the whole year. Remittances from UK
GI in respect of 2013 increased to £347 million primarily due to the simplified legal entity structure and
the restructure of the internal loan.
A lower long-term investment result (LTIR) of 3.2% on average assets (FY12: 4.2%) brought down the
UK GI operating profit to £431 million (FY12: £459 million). This lower investment return is primarily due
to a reduced interest rate on the inter-company loan, which although it impacts the results of the UK GI
business, is offset at Group by lower internal interest costs. The LTIR is expected to continue reducing as
we bring down the inter-company loan. Personal motor, home and commercial property all achieved
improved combined operating ratios. Total commercial COR was 102.9% (FY12: 104.0%). Within this,
large commercial lines business drove an 11 percentage point improvement in the commercial property
COR. However, our commercial motor COR deteriorated 6 percentage points due to unfavourable prior
year development.
Our French life business had a particularly strong year. Operating profit was up 15%, value of new
business up 39%, and cash remittances up 16%. Although our overall market share is relatively modest,
we have an attractive distribution offering with a large owned sales network and existing key
partnerships including AFER, the largest savers’ association in Europe. This has seen us accumulate over
€80 billion of assets, which generate a stable revenue stream. Much of the success of 2013 has come
from a shift in focus away from capital intensive savings products to unit-linked and protection products.
Our Canadian general insurance business, the second largest in the market, produced a solid result,
despite the higher weather losses from floods in Alberta and Toronto. The combined operating ratio in
Canada was 94.6% (FY12: 93.4%), with personal lines primarily affected by bad weather with a COR of
93.3% (FY12: 90.5%). Improvement in commercial lines is, in part, attributable to the early stages of the
implementation of predictive analytics.
Group Chief Financial Officer’s Report continued

Aviva plc
2013 Preliminary Announcement

In the growth markets of Poland, Turkey and Asia, VNB improved by 46%, 23% and 65%5 respectively and
collectively contributed 21% of total Group VNB. As previously communicated, the partial nationalisation of
the Polish pensions market will have negligible impact on our growth prospects. In addition to strong new
business growth, Poland remitted £85 million in cash to group. In Asia, in addition to achieving strong
growth in Singapore and China we have also established a joint venture with Astra International,
Indonesia’s largest conglomerate, which we expect to fuel future growth. Our focus in growth markets
remains in life businesses.
Progress has been made in our turnaround businesses of Italy, Spain and Ireland, although there remains
significant room for improvement. In Spain and Italy we are moving our product mix away from more
capital intensive savings products towards unit-linked and protection products. We have resumed dividend
payments from Italy and Ireland.
The turnaround at Aviva Investors is, as previously communicated, likely to take time. The business had
assets under management at FY13 of £241 billion with £5 billion of net outflows experienced in the year.
In 2013, we found evidence of improper allocation of trades in fixed income securities in Aviva Investors by
two former employees. This occurred prior to 2013. The relevant regulatory authorities have been notified.
A thorough review of internal control processes relating to the dealing policy has been carried out by
management and reviewed by PwC. Measures to improve controls have been implemented. There is a total
adverse impact on operating profit from this activity of £132 million. We are taking steps to ensure that
customers will not ultimately be disadvantaged as a result of these breaches of the dealing policy.
The above costs are included in other operations and the impact of this cost is offset by a gain from the
curtailment of the Irish pension scheme.
 

Capital and
liquidity

Our FY2013 economic capital surplus is £8.3 billion with a coverage ratio of 182% (FY12: pro forma £7.1
billion). This includes the impact of moving the pension scheme calibration to a fully funded basis, which
reduced the surplus by approximately £0.7 billion. We have increased the economic capital surplus during
the year by a combination of product mix changes, capital allocation, asset optimisation, hedging, expense
reductions and completion of disposals. Economic capital is our preferred measure of capitalisation,
especially in anticipation of a transition to Solvency II. Our IGD surplus has reduced modestly to £3.6 billion
(FY12: £3.8 billion), with positive capital generation more than offset by the reduction in value of in force as
a result of the legislation changes to Polish pensions.
In 2013 we were included on the list of nine Global Systemically Important Insurers and will work closely
with the regulators to understand the implications of this.
Cash remittances have increased by 40% from 2012 to £1,269 million with a remittance ratio of 72% of
OCG up from 49% in 2012 with both business units in the UK reporting large increases. In UK Life this was
due to improved pricing, capital allocation and cost reductions, while in UK GI the improvement was
primarily due to the restructure of the inter-company loan. It was also encouraging to see dividends resume
from Italy and Ireland and increased dividends from France and Poland.
The £1.3 billion of remittances are used to fund the dividend, internal and external interest payments along
with central costs resulting in a neutral centre operating cash flow in 2013, improving from a deficit in
2012.
Group centre liquidity currently stands at £1.6 billion following the receipts from the disposals of Aviva
USA, Delta Lloyd and Aseval amongst others.

 
5

Excluding Malaysia and Sri Lanka.
 
Aviva plc
2013 Preliminary Announcement

Inter-company
loan

Group Chief Financial Officer’s Report continued

As part of the structural reorganisation of the group we moved a number of businesses from the UK GI
legal entity (“AIL6”) to be owned by Aviva Group Holdings (“AGH”). These businesses were paid for by way
of an inter-company loan by AIL to AGH of £5.8 billion. Since then, we have reduced the loan balance by
£1.7 billion to £4.1 billion at the end of February 2014 by repaying £450 million in cash and we have also
taken actions to reduce the required capital in AIL, which has allowed us to retire a further £1.25 billion of
the internal loan.
We have agreed with the Prudential Regulation Authority (“PRA”) the appropriate long term level of the
internal loan between AGH and AIL. That level has been set such that AIL places no reliance on the loan to
meet its stressed insurance liabilities assessed on a 1:200 basis. The PRA agree with this approach. The
effect of this will be to reduce the internal loan balance from its current level of £4.1 billion to
approximately £2.2 billion. We will complete this reduction by the end of 2015.
We plan to achieve our £2.2 billion targeted balance through a further cash repayment of £450 million
along with other actions that will bring the loan balance down by £1.45 billion. These planned actions
include the funding and de-risking of our pension scheme, along with more effective use of internal
reinsurance and other actions to reduce stressed liabilities. We expect the future cash repayment to be
funded from our existing central cash balance and future disposal proceeds. We do not expect these
actions to have a material adverse impact on group profitability.
Our overall plan to reduce the loan balance to £2.2 billion has been reviewed and agreed by the PRA.

External
leverage

External leverage remains broadly unchanged in 2013, with a debt to tangible equity ratio of 50% (FY12:
50%). On an S&P basis, our leverage ratio is 32%.
In February 2014, we announced our intention to call a £200 million 10.6725% and a €50 million
10.464% hybrid bond on their respective April 2014 call dates.
We remain committed to achieving a debt to tangible capital ratio of below 40% over the medium term,
and below 30% on an S&P basis, consistent with a AA rating.


6

Aviva Insurance Limited
 
Group Chief Financial Officer’s Report continued

Aviva plc
2013 Preliminary Announcement


Net Asset
Value

Our 2013 MCEV book value per share increased 5% to 445p, primarily due to operating earnings, the effect
of the US disposal and positive investment variances, being partially offset by dividend payments, IAS19
pension movements, and integration and restructuring costs.
The IFRS book value declined 3%, primarily due to movement in the IAS19 position of our pension schemes
and in the first half of 2013, we increased the provision for default in our commercial mortgage portfolio by
£300 million. These reductions more than offset positive contributions from operating profit and higher
proceeds from the US disposal.
Net asset value7

Opening NAV per share at 31 December 2012
Operating profit
Effect of US disposal
Dividends & appropriations
Investment variances including commercial mortgage provision increase
Pension schemes
Integration and restructuring costs, goodwill impairment and other
Foreign exchange movements
Closing NAV per share at 31 December 2013

Pat Regan
Group Chief Financial Officer

 
7

Net of tax and non-controlling interests
 

IFRS

278p
53p
6p
(18)p
(14)p
(19)p
(14)p
(2)p
270p

MCEV

422p
55p
6p
(18)p
18p
(19)p
(16)p
(3)p
445p
Aviva plc
2013 Preliminary Announcement

Notes to editors

Notes to editors

All comparators are for the full year 2012 position unless
otherwise stated.
Income and expenses of foreign entities are translated at average
exchange rates while their assets and liabilities are translated at
the closing rates on 31 December 2013. The average rates
employed in this announcement are 1 euro = £0.85 (12 months
to 31 December 2012: 1 euro = £0.81) and US$1 = £0.64 (12
months to 31 December 2012: 1 US$ = £0.63).
Growth rates in the press release have been provided in
sterling terms unless stated otherwise. The following
supplement presents this information on both a sterling and
local currency basis.
Cautionary statements:

This should be read in conjunction with the documents filed
by Aviva plc (the “Company” or “Aviva”) with the United
States Securities and Exchange Commission (“SEC”). This
announcement contains, and we may make verbal statements
containing, “forward-looking statements” with respect to
certain of Aviva’s plans and current goals and expectations
relating to future financial condition, performance, results,
strategic initiatives and objectives. Statements containing the
words “believes”, “intends”, “expects”, “plans”, “will,”
“seeks”, “aims”, “may”, “could”, “outlook”, “estimates”
and “anticipates”, and words of similar meaning, are forwardlooking. By their nature, all forward-looking statements
involve risk and uncertainty. Accordingly, there are or will be
important factors that could cause actual results to differ
materially from those indicated in these statements. Aviva
believes factors that could cause actual results to differ
materially from those indicated in forward-looking statements
in the presentation include, but are not limited to: the impact
of ongoing difficult conditions in the global financial markets
and the economy generally; the impact of various local
political, regulatory and economic conditions; market
developments and government actions regarding the
sovereign debt crisis in Europe; the effect of credit spread
volatility on the net unrealised value of the investment
portfolio; the effect of losses due to defaults by
counterparties, including potential sovereign debt defaults or
restructurings, on the value of our investments; changes in
interest rates that may cause policyholders to surrender their
contracts, reduce the value of our portfolio and impact our
asset and liability matching; the impact of changes in equity or
property prices on our investment portfolio; fluctuations in
currency exchange rates; the effect of market fluctuations on
the value of options and guarantees embedded in some of
our life insurance products and the value of the assets backing
their reserves; the amount of allowances and impairments
taken on our investments; the effect of adverse capital and
credit market conditions on our ability to meet liquidity needs
and our access to capital; a cyclical downturn of the insurance

industry; changes in or inaccuracy of assumptions in pricing
and reserving for insurance business (particularly with regard
to mortality and morbidity trends, lapse rates and policy
renewal rates), longevity and endowments; the impact of
catastrophic events on our business activities and results of
operations; the inability of reinsurers to meet obligations or
unavailability of reinsurance coverage; increased competition
in the UK and in other countries where we have significant
operations; the effect of the European Union’s “Solvency II”
rules on our regulatory capital requirements; the impact of
actual experience differing from estimates used in valuing and
amortising deferred acquisition costs (“DAC”) and acquired
value of in-force business (“AVIF”); the impact of recognising
an impairment of our goodwill or intangibles with indefinite
lives; changes in valuation methodologies, estimates and
assumptions used in the valuation of investment securities; the
effect of legal proceedings and regulatory investigations; the
impact of operational risks, including inadequate or failed
internal and external processes, systems and human error or
from external events; risks associated with arrangements with
third parties, including joint ventures; funding risks associated
with our participation in defined benefit staff pension
schemes; the failure to attract or retain the necessary key
personnel; the effect of systems errors or regulatory changes
on the calculation of unit prices or deduction of charges for
our unit-linked products that may require retrospective
compensation to our customers; the effect of a decline in any
of our ratings by rating agencies on our standing among
customers, broker-dealers, agents, wholesalers and other
distributors of our products and services; changes to our
brand and reputation; changes in government regulations or
tax laws in jurisdictions where we conduct business; the
inability to protect our intellectual property; the effect of
undisclosed liabilities, integration issues and other risks
associated with our acquisitions; and the timing impact and
other uncertainties relating to acquisitions and disposals and
relating to other future acquisitions, combinations or disposals
within relevant industries. For a more detailed description of
these risks, uncertainties and other factors, please see Item 3d,
“Risk Factors”, and Item 5, “Operating and Financial Review
and Prospects” in Aviva’s Annual Report Form 20-F as filed
with the SEC on 25 March 2013. Aviva undertakes no
obligation to update the forward looking statements in this
announcement or any other forward-looking statements we
may make. Forward-looking statements in this presentation
are current only as of the date on which such statements are
made.
Aviva plc is a company registered in England No. 2468686.
Registered office
St Helen's
1 Undershaft
London
EC3P 3DQ

Contacts
Investor contacts

Media contacts

Timings

Colin Simpson
+44 (0)20 7662 8115

Nigel Prideaux
+44 (0)20 7662 0215

David Elliot
+44 (0)20 7662 8048

Andrew Reid
+44 (0)20 7662 3131

Results and presentation slides
06:30 hrs GMT
www.aviva.com

Sarah Swailes
+44 (0)20 7662 6700

Real time media conference call
07:30 hrs GMT
Analyst presentation
08.30 hrs GMT
Live webcast
08:30 hrs GMT
www.avivawebcast.com/prelim2013/

Más contenido relacionado

Más de Aviva plc

Aviva 2017 Interim Results announcement
Aviva 2017 Interim Results announcementAviva 2017 Interim Results announcement
Aviva 2017 Interim Results announcementAviva plc
 
Aviva 2017 Interim Results Analyst presentation
Aviva 2017 Interim Results Analyst presentationAviva 2017 Interim Results Analyst presentation
Aviva 2017 Interim Results Analyst presentationAviva plc
 
Aviva Plc 2016 Results Infographic
Aviva Plc 2016 Results InfographicAviva Plc 2016 Results Infographic
Aviva Plc 2016 Results InfographicAviva plc
 
Aviva Plc 2016 Preliminary Results Announcement
Aviva Plc 2016 Preliminary Results AnnouncementAviva Plc 2016 Preliminary Results Announcement
Aviva Plc 2016 Preliminary Results AnnouncementAviva plc
 
Aviva Plc 2016 Results
Aviva Plc 2016 ResultsAviva Plc 2016 Results
Aviva Plc 2016 ResultsAviva plc
 
Aviva half year results 2015 analyst presentation
Aviva half year results 2015 analyst presentationAviva half year results 2015 analyst presentation
Aviva half year results 2015 analyst presentationAviva plc
 
Investing to tackle climate risk
Investing to tackle climate riskInvesting to tackle climate risk
Investing to tackle climate riskAviva plc
 
Aviva plc First Quarter 2015 Interim Management Statement
Aviva plc First Quarter 2015 Interim Management Statement Aviva plc First Quarter 2015 Interim Management Statement
Aviva plc First Quarter 2015 Interim Management Statement Aviva plc
 
Inflation drop gives over-55s an extra £1,032 a year in disposable income as ...
Inflation drop gives over-55s an extra £1,032 a year in disposable income as ...Inflation drop gives over-55s an extra £1,032 a year in disposable income as ...
Inflation drop gives over-55s an extra £1,032 a year in disposable income as ...Aviva plc
 
Aviva 2014 Results Presentation
Aviva 2014 Results Presentation Aviva 2014 Results Presentation
Aviva 2014 Results Presentation Aviva plc
 
Road to reform: Driving out compensation culture
Road to reform: Driving out compensation cultureRoad to reform: Driving out compensation culture
Road to reform: Driving out compensation cultureAviva plc
 
Making your money last in retirement - Aviva's longevity report
Making your money last in retirement  - Aviva's longevity reportMaking your money last in retirement  - Aviva's longevity report
Making your money last in retirement - Aviva's longevity reportAviva plc
 
Making your money last in retirement - Aviva's longevity report
Making your money last in retirement  - Aviva's longevity reportMaking your money last in retirement  - Aviva's longevity report
Making your money last in retirement - Aviva's longevity reportAviva plc
 
Family Finances report - Dec 2014
Family Finances report - Dec 2014 Family Finances report - Dec 2014
Family Finances report - Dec 2014 Aviva plc
 
Aviva Real Retirement Report Autumn 2014
Aviva Real Retirement Report  Autumn 2014Aviva Real Retirement Report  Autumn 2014
Aviva Real Retirement Report Autumn 2014Aviva plc
 
Half Year 2014 Results Announcement
Half Year 2014 Results AnnouncementHalf Year 2014 Results Announcement
Half Year 2014 Results AnnouncementAviva plc
 
Aviva HY 2014 analyst presentation
Aviva HY 2014 analyst presentationAviva HY 2014 analyst presentation
Aviva HY 2014 analyst presentationAviva plc
 
Road to Reform: Tackling the UK’s Compensation Culture July 2014
Road to Reform: Tackling the UK’s Compensation Culture July 2014Road to Reform: Tackling the UK’s Compensation Culture July 2014
Road to Reform: Tackling the UK’s Compensation Culture July 2014Aviva plc
 
Aviva captial markets day
Aviva captial markets dayAviva captial markets day
Aviva captial markets dayAviva plc
 
Aviva plc annual report and accounts 2013
Aviva plc annual report and accounts 2013Aviva plc annual report and accounts 2013
Aviva plc annual report and accounts 2013Aviva plc
 

Más de Aviva plc (20)

Aviva 2017 Interim Results announcement
Aviva 2017 Interim Results announcementAviva 2017 Interim Results announcement
Aviva 2017 Interim Results announcement
 
Aviva 2017 Interim Results Analyst presentation
Aviva 2017 Interim Results Analyst presentationAviva 2017 Interim Results Analyst presentation
Aviva 2017 Interim Results Analyst presentation
 
Aviva Plc 2016 Results Infographic
Aviva Plc 2016 Results InfographicAviva Plc 2016 Results Infographic
Aviva Plc 2016 Results Infographic
 
Aviva Plc 2016 Preliminary Results Announcement
Aviva Plc 2016 Preliminary Results AnnouncementAviva Plc 2016 Preliminary Results Announcement
Aviva Plc 2016 Preliminary Results Announcement
 
Aviva Plc 2016 Results
Aviva Plc 2016 ResultsAviva Plc 2016 Results
Aviva Plc 2016 Results
 
Aviva half year results 2015 analyst presentation
Aviva half year results 2015 analyst presentationAviva half year results 2015 analyst presentation
Aviva half year results 2015 analyst presentation
 
Investing to tackle climate risk
Investing to tackle climate riskInvesting to tackle climate risk
Investing to tackle climate risk
 
Aviva plc First Quarter 2015 Interim Management Statement
Aviva plc First Quarter 2015 Interim Management Statement Aviva plc First Quarter 2015 Interim Management Statement
Aviva plc First Quarter 2015 Interim Management Statement
 
Inflation drop gives over-55s an extra £1,032 a year in disposable income as ...
Inflation drop gives over-55s an extra £1,032 a year in disposable income as ...Inflation drop gives over-55s an extra £1,032 a year in disposable income as ...
Inflation drop gives over-55s an extra £1,032 a year in disposable income as ...
 
Aviva 2014 Results Presentation
Aviva 2014 Results Presentation Aviva 2014 Results Presentation
Aviva 2014 Results Presentation
 
Road to reform: Driving out compensation culture
Road to reform: Driving out compensation cultureRoad to reform: Driving out compensation culture
Road to reform: Driving out compensation culture
 
Making your money last in retirement - Aviva's longevity report
Making your money last in retirement  - Aviva's longevity reportMaking your money last in retirement  - Aviva's longevity report
Making your money last in retirement - Aviva's longevity report
 
Making your money last in retirement - Aviva's longevity report
Making your money last in retirement  - Aviva's longevity reportMaking your money last in retirement  - Aviva's longevity report
Making your money last in retirement - Aviva's longevity report
 
Family Finances report - Dec 2014
Family Finances report - Dec 2014 Family Finances report - Dec 2014
Family Finances report - Dec 2014
 
Aviva Real Retirement Report Autumn 2014
Aviva Real Retirement Report  Autumn 2014Aviva Real Retirement Report  Autumn 2014
Aviva Real Retirement Report Autumn 2014
 
Half Year 2014 Results Announcement
Half Year 2014 Results AnnouncementHalf Year 2014 Results Announcement
Half Year 2014 Results Announcement
 
Aviva HY 2014 analyst presentation
Aviva HY 2014 analyst presentationAviva HY 2014 analyst presentation
Aviva HY 2014 analyst presentation
 
Road to Reform: Tackling the UK’s Compensation Culture July 2014
Road to Reform: Tackling the UK’s Compensation Culture July 2014Road to Reform: Tackling the UK’s Compensation Culture July 2014
Road to Reform: Tackling the UK’s Compensation Culture July 2014
 
Aviva captial markets day
Aviva captial markets dayAviva captial markets day
Aviva captial markets day
 
Aviva plc annual report and accounts 2013
Aviva plc annual report and accounts 2013Aviva plc annual report and accounts 2013
Aviva plc annual report and accounts 2013
 

Último

fca-bsps-decision-letter-redacted (1).pdf
fca-bsps-decision-letter-redacted (1).pdffca-bsps-decision-letter-redacted (1).pdf
fca-bsps-decision-letter-redacted (1).pdfHenry Tapper
 
NO1 Certified Amil Baba In Lahore Kala Jadu In Lahore Best Amil In Lahore Ami...
NO1 Certified Amil Baba In Lahore Kala Jadu In Lahore Best Amil In Lahore Ami...NO1 Certified Amil Baba In Lahore Kala Jadu In Lahore Best Amil In Lahore Ami...
NO1 Certified Amil Baba In Lahore Kala Jadu In Lahore Best Amil In Lahore Ami...Amil baba
 
PMFBY , Pradhan Mantri Fasal bima yojna
PMFBY , Pradhan Mantri  Fasal bima yojnaPMFBY , Pradhan Mantri  Fasal bima yojna
PMFBY , Pradhan Mantri Fasal bima yojnaDharmendra Kumar
 
call girls in Nand Nagri (DELHI) 🔝 >༒9953330565🔝 genuine Escort Service 🔝✔️✔️
call girls in  Nand Nagri (DELHI) 🔝 >༒9953330565🔝 genuine Escort Service 🔝✔️✔️call girls in  Nand Nagri (DELHI) 🔝 >༒9953330565🔝 genuine Escort Service 🔝✔️✔️
call girls in Nand Nagri (DELHI) 🔝 >༒9953330565🔝 genuine Escort Service 🔝✔️✔️9953056974 Low Rate Call Girls In Saket, Delhi NCR
 
government_intervention_in_business_ownership[1].pdf
government_intervention_in_business_ownership[1].pdfgovernment_intervention_in_business_ownership[1].pdf
government_intervention_in_business_ownership[1].pdfshaunmashale756
 
AfRESFullPaper22018EmpiricalPerformanceofRealEstateInvestmentTrustsandShareho...
AfRESFullPaper22018EmpiricalPerformanceofRealEstateInvestmentTrustsandShareho...AfRESFullPaper22018EmpiricalPerformanceofRealEstateInvestmentTrustsandShareho...
AfRESFullPaper22018EmpiricalPerformanceofRealEstateInvestmentTrustsandShareho...yordanosyohannes2
 
SBP-Market-Operations and market managment
SBP-Market-Operations and market managmentSBP-Market-Operations and market managment
SBP-Market-Operations and market managmentfactical
 
Managing Finances in a Small Business (yes).pdf
Managing Finances  in a Small Business (yes).pdfManaging Finances  in a Small Business (yes).pdf
Managing Finances in a Small Business (yes).pdfmar yame
 
Economic Risk Factor Update: April 2024 [SlideShare]
Economic Risk Factor Update: April 2024 [SlideShare]Economic Risk Factor Update: April 2024 [SlideShare]
Economic Risk Factor Update: April 2024 [SlideShare]Commonwealth
 
The AES Investment Code - the go-to counsel for the most well-informed, wise...
The AES Investment Code -  the go-to counsel for the most well-informed, wise...The AES Investment Code -  the go-to counsel for the most well-informed, wise...
The AES Investment Code - the go-to counsel for the most well-informed, wise...AES International
 
House of Commons ; CDC schemes overview document
House of Commons ; CDC schemes overview documentHouse of Commons ; CDC schemes overview document
House of Commons ; CDC schemes overview documentHenry Tapper
 
Tenets of Physiocracy History of Economic
Tenets of Physiocracy History of EconomicTenets of Physiocracy History of Economic
Tenets of Physiocracy History of Economiccinemoviesu
 
Current Economic situation of Pakistan .pptx
Current Economic situation of Pakistan .pptxCurrent Economic situation of Pakistan .pptx
Current Economic situation of Pakistan .pptxuzma244191
 
Stock Market Brief Deck FOR 4/17 video.pdf
Stock Market Brief Deck FOR 4/17 video.pdfStock Market Brief Deck FOR 4/17 video.pdf
Stock Market Brief Deck FOR 4/17 video.pdfMichael Silva
 
letter-from-the-chair-to-the-fca-relating-to-british-steel-pensions-scheme-15...
letter-from-the-chair-to-the-fca-relating-to-british-steel-pensions-scheme-15...letter-from-the-chair-to-the-fca-relating-to-british-steel-pensions-scheme-15...
letter-from-the-chair-to-the-fca-relating-to-british-steel-pensions-scheme-15...Henry Tapper
 
NO1 WorldWide online istikhara for love marriage vashikaran specialist love p...
NO1 WorldWide online istikhara for love marriage vashikaran specialist love p...NO1 WorldWide online istikhara for love marriage vashikaran specialist love p...
NO1 WorldWide online istikhara for love marriage vashikaran specialist love p...Amil Baba Dawood bangali
 
NO1 WorldWide Love marriage specialist baba ji Amil Baba Kala ilam powerful v...
NO1 WorldWide Love marriage specialist baba ji Amil Baba Kala ilam powerful v...NO1 WorldWide Love marriage specialist baba ji Amil Baba Kala ilam powerful v...
NO1 WorldWide Love marriage specialist baba ji Amil Baba Kala ilam powerful v...Amil baba
 
Call Girls Near Me WhatsApp:+91-9833363713
Call Girls Near Me WhatsApp:+91-9833363713Call Girls Near Me WhatsApp:+91-9833363713
Call Girls Near Me WhatsApp:+91-9833363713Sonam Pathan
 

Último (20)

fca-bsps-decision-letter-redacted (1).pdf
fca-bsps-decision-letter-redacted (1).pdffca-bsps-decision-letter-redacted (1).pdf
fca-bsps-decision-letter-redacted (1).pdf
 
NO1 Certified Amil Baba In Lahore Kala Jadu In Lahore Best Amil In Lahore Ami...
NO1 Certified Amil Baba In Lahore Kala Jadu In Lahore Best Amil In Lahore Ami...NO1 Certified Amil Baba In Lahore Kala Jadu In Lahore Best Amil In Lahore Ami...
NO1 Certified Amil Baba In Lahore Kala Jadu In Lahore Best Amil In Lahore Ami...
 
PMFBY , Pradhan Mantri Fasal bima yojna
PMFBY , Pradhan Mantri  Fasal bima yojnaPMFBY , Pradhan Mantri  Fasal bima yojna
PMFBY , Pradhan Mantri Fasal bima yojna
 
call girls in Nand Nagri (DELHI) 🔝 >༒9953330565🔝 genuine Escort Service 🔝✔️✔️
call girls in  Nand Nagri (DELHI) 🔝 >༒9953330565🔝 genuine Escort Service 🔝✔️✔️call girls in  Nand Nagri (DELHI) 🔝 >༒9953330565🔝 genuine Escort Service 🔝✔️✔️
call girls in Nand Nagri (DELHI) 🔝 >༒9953330565🔝 genuine Escort Service 🔝✔️✔️
 
government_intervention_in_business_ownership[1].pdf
government_intervention_in_business_ownership[1].pdfgovernment_intervention_in_business_ownership[1].pdf
government_intervention_in_business_ownership[1].pdf
 
AfRESFullPaper22018EmpiricalPerformanceofRealEstateInvestmentTrustsandShareho...
AfRESFullPaper22018EmpiricalPerformanceofRealEstateInvestmentTrustsandShareho...AfRESFullPaper22018EmpiricalPerformanceofRealEstateInvestmentTrustsandShareho...
AfRESFullPaper22018EmpiricalPerformanceofRealEstateInvestmentTrustsandShareho...
 
SBP-Market-Operations and market managment
SBP-Market-Operations and market managmentSBP-Market-Operations and market managment
SBP-Market-Operations and market managment
 
Managing Finances in a Small Business (yes).pdf
Managing Finances  in a Small Business (yes).pdfManaging Finances  in a Small Business (yes).pdf
Managing Finances in a Small Business (yes).pdf
 
Economic Risk Factor Update: April 2024 [SlideShare]
Economic Risk Factor Update: April 2024 [SlideShare]Economic Risk Factor Update: April 2024 [SlideShare]
Economic Risk Factor Update: April 2024 [SlideShare]
 
The AES Investment Code - the go-to counsel for the most well-informed, wise...
The AES Investment Code -  the go-to counsel for the most well-informed, wise...The AES Investment Code -  the go-to counsel for the most well-informed, wise...
The AES Investment Code - the go-to counsel for the most well-informed, wise...
 
Q1 2024 Newsletter | Financial Synergies Wealth Advisors
Q1 2024 Newsletter | Financial Synergies Wealth AdvisorsQ1 2024 Newsletter | Financial Synergies Wealth Advisors
Q1 2024 Newsletter | Financial Synergies Wealth Advisors
 
House of Commons ; CDC schemes overview document
House of Commons ; CDC schemes overview documentHouse of Commons ; CDC schemes overview document
House of Commons ; CDC schemes overview document
 
Tenets of Physiocracy History of Economic
Tenets of Physiocracy History of EconomicTenets of Physiocracy History of Economic
Tenets of Physiocracy History of Economic
 
Current Economic situation of Pakistan .pptx
Current Economic situation of Pakistan .pptxCurrent Economic situation of Pakistan .pptx
Current Economic situation of Pakistan .pptx
 
Stock Market Brief Deck FOR 4/17 video.pdf
Stock Market Brief Deck FOR 4/17 video.pdfStock Market Brief Deck FOR 4/17 video.pdf
Stock Market Brief Deck FOR 4/17 video.pdf
 
letter-from-the-chair-to-the-fca-relating-to-british-steel-pensions-scheme-15...
letter-from-the-chair-to-the-fca-relating-to-british-steel-pensions-scheme-15...letter-from-the-chair-to-the-fca-relating-to-british-steel-pensions-scheme-15...
letter-from-the-chair-to-the-fca-relating-to-british-steel-pensions-scheme-15...
 
NO1 WorldWide online istikhara for love marriage vashikaran specialist love p...
NO1 WorldWide online istikhara for love marriage vashikaran specialist love p...NO1 WorldWide online istikhara for love marriage vashikaran specialist love p...
NO1 WorldWide online istikhara for love marriage vashikaran specialist love p...
 
NO1 WorldWide Love marriage specialist baba ji Amil Baba Kala ilam powerful v...
NO1 WorldWide Love marriage specialist baba ji Amil Baba Kala ilam powerful v...NO1 WorldWide Love marriage specialist baba ji Amil Baba Kala ilam powerful v...
NO1 WorldWide Love marriage specialist baba ji Amil Baba Kala ilam powerful v...
 
Monthly Economic Monitoring of Ukraine No 231, April 2024
Monthly Economic Monitoring of Ukraine No 231, April 2024Monthly Economic Monitoring of Ukraine No 231, April 2024
Monthly Economic Monitoring of Ukraine No 231, April 2024
 
Call Girls Near Me WhatsApp:+91-9833363713
Call Girls Near Me WhatsApp:+91-9833363713Call Girls Near Me WhatsApp:+91-9833363713
Call Girls Near Me WhatsApp:+91-9833363713
 

Aviva plc 2013 Preliminary Results Announcement

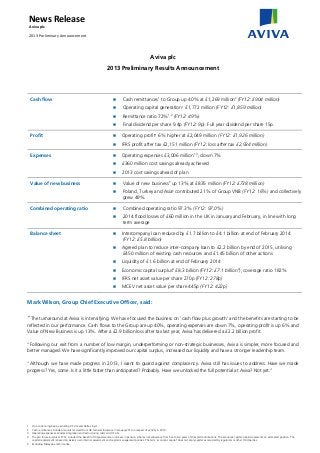
  • 1.   News Release Aviva plc   2013 Preliminary Announcement  Aviva plc 2013 Preliminary Results Announcement Cash flow Cash remittances1 to Group up 40% at £1,269 million2 (FY12: £904 million) Operating capital generation1 £1,772 million (FY12: £1,859 million) Remittance ratio 72%1,2 (FY12: 49%) Final dividend per share 9.4p (FY12: 9p). Full year dividend per share 15p. Profit Operating profit1 6% higher at £2,049 million (FY12: £1,926 million) IFRS profit after tax £2,151 million (FY12: loss after tax £2,934 million) Expenses Operating expenses £3,006 million1,3, down 7% £360 million cost savings already achieved 2013 cost savings ahead of plan Value of new business Value of new business5 up 13% at £835 million (FY12: £738 million) Poland, Turkey and Asia5 contributed 21% of Group VNB (FY12: 16%) and collectively grew 49% Combined operating ratio Combined operating ratio 97.3% (FY12: 97.0%) 2014 flood losses of £60 million in the UK in January and February, in line with long term average Balance sheet Intercompany loan reduced by £1.7 billion to £4.1 billion at end of February 2014 (FY12: £5.8 billion) Agreed plan to reduce inter-company loan to £2.2 billion by end of 2015, utilising £450 million of existing cash resources and £1.45 billion of other actions Liquidity of £1.6 billion at end of February 2014 Economic capital surplus4 £8.3 billion (FY12: £7.1 billion4), coverage ratio 182% IFRS net asset value per share 270p (FY12: 278p) MCEV net asset value per share 445p (FY12: 422p) Mark Wilson, Group Chief Executive Officer, said: “The turnaround at Aviva is intensifying. We have focused the business on ‘cash flow plus growth’ and the benefits are starting to be reflected in our performance. Cash flows to the Group are up 40%, operating expenses are down 7%, operating profit is up 6% and Value of New Business is up 13%. After a £2.9 billion loss after tax last year, Aviva has delivered a £2.2 billion profit. “Following our exit from a number of low margin, underperforming or non-strategic businesses, Aviva is simpler, more focused and better managed. We have significantly improved our capital surplus, increased our liquidity and have a stronger leadership team. “Although we have made progress in 2013, I want to guard against complacency. Aviva still has issues to address. Have we made progress? Yes, some. Is it a little faster than anticipated? Probably. Have we unlocked the full potential at Aviva? Not yet.” 1 2 3 4 5 On a continuing basis, excluding US Life and Delta Lloyd Cash remittances include amounts received from UK General Insurance in January 2014 in respect of activity in 2013. Operating expenses excludes integration and restructuring costs and US Life The pro forma surplus at FY12 included the benefit of disposals and an increase in pension scheme risk allowance from five to ten years of stressed contributions. The economic capital surplus represents an estimated position. The capital requirement is based on Aviva’s own internal assessment and capital management policies. The term ‘economic capital’ does not imply capital as required by regulators or other third parties. Excluding Malaysia and Sri Lanka.
  • 2. Aviva plc 2013 Preliminary Announcement Key financial metrics Cash Cash remitted to Group Operating capital generation Continuing operations, excluding Delta Lloyd 2013 £m 2012 £m Sterling% change 2013 £m Restated1 2012 £m Sterling% change United Kingdom & Ireland Life United Kingdom & Ireland general insurance & health2 Europe Canada Asia and Other 370 347 388 130 34 150 150 343 136 125 147% 131% 13% (4)% (73)% 595 374 558 177 68 688 376 571 192 32 (14)% (1)% (2)% (8)% 113% 1,269 904 40% 1,772 1,859 (5)% Total Operating profit: IFRS basis Continuing operations, excluding Delta Lloyd 2013 £m Restated1 2012 £m Life business General insurance and health Fund management Other* 1,901 797 93 (742) 1,831 894 51 (850) Total 2,049 1,926 * Sterling% change 4% (11)% 82% 13% 6% Includes other operations, Corporate Centre costs and Group debt and other interest costs. Expenses 2013 £m 2012 £m Sterling% change Operating expenses Integration & restructuring costs 3,006 363 3,234 461 (7)% (21)% Expense base 3,369 3,695 (9)% Continuing operations 2013 £m 2012 £m Sterling % change United Kingdom Ireland France Poland Italy Spain Turkey & Other Europe Asia – excluding Malaysia & Sri Lanka 435 6 166 51 15 33 38 91 420 (8) 119 35 29 56 32 55 Value of new business – excluding Malaysia & Sri Lanka 835 738 13% 1 8 (88)% 836 746 12% Continuing operations Value of new business Malaysia & Sri Lanka Value of new business 4% 175% 39% 46% (48)% (41)% 19% 65% General insurance combined operating ratio Continuing operations 2013 2012 Change United Kingdom & Ireland Europe Canada 97.2% 98.1% 94.6% 98.6% 99.4% 93.4% (1.4)pp (1.3)pp 1.2pp General insurance combined operating ratio 97.3% 97.0% 0.3pp 2013 £m 2012 £m Sterling% change IFRS Profit after tax IFRS profit/(loss) after tax 2,151 (2,934) n/a Dividend 2013 2012 9.4p 15.0p 9.0p 19.0p 2013 £bn 2012 £bn Pro forma4 2012 £bn Estimated economic capital surplus3 8.3 5.3 7.1 Estimated IGD solvency surplus3 3.6 3.8 3.9 IFRS net asset value per share MCEV5 net asset value per share 270p 445p 278p 422p Final dividend Total dividend per share Capital position 1 2 3 4 5 The Group adopted the amendments to IAS19 and IFRS10 during the period and the requirements of the revised standards have been applied retrospectively. Cash remittances include amounts received from Aviva Insurance Limited in January 2014 in respect of 2013 activity. The economic capital surplus and IGD solvency surplus represent an estimated position. The economic capital requirement is based on Aviva’s own internal assessment and capital management policies. The term ‘economic capital’ does not imply capital as required by regulators or other third parties. The pro forma economic capital and IGD surplus at FY12 includes the benefit of completing the US Life, Aseval, Delta Lloyd and Malaysia transactions and, for economic capital only, an increase in pension scheme risk allowance from five to ten years of stressed contributions. In preparing the MCEV information, the directors have done so in accordance with the European Insurance CFO Forum MCEV Principles with the exception of stating held for sale operations at their expected fair value, as represented by expected sale proceeds, less cost to sell.
  • 3. Aviva plc 2013 Preliminary Announcement Overview Group Chief Executive Officer’s Report The turnaround at Aviva is intensifying. We have focused the business on ‘cash flow plus growth’ and are beginning to see the benefits of this reflected in our performance. Cash flows are up 40%, operating expenses are down 7%, operating profit is up 6% and Value of New Business is up 13%. After a £2.9 billion loss after tax last year, Aviva has delivered a £2.2 billion profit after tax. To deliver our investment thesis of cash flow plus growth we need to be financially robust. In 2013, we increased economic capital surplus from £7.1 billion1 to £8.3 billion and liquidity at the Group Centre has increased significantly to £1.6 billion at the end of February 2014. With reference to earnings and cash flow improvements, the Board has proposed a 9.4p dividend. Reducing the inter-company loan has been a key priority in 2013. Over the past 12 months, we have reduced the loan by £1.7 billion to £4.1 billion2. We have agreed a comprehensive plan to reduce the inter-company loan to £2.2 billion, utilising £450 million of existing cash resources and £1.45 billion of other actions. We have reached agreement with the Prudential Regulation Authority (“PRA”) and I believe the execution of this plan will take the issue of our inter-company loan off the table. We have also completed significant disposals in the US, Aseval in Spain, Malaysia, Netherlands and announced a disposal in Italy. I believe Aviva is now more focused and better managed. Aviva has an extraordinary depth of talented people who understand the core insurance businesses and this depth means we have strong core underwriting businesses. Nevertheless, we needed to strengthen some aspects of our skill set and since the start of 2013, Aviva’s senior management pool has been deepened with key appointments in finance, asset management, human resources, IT and transformation, together with numerous internal promotions. Although we have made progress in 2013, turnarounds are rarely linear and the improving results should be tempered by the realism that the business still has issues to address and is performing nowhere near its full potential. Cash flow Cash remitted to Group of £1,269 million3 up 40% 72% remittance ratio (FY12: 49%) Operating profit Operating profit: £2,049 million, up 6% The first part of our ‘cash flow plus growth’ investment thesis is to convert more of our profits into cash remitted to Group. Higher cash remittances allow for optimal capital allocation and dividend flexibility. In 2013, cash remittances were £1,269 million3, a 40% increase over the 2012 comparative. This represents a remittance ratio of 72% of operating capital generation (OCG) and is progress towards my ambition to get the remittance ratio above 80%. Our cash generators, UK, France and Canada, generated a 59% increase in cash remittances, making up 80% of the total cash remitted to Group. Following the resumption of dividends from Ireland and Italy, all our turnaround businesses are now remitting cash to Group. 2013 operating profit increased 6% to £2,049 million (FY12: £1,926 million). The stability of our profit stream underlines our ‘cash flow plus growth’ investment proposition. After a £2.9 billion loss last year principally due to the write-down of Aviva USA, our profit after tax increased to £2.2 billion. While satisfactory at a Group level, there remain a number of opportunities to improve our operating profit. Declines in our Italian and Spanish life businesses need to be reversed and our growth markets need over time to contribute more to operating profit. Aviva Investors grew its fund management contribution 74%, but at around 3% of group operating profit and with assets under management of £241 billion, this remains inadequate. Plans are in place to address these issues over the coming years and Euan Munro brings much needed leadership and impetus to Aviva Investors.   1 2 3 The pro forma surplus at FY12 included the benefit of disposals and an increase in pension scheme risk allowance from five to ten years of stressed contributions. At end of February 2014. Includes £347 million remitted by UK General Insurance in January 2014 in respect of activity in 2013.
  • 4. Aviva plc 2013 Preliminary Announcement Expenses Operating expenses £360 million lower than 2011 baseline at £3,006 million Group Chief Executive Officer’s Report continued Our 2013 operating expense base is now 11% below the 2011 baseline with £360 million of expense reductions coming through operating profit. We are well on track to deliver our £400 million expense reduction target by the end of 2014. There remains significant opportunity to reduce expenses further but some of these additional savings will be reallocated in the near term towards initiatives to manage our existing books of business more efficiently and serve customers more effectively through deploying the latest digital and automation technology. I am confident that whatever reallocation is made will produce attractive returns and a short payback period, without significant disruption to our workforce. Going forward, we will measure our expense efficiency using a ratio of operating expenses to revenue. The group expense ratio for 2013 is 54% (FY12: 57%). Lower expense ratios are essential for us to offer competitive products to our customers and to produce the necessary returns for our shareholders. It is my intention to show improvement in this ratio year after year. Value of new business VNB4 up 13% to £835 million We measure our growth in life insurance by growth in value of new business (VNB), which is a good proxy for future cash flows. In 2013, VNB4 increased 13% to £835 million (FY12: £738 million) with stand-out performances in France and our growth markets. Our life cash-generators in the UK and France grew VNB 4% and 39% respectively. We have achieved this through better product and business mix and we have initiatives underway to increase productivity in both countries. France in particular, has demonstrated that significant growth is possible in mature markets. We have made a number of structural changes to our turnaround businesses - such as reducing the capital intensity of our Italian business - that should ensure more focus and better VNB growth. Our future cash generators of Poland, Turkey, China and Asia4 contributed 21% of Group VNB (FY12: 16%) and collectively grew 49%. Our new joint venture in Indonesia is an example of how we can expand our presence in emerging markets, without impacting the cash flow part of our investment thesis. Combined operating ratio COR at 97.3%   4 Excluding Malaysia and Sri Lanka.   In general insurance, the combined operating ratio (COR) deteriorated slightly to 97.3% (FY12: 97.0%), entirely due to adverse weather in the year. Floods in Alberta and Toronto Canada cost the Group £129 million and the December storms in the UK had a £60 million operating profit impact, although the impact of the UK storms was offset by better than expected weather earlier in the year. Bad weather in the UK has persisted in January and February 2014 with claims of approximately £60 million recorded. However, this is broadly in line with our weather expectations for January and February. Our overriding focus is to help our customers affected by the bad weather and our teams of loss adjustors, surveyors and claims experts – the largest in the UK - have been on hand 7 days a week, offering advice and support.
  • 5. Group Chief Executive Officer’s Report continued Aviva plc 2013 Preliminary Announcement Financial strength Economic capital surplus1 £8.3 billion Inter-company loan reduced by £1.7 billion to £4.1 billion2 Strengthening our financial position has been a focus in 2013. Our economic capital surplus has increased to £8.3 billion, which represents a 182% coverage ratio and includes our defined benefit pension on a more conservative fully-funded basis. We welcome the progress made by our regulators on Solvency II and the level playing field that this is likely to create. Over the last 12 months there has been substantial focus on the intercompany loan (ICL) and 2013 has seen considerable progress in this area. As at the end of February 2014, the ICL was £4.1 billion (Q1 2013: £5.8 billion), reduced by a cash contribution of £0.45 billion and non-cash measures of £1.25 billion. We have reached agreement with the PRA on the appropriate level and plans for the ICL and will complete implementation of our plans by the end of 2015. Our target level for the loan is £2.2 billion. We plan on using a further £0.45 billion of cash and £1.45 billion of other measures to achieve the £2.2 billion target. The cash is to come from existing liquidity, putting no extra strain on our ongoing cash generation. Our external leverage ratio is at 50% (FY12: 50%) of IFRS tangible capital. On a more broadly recognised S&P basis, this ratio has reduced to 32% (FY12: 33%). We have recently stated our intention to call two tranches of bonds, with principal of £240 million and coupon above 10%. Over time we expect to reduce our external leverage ratio to below 40% of tangible capital. One of the priorities in 2013 was to strengthen the management team to bring in new skills into the group and progress has been made in this area. We have appointed new leaders in asset management, human resources, IT, Europe, Asia, UK General Insurance and transformation through a combination of senior internal promotions and external hires. People I would like to thank Pat Regan for his many contributions to the Group over the past four years and in particular for his support of me over the past year. I wish him well in his future career in Australia. We have announced that Tom Stoddard will succeed Pat as CFO. Tom is a high calibre individual who will provide sound judgement and challenge. An essential part of the company’s transformation is embedding a higher performance culture across Aviva. We are introducing a new set of values which will guide the day to day actions of our 28,000 people. These values provide the framework on which decisions are being made. These values are: Create Legacy, Kill Complexity, Never Rest and Care More. One of the strengths of Aviva is the dedication and commitment of our people. This has been exemplary in 2013 and I would like to thank them for their tireless work on behalf of our customers and shareholders. Outlook In summary, our performance in 2013 shows progress towards delivering what we said we would. Our turnaround is intensifying as we focus more on improving operational performance. We plan on using big data to be more disruptive in predictive analytics, take advantage of our brand strength to grow our digital direct business and drive further efficiency through automation. We will be selective in our investments with a clinical approach to the allocation of capital. As a business it is important that we build on the progress made in 2013. Aviva is a self-help story with a balanced and increasingly focused portfolio of businesses. The tendency with self help or turnaround businesses is to focus on the successes rather than the issues and as a result become complacent. I want to guard against this happening at Aviva. Have we made progress? Yes, some. Is it a little faster than anticipated? Probably. Have we unlocked the full potential at Aviva? No, there is more to come. Mark Wilson, Group Chief Executive Officer   1 The economic capital surplus represents an estimated position. The capital requirement is based on Aviva’s own internal assessment and capital management policies. The term ‘economic capital’ does not imply capital as required by regulators or other third parties. 2 At the end of February 2014.  
  • 6. Aviva plc 2013 Preliminary Announcement Group Chief Financial Officer’s     Overview   2013 was a year in which the financial position of the group improved, cash flow and earnings were higher and we finalised a plan to reduce the inter-company loan to a sustainable level by the end of 2015. We have sharpened the focus of the group, completing disposals of our US insurance business, remaining holding in Delta Lloyd, Aseval in Spain and Malaysian business. In addition, we have announced the disposal of our 39% stake in Italian insurer Eurovita. The financial strength of the group has improved significantly. At the end of 2013, our economic capital surplus increased to £8.3 billion from a pro forma surplus of £7.1 billion at FY12. Our IGD surplus has reduced modestly to £3.6 billion (FY12: £3.8 billion) and group liquidity was £1.6 billion at the end of February 2014. During the year we have increased cash remittances 40% to £1,269 million (FY12: £904 million), representing a remittance ratio of 72% of operating capital generation. As we continue to make progress resolving our balance sheet issues, our focus will shift to improving performance. In this area progress has already been made, particularly in improving expense and capital efficiency.     Business Unit Performance  In UK life, our largest business, life operating profit grew 5%, operating expenses were 16% lower, remittances doubled and value of new business (VNB) was 4% higher. The VNB growth came despite the difficult comparator in the fourth quarter of 2012, when annuity sales were elevated ahead of the gender directive implementation. The business has adapted well to the retail distribution review (RDR), with strong net flows in our platform and SME-focused corporate pensions offering. Individual protection sales are lower however, as banks have pulled back from advised selling. Going forward, we expect to capitalise on our market leading position in annuities, benefit from a partial rebound in protection sales in the bancassurance channel and extract greater efficiency from our back book. Our UK general insurance business (“UK GI”) grew its underwriting result to £117 million (FY12: £48 million) and the combined operating ratio improved to 97% (FY12: 98.3%). Despite a stormy end to 2013, the UK results benefitted from relatively benign weather over the whole year. Remittances from UK GI in respect of 2013 increased to £347 million primarily due to the simplified legal entity structure and the restructure of the internal loan. A lower long-term investment result (LTIR) of 3.2% on average assets (FY12: 4.2%) brought down the UK GI operating profit to £431 million (FY12: £459 million). This lower investment return is primarily due to a reduced interest rate on the inter-company loan, which although it impacts the results of the UK GI business, is offset at Group by lower internal interest costs. The LTIR is expected to continue reducing as we bring down the inter-company loan. Personal motor, home and commercial property all achieved improved combined operating ratios. Total commercial COR was 102.9% (FY12: 104.0%). Within this, large commercial lines business drove an 11 percentage point improvement in the commercial property COR. However, our commercial motor COR deteriorated 6 percentage points due to unfavourable prior year development. Our French life business had a particularly strong year. Operating profit was up 15%, value of new business up 39%, and cash remittances up 16%. Although our overall market share is relatively modest, we have an attractive distribution offering with a large owned sales network and existing key partnerships including AFER, the largest savers’ association in Europe. This has seen us accumulate over €80 billion of assets, which generate a stable revenue stream. Much of the success of 2013 has come from a shift in focus away from capital intensive savings products to unit-linked and protection products. Our Canadian general insurance business, the second largest in the market, produced a solid result, despite the higher weather losses from floods in Alberta and Toronto. The combined operating ratio in Canada was 94.6% (FY12: 93.4%), with personal lines primarily affected by bad weather with a COR of 93.3% (FY12: 90.5%). Improvement in commercial lines is, in part, attributable to the early stages of the implementation of predictive analytics.
  • 7. Group Chief Financial Officer’s Report continued Aviva plc 2013 Preliminary Announcement In the growth markets of Poland, Turkey and Asia, VNB improved by 46%, 23% and 65%5 respectively and collectively contributed 21% of total Group VNB. As previously communicated, the partial nationalisation of the Polish pensions market will have negligible impact on our growth prospects. In addition to strong new business growth, Poland remitted £85 million in cash to group. In Asia, in addition to achieving strong growth in Singapore and China we have also established a joint venture with Astra International, Indonesia’s largest conglomerate, which we expect to fuel future growth. Our focus in growth markets remains in life businesses. Progress has been made in our turnaround businesses of Italy, Spain and Ireland, although there remains significant room for improvement. In Spain and Italy we are moving our product mix away from more capital intensive savings products towards unit-linked and protection products. We have resumed dividend payments from Italy and Ireland. The turnaround at Aviva Investors is, as previously communicated, likely to take time. The business had assets under management at FY13 of £241 billion with £5 billion of net outflows experienced in the year. In 2013, we found evidence of improper allocation of trades in fixed income securities in Aviva Investors by two former employees. This occurred prior to 2013. The relevant regulatory authorities have been notified. A thorough review of internal control processes relating to the dealing policy has been carried out by management and reviewed by PwC. Measures to improve controls have been implemented. There is a total adverse impact on operating profit from this activity of £132 million. We are taking steps to ensure that customers will not ultimately be disadvantaged as a result of these breaches of the dealing policy. The above costs are included in other operations and the impact of this cost is offset by a gain from the curtailment of the Irish pension scheme.   Capital and liquidity Our FY2013 economic capital surplus is £8.3 billion with a coverage ratio of 182% (FY12: pro forma £7.1 billion). This includes the impact of moving the pension scheme calibration to a fully funded basis, which reduced the surplus by approximately £0.7 billion. We have increased the economic capital surplus during the year by a combination of product mix changes, capital allocation, asset optimisation, hedging, expense reductions and completion of disposals. Economic capital is our preferred measure of capitalisation, especially in anticipation of a transition to Solvency II. Our IGD surplus has reduced modestly to £3.6 billion (FY12: £3.8 billion), with positive capital generation more than offset by the reduction in value of in force as a result of the legislation changes to Polish pensions. In 2013 we were included on the list of nine Global Systemically Important Insurers and will work closely with the regulators to understand the implications of this. Cash remittances have increased by 40% from 2012 to £1,269 million with a remittance ratio of 72% of OCG up from 49% in 2012 with both business units in the UK reporting large increases. In UK Life this was due to improved pricing, capital allocation and cost reductions, while in UK GI the improvement was primarily due to the restructure of the inter-company loan. It was also encouraging to see dividends resume from Italy and Ireland and increased dividends from France and Poland. The £1.3 billion of remittances are used to fund the dividend, internal and external interest payments along with central costs resulting in a neutral centre operating cash flow in 2013, improving from a deficit in 2012. Group centre liquidity currently stands at £1.6 billion following the receipts from the disposals of Aviva USA, Delta Lloyd and Aseval amongst others.   5 Excluding Malaysia and Sri Lanka.  
  • 8. Aviva plc 2013 Preliminary Announcement Inter-company loan Group Chief Financial Officer’s Report continued As part of the structural reorganisation of the group we moved a number of businesses from the UK GI legal entity (“AIL6”) to be owned by Aviva Group Holdings (“AGH”). These businesses were paid for by way of an inter-company loan by AIL to AGH of £5.8 billion. Since then, we have reduced the loan balance by £1.7 billion to £4.1 billion at the end of February 2014 by repaying £450 million in cash and we have also taken actions to reduce the required capital in AIL, which has allowed us to retire a further £1.25 billion of the internal loan. We have agreed with the Prudential Regulation Authority (“PRA”) the appropriate long term level of the internal loan between AGH and AIL. That level has been set such that AIL places no reliance on the loan to meet its stressed insurance liabilities assessed on a 1:200 basis. The PRA agree with this approach. The effect of this will be to reduce the internal loan balance from its current level of £4.1 billion to approximately £2.2 billion. We will complete this reduction by the end of 2015. We plan to achieve our £2.2 billion targeted balance through a further cash repayment of £450 million along with other actions that will bring the loan balance down by £1.45 billion. These planned actions include the funding and de-risking of our pension scheme, along with more effective use of internal reinsurance and other actions to reduce stressed liabilities. We expect the future cash repayment to be funded from our existing central cash balance and future disposal proceeds. We do not expect these actions to have a material adverse impact on group profitability. Our overall plan to reduce the loan balance to £2.2 billion has been reviewed and agreed by the PRA. External leverage External leverage remains broadly unchanged in 2013, with a debt to tangible equity ratio of 50% (FY12: 50%). On an S&P basis, our leverage ratio is 32%. In February 2014, we announced our intention to call a £200 million 10.6725% and a €50 million 10.464% hybrid bond on their respective April 2014 call dates. We remain committed to achieving a debt to tangible capital ratio of below 40% over the medium term, and below 30% on an S&P basis, consistent with a AA rating.     6 Aviva Insurance Limited  
  • 9. Group Chief Financial Officer’s Report continued Aviva plc 2013 Preliminary Announcement     Net Asset Value Our 2013 MCEV book value per share increased 5% to 445p, primarily due to operating earnings, the effect of the US disposal and positive investment variances, being partially offset by dividend payments, IAS19 pension movements, and integration and restructuring costs. The IFRS book value declined 3%, primarily due to movement in the IAS19 position of our pension schemes and in the first half of 2013, we increased the provision for default in our commercial mortgage portfolio by £300 million. These reductions more than offset positive contributions from operating profit and higher proceeds from the US disposal. Net asset value7 Opening NAV per share at 31 December 2012 Operating profit Effect of US disposal Dividends & appropriations Investment variances including commercial mortgage provision increase Pension schemes Integration and restructuring costs, goodwill impairment and other Foreign exchange movements Closing NAV per share at 31 December 2013 Pat Regan Group Chief Financial Officer   7 Net of tax and non-controlling interests   IFRS 278p 53p 6p (18)p (14)p (19)p (14)p (2)p 270p MCEV 422p 55p 6p (18)p 18p (19)p (16)p (3)p 445p
  • 10. Aviva plc 2013 Preliminary Announcement Notes to editors Notes to editors All comparators are for the full year 2012 position unless otherwise stated. Income and expenses of foreign entities are translated at average exchange rates while their assets and liabilities are translated at the closing rates on 31 December 2013. The average rates employed in this announcement are 1 euro = £0.85 (12 months to 31 December 2012: 1 euro = £0.81) and US$1 = £0.64 (12 months to 31 December 2012: 1 US$ = £0.63). Growth rates in the press release have been provided in sterling terms unless stated otherwise. The following supplement presents this information on both a sterling and local currency basis. Cautionary statements: This should be read in conjunction with the documents filed by Aviva plc (the “Company” or “Aviva”) with the United States Securities and Exchange Commission (“SEC”). This announcement contains, and we may make verbal statements containing, “forward-looking statements” with respect to certain of Aviva’s plans and current goals and expectations relating to future financial condition, performance, results, strategic initiatives and objectives. Statements containing the words “believes”, “intends”, “expects”, “plans”, “will,” “seeks”, “aims”, “may”, “could”, “outlook”, “estimates” and “anticipates”, and words of similar meaning, are forwardlooking. By their nature, all forward-looking statements involve risk and uncertainty. Accordingly, there are or will be important factors that could cause actual results to differ materially from those indicated in these statements. Aviva believes factors that could cause actual results to differ materially from those indicated in forward-looking statements in the presentation include, but are not limited to: the impact of ongoing difficult conditions in the global financial markets and the economy generally; the impact of various local political, regulatory and economic conditions; market developments and government actions regarding the sovereign debt crisis in Europe; the effect of credit spread volatility on the net unrealised value of the investment portfolio; the effect of losses due to defaults by counterparties, including potential sovereign debt defaults or restructurings, on the value of our investments; changes in interest rates that may cause policyholders to surrender their contracts, reduce the value of our portfolio and impact our asset and liability matching; the impact of changes in equity or property prices on our investment portfolio; fluctuations in currency exchange rates; the effect of market fluctuations on the value of options and guarantees embedded in some of our life insurance products and the value of the assets backing their reserves; the amount of allowances and impairments taken on our investments; the effect of adverse capital and credit market conditions on our ability to meet liquidity needs and our access to capital; a cyclical downturn of the insurance industry; changes in or inaccuracy of assumptions in pricing and reserving for insurance business (particularly with regard to mortality and morbidity trends, lapse rates and policy renewal rates), longevity and endowments; the impact of catastrophic events on our business activities and results of operations; the inability of reinsurers to meet obligations or unavailability of reinsurance coverage; increased competition in the UK and in other countries where we have significant operations; the effect of the European Union’s “Solvency II” rules on our regulatory capital requirements; the impact of actual experience differing from estimates used in valuing and amortising deferred acquisition costs (“DAC”) and acquired value of in-force business (“AVIF”); the impact of recognising an impairment of our goodwill or intangibles with indefinite lives; changes in valuation methodologies, estimates and assumptions used in the valuation of investment securities; the effect of legal proceedings and regulatory investigations; the impact of operational risks, including inadequate or failed internal and external processes, systems and human error or from external events; risks associated with arrangements with third parties, including joint ventures; funding risks associated with our participation in defined benefit staff pension schemes; the failure to attract or retain the necessary key personnel; the effect of systems errors or regulatory changes on the calculation of unit prices or deduction of charges for our unit-linked products that may require retrospective compensation to our customers; the effect of a decline in any of our ratings by rating agencies on our standing among customers, broker-dealers, agents, wholesalers and other distributors of our products and services; changes to our brand and reputation; changes in government regulations or tax laws in jurisdictions where we conduct business; the inability to protect our intellectual property; the effect of undisclosed liabilities, integration issues and other risks associated with our acquisitions; and the timing impact and other uncertainties relating to acquisitions and disposals and relating to other future acquisitions, combinations or disposals within relevant industries. For a more detailed description of these risks, uncertainties and other factors, please see Item 3d, “Risk Factors”, and Item 5, “Operating and Financial Review and Prospects” in Aviva’s Annual Report Form 20-F as filed with the SEC on 25 March 2013. Aviva undertakes no obligation to update the forward looking statements in this announcement or any other forward-looking statements we may make. Forward-looking statements in this presentation are current only as of the date on which such statements are made. Aviva plc is a company registered in England No. 2468686. Registered office St Helen's 1 Undershaft London EC3P 3DQ Contacts Investor contacts Media contacts Timings Colin Simpson +44 (0)20 7662 8115 Nigel Prideaux +44 (0)20 7662 0215 David Elliot +44 (0)20 7662 8048 Andrew Reid +44 (0)20 7662 3131 Results and presentation slides 06:30 hrs GMT www.aviva.com Sarah Swailes +44 (0)20 7662 6700 Real time media conference call 07:30 hrs GMT Analyst presentation 08.30 hrs GMT Live webcast 08:30 hrs GMT www.avivawebcast.com/prelim2013/