R Tool for Visual Studio และการทำงานร่วมกันเป็นทีม โดย เฉลิมวงศ์ วิจิตรปิยะกุล MVP, Microsoft Thailand
•
2 recomendaciones•844 vistas

R Tool for Visual Studio และการทำงานร่วมกันเป็นทีม โดย เฉลิมวงศ์ วิจิตรปิยะกุล MVP, Microsoft Thailand THE FIRST NIDA BUSINESS ANALYTICS AND DATA SCIENCES CONTEST/CONFERENCE

Recomendados
Recomendados
Más contenido relacionado
La actualidad más candente
La actualidad más candente (20)
Destacado
Destacado (13)
Similar a R Tool for Visual Studio และการทำงานร่วมกันเป็นทีม โดย เฉลิมวงศ์ วิจิตรปิยะกุล MVP, Microsoft Thailand
Similar a R Tool for Visual Studio และการทำงานร่วมกันเป็นทีม โดย เฉลิมวงศ์ วิจิตรปิยะกุล MVP, Microsoft Thailand (20)
Más de BAINIDA
Más de BAINIDA (20)
Último
Último (20)
R Tool for Visual Studio และการทำงานร่วมกันเป็นทีม โดย เฉลิมวงศ์ วิจิตรปิยะกุล MVP, Microsoft Thailand
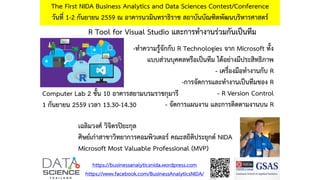
- 1. R Tool for Visual Studio และการทางานร่วมกันเป็นทีม The First NIDA Business Analytics and Data Sciences Contest/Conference วันที่ 1-2 กันยายน 2559 ณ อาคารนวมินทราธิราช สถาบันบัณฑิตพัฒนบริหารศาสตร์ -ทาความรู้จักกับ R Technologies จาก Microsoft ทั้ง แบบส่วนบุคคลหรือเป็นทีม ได้อย่างมีประสิทธิภาพ - เครื่องมือทางานกับ R -การจัดการและทางานเป็นทีมของ R - R Version Control - จัดการแผนงาน และการติดตามงานบน R https://businessanalyticsnida.wordpress.com https://www.facebook.com/BusinessAnalyticsNIDA/ เฉลิมวงศ์ วิจิตรปิยะกุล ศิษย์เก่าสาขาวิทยาการคอมพิวเตอร์ คณะสถิติประยุกต์ NIDA Microsoft Most Valuable Professional (MVP) Computer Lab 2 ชั้น 10 อาคารสยามบรมราชกุมารี 1 กันยายน 2559 เวลา 13.30-14.30
- 3. What is R? Language Platform Community Ecosystem • A programming language for statistics, analytics, and data science • A data visualization framework • Provided as Open Source • Used by 2.5M+ data scientists, statisticians and analysts • Taught in most university statistics programs • Active and thriving user groups across the world • CRAN: 7000+ freely available algorithms, test data and evaluation • Many of these are applicable to big data if scaled • New and recent graduates prefer it
- 4. 20152009200420032000199719951993 Research Project in New Zealand Open Source Project R-Core Group R-1.0.0 released R Foundation First user New York Times article R-3.2.0 and R Consortium (founded by Microsoft) History of R
- 6. Datasize In-memory In-memory In-Memory or Disk Based Speed of Analysis Single threaded Multi-threaded Multi-threaded, parallel processing 1:N servers Support Community Community Community + Commercial Analytic Breadth & Depth 7500+ innovative analytic packages 7500+ innovative analytic packages 7500+ innovative packages + commercial parallel high-speed functions Licence Open Source Open Source Commercial license. Supported release with indemnity CRAN, MRO, MRS Comparison Microsoft R Open Microsoft R Server
- 7. $? Challenges posed by open source R Uncertain total cost of ownership Inadequate access to important business data Limited business agility Limited business value
- 8. R from Microsoft brings
- 9. Naïve Bayes Data import – Delimited, Fixed, SAS, SPSS, OBDC Variable creation & transformation Recode variables Factor variables Missing value handling Sort, Merge, Split Aggregate by category (means, sums) Min / Max, Mean, Median (approx.) Quantiles (approx.) Standard Deviation Variance Correlation Covariance Sum of Squares (cross product matrix for set variables) Pairwise Cross tabs Risk Ratio & Odds Ratio Cross-Tabulation of Data (standard tables & long form) Marginal Summaries of Cross Tabulations Chi Square Test Kendall Rank Correlation Fisher’s Exact Test Student’s t-Test Subsample (observations & variables) Random Sampling Data Step Statistical Tests Sampling Descriptive Statistics Sum of Squares (cross product matrix for set variables) Multiple Linear Regression Generalized Linear Models (GLM) exponential family distributions: binomial, Gaussian, inverse Gaussian, Poisson, Tweedie. Standard link functions: cauchit, identity, log, logit, probit. User defined distributions & link functions. Covariance & Correlation Matrices Logistic Regression Classification & Regression Trees Predictions/scoring for models Residuals for all models Predictive Models K-Means Decision Trees Decision Forests Gradient Boosted Decision Trees Cluster Analysis Classification Simulation Variable Selection Stepwise Regression Simulation (e.g. Monte Carlo) Parallel Random Number Generation Combination New in v7.3 PEMA-R API rxDataStep rxExec Coming in v7.4
- 13. Outperforming teams are 54% more likely to Developers 26.7% No executive support 56.7% Cultural inhibitors 43.3% Fragmented processes Collaboration blockers DevOps was being initiated by more development teams than IT Ops teams by about a 40% to 33% margin Agile methodologieshave adopted 3/4 of teams BusinessIT Ops The average hourly cost of infrastructure failure is $100,000 per hour It takes on average 200 minutes to diagnose and repair a production issue A bug caught in production ends up costing than if the same bug was found earlier in the development cycle 100x more IT decision makers is still unfamiliar with the term DevOps 61 in 40% … of implementations end up getting reworked because they don’t meet the users’ original requirements … of development budgets for software, IT staff and external professional services will be consumed by poor requirements 41% IT drives business success! High IT performance correlates with strong business performance, helps boost productivity, market share and profit. Responding to ongoing needs for efficiency and growth Always keeping all systems safe and secure dual goals … for companies that try to adapt their existing tools for DevOps practices 80% failure rate … CIOs 70 % to reduce IT costs Would increase risk and accelerate business agility of
- 15. Code Repository Backlog Build + Deploy Monitor and improve Automated Testing User Feedback Visual Studio Team Services
- 16. ALM + DevOps practices New trend of practices for increasing flow of value to customers Backlog Requirements Plan Develop + test Release Monitor + learn Important for enterprises to understand to improve DevOps extends application lifecycle management (ALM) investments
- 17. End-to-end DevOps Plan + Track 1 Monitor + Learn ReleaseDevelop + Test 2 Development Production 4 3
- 18. Plan Manage work Track progress Develop + Test 1 Project starts It starts with an idea - and a plan how to turn this idea into reality… Plan + Track
- 19. Write Code Unit Testing 2 Build Version Control Build Verification Release After the iteration starts, developers turn great ideas into features and functionality … Develop + Test