SlideShare una empresa de Scribd logo
1 de 1
Legume-based fallows for restoring the community of soil macro-
                                                       invertebrates in semi-deciduous forest areas of Côte d’Ivoire
                                                                            Arnauth M. GUEI1*, Armand W. KONE1, Jérome TONDOH 2, Pascal K.T. ANGUI1 , Yao Tano3
                                                                                            1Université d’Abobo-Adjamé, 02 BP 801 Abidjan 02, Côte d’Ivoire
                                                                      2CIAT-TSBF, Institut d’Economie Rurale, CRRA de Sotuba, Laboratoire Sol-Eau-Plante, BP 262 Bamako, Mali
                                                                                              3Université de Cocody , 22 B.P. 582 Abidjan 22, Côte d’Ivoire

                                                                                                                                                                            * E-mail:gueiarnauthmartinez@yahoo.fr
               Conservation and Sustainable Management of
               Below Ground Biodiveristy


  Introduction
  Soils house scores of organisms diverse in both the number of species recorded and the roles that they play in the
  ecosystem (Lavelle et al., 2004). Soil macrofauna, such as earthworms, have a high potential to be used as bioindicators
  of soil quality, as they are in direct contact with the soil. They allow for a sound assessment of environmental hazards
  (Lavelle & Spain, 2001). Thus, the management of soil fauna must not be ignored in promoting sustainable agriculture
  (Brussaard et al., 2007). The use of legumes to improve fallows is in total agreement with that of soil macro-
  invertebrates, as this can greatly contribute to soil organic matter conservation and cover through an abundant production
  of litter which is a food source for soil-born organisms (Lavelle et al., 2003; Koné et al., 2008).
  Objective
  The study aims to determine the potential of soil macro-invertebrates, especially earthworms as indicators of soil                                                                                                                                                                        Natural fallow                             Mucuna pruriens variety utilis
  biodiversity restoration in legume-based fallows.

  Experimental plots and soil macrofauna sampling
  The study was carried out in a semi-deciduous forest margin in mid-West Côte d’Ivoire (6° 30’N, 5° 31’W). Sampling for
  soil macrofauna was done in experimental plots installed for legume and foodcrop trials, in the benchmark site. They were
  concerned with 3 types of fallow-based legume crops of short duration (Mucuna pruriens var utilis, Cajanus cajan and
  Pueraria phaseoloides). There were 4 plots of Cajanus cajans and 4 plots of Pueraria phaseoloides, while Mucuna
  pruriens was grown in only one plot. Each plot was divided into two subplots of 25 x 25m. One subplot was planted with
  one legume species and the other subplot consisted in a natural fallow (check). Three soil monoliths (25 x 25 x 20 cm)                                                                                                                                                                    Cajanus cajan                                Pueraria phaseoloides
  were randomly dug in each subplot.
                                                                                                                                                                                                                                                                                                            Natural and legume fallows plots
  Results
  1. Soil macro-invertebrate community
                                                                                                                                                                                                                                                                            2. Legumes impact on soil macro-invertebrate abundance
  Soil macrofauna community, collected in all experimental plots, consisted in 12 taxa, namely earthworms, ants, termites,
  spiders, coleoptera, diplopoda, chilopoda, hemiptera, dermaptera, isopoda, coleoptera and diptera larvae. Earthworm                                                                                                                                                         1000 Macrofauna         density (individual.m.-2)                         a
  communities comprised 17 species, distributed among 6 genera. Pueraria phaseoloides (Pp) hosted the highest total
                                                                                                                                                                                                                                                                                800                                                            a
  number of earthworm species. This legume species was followed by C. cajan (Cc), that hosted twice as much species as                                                                                                                                                                                               a
  M. pruriens. Pueraria phaseoloides and M. pruriens (Mp) fallows hosted more species than the corresponding check                                                                                                                                                              600           a                                              629.3
  plots.                                                                                                                                                                                                                                                                                             b                                                 620.7            Legume
                                                                                                                                                                                                                                                                                400         426.7                  465.3        b
                                                                                                                                                                                                                                                                                                                                                                        Control
                                                                                                                                                                                                                                                                                200                 304                     310.7
                                                                                                                                                                                                                                                                                     0
                                                                                                                                                                                                                                                                                               Pueraria            Cajanus cajan           Mucuna pruriens
                                                                                                                                                                                                                                                                                             phaseoloides
                                                                                                                                                                                                                                                                                                                   Legume plots


                                                                                                                                                                                                                                                                              250        Earthworm density (individual.m.-2)
                                                                                                                                                                                                                                                                              200             a                   a                                a
                                                                                                                                                                                                                                                                                                                       a                                  a
                                                                                                                                                                                                                                                                              150                 b
                                                                                                                                                                                                                                                                                             160                    150.7                     165.3                 Legume
                                                                                                                                                                                                                                                                              100
                                                                                                                                                                                                                                                                                                    118.7                    136                        138.7       Control
                                                                                                                                                                                                                                                                               50

                                                                                                                                                                                                                                                                                0
                                                                                                                                                                                                                                                                                             Pueraria             Cajanus cajan           Mucuna pruriens
                                                                                                                                                                                                                                                                                           phaseoloides
                                                                                                                                                                                                                                                                                                                  Legume plots


                                                                                                                                                                                                                                                                                3. Legumes impact on soil macro-invertebrate diversity
                                                                                                                                                                                                                                                                                         Taxonomic group diversity (Shannon index)
 4. Impact of legume species on soil macro-invertebrate community                                                                                                                                                                                                              2.5
                                                                                                                                                                                                                                                                                              a                         a
                                                                                                                                                                                                                                                                               2.0
                                                                                                                                                                                                                                                                                                    a
                                          a- Macro-invertebrates                                                                                                                 b- Earthworms                                                                                                                    a                                a        a
                                                             1                                                               3                                                                  1                                                                  5
                                                                                                                                                                                                                                                                               1.5
                                                                                                                                                                                                                                   Axis 2 (23%)


                                                                                                                                                                                                                                                                                             2.03                               2.14
                           Axis 2 (30%)


                                                        -1        1                                                     -3        3                                                        -1        1                                                        -5        5
                                                                                                                                                             Axis 2 (23%)


                                                             -1                                                              -3                                                                 -1                                                                 -5
                                                                                                                                                                                                                                                                                                                                                                        Legume
             Biomass                                                                                                                                                                                                                                                           1.0                   1.75                                      1.51
                                                                                                                                                                                                                                                                                                                                                         1.22           Control
                                                                              C. cajan plots
                                                                                                                                                                                                                                                                               0.5                                   1.62
                                          Taxonomic richness
                                                                                                                                                                                                            C. cajan plots
                                                Shannon index                                                                              Shannon index
                                                                                               Axis 2 (30%)


                                                                                                                                        Species richness
                                                                                                                                                                                                                                                                               0.0
    Axis 1 (35%)                                                      Axis 1 (35%)                                                                                          Axis 1 (59%)                 Axis 1 (59%)
                                                                                                                                                                                                                                                                                              Pueraria             Cajanus cajan           Mucuna pruriens
             Density                                                                                                                                                           Equitability                                                                                                 phaseoloides
                                                                                                      P. phaseoloides plots
                                                Equitability                                                                                                                                                                                      M. pruriens plots                                                Legume plots
                                                                                                                                              Biomass                                                      P. phaseoloides plots

                                                                       M. pruriens plots
                                                                                                                                                   Density

                                                                                                                                                                                                                                                         P = 0.009
                                                                                                                  P = 0.001
                                                                                                                                                                                                                                                                                          Earthworm diversity (Shannon index)
 The first two axes accounted for 65 % of the total inertia.                                                                          The distribution of the inertia indicated that the first two axes                                                                        3.0                                     a
                                                                                                                                                                                                                                                                                               a                  a
 Macrofauna abundance correlated negatively to axis 1,                                                                                accounted for 82 % of total inertia. Excepted for equitability,                                                                          2.5
                                                                                                                                      all earthworm communities were negatively correlated to                                                                                  2.0                 b
 whereas diversity correlated positively to the same axis.                                                                                                                                                                                                                                                                                         a
                                                                                                                                                                                                                                                                                                                                2.72                        a
 Biomass, taxonomic richness and Shannon index were                                                                                   axis 1. Earthworm species richness and Shannon index were                                                                                1.5           2.43                                                                       Legume
                                                                                                                                                                                                                                                                                                                     2.42
 positively correlated to axis 2, while density and equitability                                                                      positively correlated to axis 2, while abundance and                                                                                     1.0                   1.59                                      1.48
                                                                                                                                                                                                                                                                                                                                                         1.39           Control
 were negatively correlated to this axis. Legume plots                                                                                equitability were negatively correlated. The projection of                                                                               0.5
 projection revealed a significant opposition between the 3                                                                           legume plots revealed a significant opposition between the 3                                                                             0.0
 legume species. M. pruriens and C. cajan fallows restored                                                                            legume-based fallows. P. phaseoloides restored earthworm                                                                                                Pueraria             Cajanus cajan           Mucuna pruriens
 most macro-invertebrates communities and biomass,                                                                                    abundance, while C. cajan fallow hosted the highest species                                                                                           phaseoloides
 respectively. While P. phaseoloides produced the highest                                                                             diversity. Though M. pruriens hosted the lowest diversity,                                                                                                                   Legume plots
 taxonomic diversity.                                                                                                                 the individuals were fairly evenly distributed into the
                                                                                                                                      different species.
Conclusion                                                                                                                                                                                                                                                                   Acknowledgements
The study assessed the potential of legumes to improve soil macro-invertebrate biodiversity. Of the 3 legume-based                                                                                                                                                           This study is a part of the N°GF/2715-2 projet, supported by FEM/PNUE. The
fallows, P. phaseoloides and M. pruriens restored soil macrofauna biodiversity more than C. cajan, although the increase                                                                                                                                                     authors are grateful to the local coordinating committee, the farmers from
was not always significant. Hence, P. phaseolides fallow was the most effective in enhancing soil macrofauna biodiversity                                                                                                                                                    Goulikao and field technicians for their kind assistance throughout this
after 9 months of growth.                                                                                                                                                                                                                                                    investigation.
References
Brussaard L., de Ruiter P.C., Brown G.G., (2007). Soil biodiversity for agricultural sustainability. Agriculture, Ecosystems and Environment 121 : 233–244.
Koné WA, Tondoh E.J., Angui T.K.P., Bernhard-Reversat F., Loranger-Merciris, Brunet D., Bredoumi K.T.S., (2008). Is soil quality improvement by legume cover crops a function of the initial soil chemical characteristics? Nutrient Cycling in
Agroecosystems 82. P. 89-105.
Lavelle P., Spain A., (2001). Soil Ecology. Kluwer Academic Publisher (ed.) 654p.
Lavelle, P., Senapati, B., Barrot, E., (2003). Soil macrofauna. In Schroth, G., Sinclair, F.L. (EDS). Trees, Crops and soil fertility: Concepts and Research Methods. International , Wallingford. UK : 397-407.
Lavelle P., Blouin M., Boyer J., Cadet P., Laffray D., Pham-Thi A., Reversat G., Settle W., Zuily Y., (2004). Plant parasite control and soil fauna diversity. Comptes Rendus Biologies 327: 629-638                                                                                                                        .

Más contenido relacionado

Más de CSM _BGBD biodiversity

Land use effects on litter decomposition in tropical ecosystems in mexico
Land use effects on litter decomposition in tropical ecosystems in mexicoLand use effects on litter decomposition in tropical ecosystems in mexico
Land use effects on litter decomposition in tropical ecosystems in mexico
CSM _BGBD biodiversity
 
Nematode community structure as influenced by land use and intensity of culti...
Nematode community structure as influenced by land use and intensity of culti...Nematode community structure as influenced by land use and intensity of culti...
Nematode community structure as influenced by land use and intensity of culti...
CSM _BGBD biodiversity
 
Diversity and ecology of macrofauna in land use mosaics embu and taita distri...
Diversity and ecology of macrofauna in land use mosaics embu and taita distri...Diversity and ecology of macrofauna in land use mosaics embu and taita distri...
Diversity and ecology of macrofauna in land use mosaics embu and taita distri...
CSM _BGBD biodiversity
 
Diversity of ant species across a gradient of land use types in western ghats...
Diversity of ant species across a gradient of land use types in western ghats...Diversity of ant species across a gradient of land use types in western ghats...
Diversity of ant species across a gradient of land use types in western ghats...
CSM _BGBD biodiversity
 
Abundance and diversity of azotobacter and po4 solubilizing microorganisms i...
Abundance and diversity of azotobacter and po4  solubilizing microorganisms i...Abundance and diversity of azotobacter and po4  solubilizing microorganisms i...
Abundance and diversity of azotobacter and po4 solubilizing microorganisms i...
CSM _BGBD biodiversity
 
Studies on microbial inoculation in the preparation of phospho compost using ...
Studies on microbial inoculation in the preparation of phospho compost using ...Studies on microbial inoculation in the preparation of phospho compost using ...
Studies on microbial inoculation in the preparation of phospho compost using ...
CSM _BGBD biodiversity
 
Farming practices and soil health arbsucular mcorrhizal fungi (amf) in maize ...
Farming practices and soil health arbsucular mcorrhizal fungi (amf) in maize ...Farming practices and soil health arbsucular mcorrhizal fungi (amf) in maize ...
Farming practices and soil health arbsucular mcorrhizal fungi (amf) in maize ...
CSM _BGBD biodiversity
 
Soil fauna and nutrient management for improving agricultural production thro...
Soil fauna and nutrient management for improving agricultural production thro...Soil fauna and nutrient management for improving agricultural production thro...
Soil fauna and nutrient management for improving agricultural production thro...
CSM _BGBD biodiversity
 
Diversity of termites along a gradient of land use type in a tropical forest ...
Diversity of termites along a gradient of land use type in a tropical forest ...Diversity of termites along a gradient of land use type in a tropical forest ...
Diversity of termites along a gradient of land use type in a tropical forest ...
CSM _BGBD biodiversity
 
Termites diversity along a gradient of land use in a tropical forest margin, ...
Termites diversity along a gradient of land use in a tropical forest margin, ...Termites diversity along a gradient of land use in a tropical forest margin, ...
Termites diversity along a gradient of land use in a tropical forest margin, ...
CSM _BGBD biodiversity
 
Assemblages of soil nematodes and land use systems in the benchmark site of a...
Assemblages of soil nematodes and land use systems in the benchmark site of a...Assemblages of soil nematodes and land use systems in the benchmark site of a...
Assemblages of soil nematodes and land use systems in the benchmark site of a...
CSM _BGBD biodiversity
 
Land use changes the structure of soil bacterial communities in the western a...
Land use changes the structure of soil bacterial communities in the western a...Land use changes the structure of soil bacterial communities in the western a...
Land use changes the structure of soil bacterial communities in the western a...
CSM _BGBD biodiversity
 

Más de CSM _BGBD biodiversity (20)

The solution to global warming could be in the soil
The solution to global warming could be in the soilThe solution to global warming could be in the soil
The solution to global warming could be in the soil
 
Land use and community composition of arbusscular mycorrhizal fungi mabira fo...
Land use and community composition of arbusscular mycorrhizal fungi mabira fo...Land use and community composition of arbusscular mycorrhizal fungi mabira fo...
Land use and community composition of arbusscular mycorrhizal fungi mabira fo...
 
Changes in the diversity of assemblages of ground foraging ants in response t...
Changes in the diversity of assemblages of ground foraging ants in response t...Changes in the diversity of assemblages of ground foraging ants in response t...
Changes in the diversity of assemblages of ground foraging ants in response t...
 
Nematodes vc
Nematodes vcNematodes vc
Nematodes vc
 
Nematodes sf
Nematodes sfNematodes sf
Nematodes sf
 
Nematodes lm
Nematodes lmNematodes lm
Nematodes lm
 
Land use effects on litter decomposition in tropical ecosystems in mexico
Land use effects on litter decomposition in tropical ecosystems in mexicoLand use effects on litter decomposition in tropical ecosystems in mexico
Land use effects on litter decomposition in tropical ecosystems in mexico
 
Nematode community structure as influenced by land use and intensity of culti...
Nematode community structure as influenced by land use and intensity of culti...Nematode community structure as influenced by land use and intensity of culti...
Nematode community structure as influenced by land use and intensity of culti...
 
Diversity and ecology of macrofauna in land use mosaics embu and taita distri...
Diversity and ecology of macrofauna in land use mosaics embu and taita distri...Diversity and ecology of macrofauna in land use mosaics embu and taita distri...
Diversity and ecology of macrofauna in land use mosaics embu and taita distri...
 
Diversity of ant species across a gradient of land use types in western ghats...
Diversity of ant species across a gradient of land use types in western ghats...Diversity of ant species across a gradient of land use types in western ghats...
Diversity of ant species across a gradient of land use types in western ghats...
 
Abundance and diversity of azotobacter and po4 solubilizing microorganisms i...
Abundance and diversity of azotobacter and po4  solubilizing microorganisms i...Abundance and diversity of azotobacter and po4  solubilizing microorganisms i...
Abundance and diversity of azotobacter and po4 solubilizing microorganisms i...
 
Studies on microbial inoculation in the preparation of phospho compost using ...
Studies on microbial inoculation in the preparation of phospho compost using ...Studies on microbial inoculation in the preparation of phospho compost using ...
Studies on microbial inoculation in the preparation of phospho compost using ...
 
Farming practices and soil health arbsucular mcorrhizal fungi (amf) in maize ...
Farming practices and soil health arbsucular mcorrhizal fungi (amf) in maize ...Farming practices and soil health arbsucular mcorrhizal fungi (amf) in maize ...
Farming practices and soil health arbsucular mcorrhizal fungi (amf) in maize ...
 
Soil fauna and nutrient management for improving agricultural production thro...
Soil fauna and nutrient management for improving agricultural production thro...Soil fauna and nutrient management for improving agricultural production thro...
Soil fauna and nutrient management for improving agricultural production thro...
 
Diversity of termites along a gradient of land use type in a tropical forest ...
Diversity of termites along a gradient of land use type in a tropical forest ...Diversity of termites along a gradient of land use type in a tropical forest ...
Diversity of termites along a gradient of land use type in a tropical forest ...
 
Termites diversity along a gradient of land use in a tropical forest margin, ...
Termites diversity along a gradient of land use in a tropical forest margin, ...Termites diversity along a gradient of land use in a tropical forest margin, ...
Termites diversity along a gradient of land use in a tropical forest margin, ...
 
Assemblages of soil nematodes and land use systems in the benchmark site of a...
Assemblages of soil nematodes and land use systems in the benchmark site of a...Assemblages of soil nematodes and land use systems in the benchmark site of a...
Assemblages of soil nematodes and land use systems in the benchmark site of a...
 
Land use changes the structure of soil bacterial communities in the western a...
Land use changes the structure of soil bacterial communities in the western a...Land use changes the structure of soil bacterial communities in the western a...
Land use changes the structure of soil bacterial communities in the western a...
 
OP25:Soliciting for prominence of belowground biodiversity conservation and m...
OP25:Soliciting for prominence of belowground biodiversity conservation and m...OP25:Soliciting for prominence of belowground biodiversity conservation and m...
OP25:Soliciting for prominence of belowground biodiversity conservation and m...
 
OP29:PROPOSALS FROM THE NATIONAL STAKEHOLDER WORKSHOP
OP29:PROPOSALS FROM THE NATIONAL STAKEHOLDER WORKSHOPOP29:PROPOSALS FROM THE NATIONAL STAKEHOLDER WORKSHOP
OP29:PROPOSALS FROM THE NATIONAL STAKEHOLDER WORKSHOP
 

Legume based fallows for restoring the community of soil macro-invertebrates in semi-deciduous forest areas of côte d’ivoire

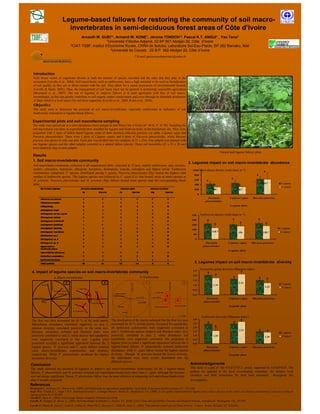
  • 1. Legume-based fallows for restoring the community of soil macro- invertebrates in semi-deciduous forest areas of Côte d’Ivoire Arnauth M. GUEI1*, Armand W. KONE1, Jérome TONDOH 2, Pascal K.T. ANGUI1 , Yao Tano3 1Université d’Abobo-Adjamé, 02 BP 801 Abidjan 02, Côte d’Ivoire 2CIAT-TSBF, Institut d’Economie Rurale, CRRA de Sotuba, Laboratoire Sol-Eau-Plante, BP 262 Bamako, Mali 3Université de Cocody , 22 B.P. 582 Abidjan 22, Côte d’Ivoire * E-mail:gueiarnauthmartinez@yahoo.fr Conservation and Sustainable Management of Below Ground Biodiveristy Introduction Soils house scores of organisms diverse in both the number of species recorded and the roles that they play in the ecosystem (Lavelle et al., 2004). Soil macrofauna, such as earthworms, have a high potential to be used as bioindicators of soil quality, as they are in direct contact with the soil. They allow for a sound assessment of environmental hazards (Lavelle & Spain, 2001). Thus, the management of soil fauna must not be ignored in promoting sustainable agriculture (Brussaard et al., 2007). The use of legumes to improve fallows is in total agreement with that of soil macro- invertebrates, as this can greatly contribute to soil organic matter conservation and cover through an abundant production of litter which is a food source for soil-born organisms (Lavelle et al., 2003; Koné et al., 2008). Objective The study aims to determine the potential of soil macro-invertebrates, especially earthworms as indicators of soil Natural fallow Mucuna pruriens variety utilis biodiversity restoration in legume-based fallows. Experimental plots and soil macrofauna sampling The study was carried out in a semi-deciduous forest margin in mid-West Côte d’Ivoire (6° 30’N, 5° 31’W). Sampling for soil macrofauna was done in experimental plots installed for legume and foodcrop trials, in the benchmark site. They were concerned with 3 types of fallow-based legume crops of short duration (Mucuna pruriens var utilis, Cajanus cajan and Pueraria phaseoloides). There were 4 plots of Cajanus cajans and 4 plots of Pueraria phaseoloides, while Mucuna pruriens was grown in only one plot. Each plot was divided into two subplots of 25 x 25m. One subplot was planted with one legume species and the other subplot consisted in a natural fallow (check). Three soil monoliths (25 x 25 x 20 cm) Cajanus cajan Pueraria phaseoloides were randomly dug in each subplot. Natural and legume fallows plots Results 1. Soil macro-invertebrate community 2. Legumes impact on soil macro-invertebrate abundance Soil macrofauna community, collected in all experimental plots, consisted in 12 taxa, namely earthworms, ants, termites, spiders, coleoptera, diplopoda, chilopoda, hemiptera, dermaptera, isopoda, coleoptera and diptera larvae. Earthworm 1000 Macrofauna density (individual.m.-2) a communities comprised 17 species, distributed among 6 genera. Pueraria phaseoloides (Pp) hosted the highest total 800 a number of earthworm species. This legume species was followed by C. cajan (Cc), that hosted twice as much species as a M. pruriens. Pueraria phaseoloides and M. pruriens (Mp) fallows hosted more species than the corresponding check 600 a 629.3 plots. b 620.7 Legume 400 426.7 465.3 b Control 200 304 310.7 0 Pueraria Cajanus cajan Mucuna pruriens phaseoloides Legume plots 250 Earthworm density (individual.m.-2) 200 a a a a a 150 b 160 150.7 165.3 Legume 100 118.7 136 138.7 Control 50 0 Pueraria Cajanus cajan Mucuna pruriens phaseoloides Legume plots 3. Legumes impact on soil macro-invertebrate diversity Taxonomic group diversity (Shannon index) 4. Impact of legume species on soil macro-invertebrate community 2.5 a a 2.0 a a- Macro-invertebrates b- Earthworms a a a 1 3 1 5 1.5 Axis 2 (23%) 2.03 2.14 Axis 2 (30%) -1 1 -3 3 -1 1 -5 5 Axis 2 (23%) -1 -3 -1 -5 Legume Biomass 1.0 1.75 1.51 1.22 Control C. cajan plots 0.5 1.62 Taxonomic richness C. cajan plots Shannon index Shannon index Axis 2 (30%) Species richness 0.0 Axis 1 (35%) Axis 1 (35%) Axis 1 (59%) Axis 1 (59%) Pueraria Cajanus cajan Mucuna pruriens Density Equitability phaseoloides P. phaseoloides plots Equitability M. pruriens plots Legume plots Biomass P. phaseoloides plots M. pruriens plots Density P = 0.009 P = 0.001 Earthworm diversity (Shannon index) The first two axes accounted for 65 % of the total inertia. The distribution of the inertia indicated that the first two axes 3.0 a a a Macrofauna abundance correlated negatively to axis 1, accounted for 82 % of total inertia. Excepted for equitability, 2.5 all earthworm communities were negatively correlated to 2.0 b whereas diversity correlated positively to the same axis. a 2.72 a Biomass, taxonomic richness and Shannon index were axis 1. Earthworm species richness and Shannon index were 1.5 2.43 Legume 2.42 positively correlated to axis 2, while density and equitability positively correlated to axis 2, while abundance and 1.0 1.59 1.48 1.39 Control were negatively correlated to this axis. Legume plots equitability were negatively correlated. The projection of 0.5 projection revealed a significant opposition between the 3 legume plots revealed a significant opposition between the 3 0.0 legume species. M. pruriens and C. cajan fallows restored legume-based fallows. P. phaseoloides restored earthworm Pueraria Cajanus cajan Mucuna pruriens most macro-invertebrates communities and biomass, abundance, while C. cajan fallow hosted the highest species phaseoloides respectively. While P. phaseoloides produced the highest diversity. Though M. pruriens hosted the lowest diversity, Legume plots taxonomic diversity. the individuals were fairly evenly distributed into the different species. Conclusion Acknowledgements The study assessed the potential of legumes to improve soil macro-invertebrate biodiversity. Of the 3 legume-based This study is a part of the N°GF/2715-2 projet, supported by FEM/PNUE. The fallows, P. phaseoloides and M. pruriens restored soil macrofauna biodiversity more than C. cajan, although the increase authors are grateful to the local coordinating committee, the farmers from was not always significant. Hence, P. phaseolides fallow was the most effective in enhancing soil macrofauna biodiversity Goulikao and field technicians for their kind assistance throughout this after 9 months of growth. investigation. References Brussaard L., de Ruiter P.C., Brown G.G., (2007). Soil biodiversity for agricultural sustainability. Agriculture, Ecosystems and Environment 121 : 233–244. Koné WA, Tondoh E.J., Angui T.K.P., Bernhard-Reversat F., Loranger-Merciris, Brunet D., Bredoumi K.T.S., (2008). Is soil quality improvement by legume cover crops a function of the initial soil chemical characteristics? Nutrient Cycling in Agroecosystems 82. P. 89-105. Lavelle P., Spain A., (2001). Soil Ecology. Kluwer Academic Publisher (ed.) 654p. Lavelle, P., Senapati, B., Barrot, E., (2003). Soil macrofauna. In Schroth, G., Sinclair, F.L. (EDS). Trees, Crops and soil fertility: Concepts and Research Methods. International , Wallingford. UK : 397-407. Lavelle P., Blouin M., Boyer J., Cadet P., Laffray D., Pham-Thi A., Reversat G., Settle W., Zuily Y., (2004). Plant parasite control and soil fauna diversity. Comptes Rendus Biologies 327: 629-638 .