SlideShare una empresa de Scribd logo
1 de 41
Hurricanes: Occur in the North Atlantic Ocean and Northeast
Pacific, often affecting the US east coast and Caribbean. The
strength of a hurricane is measured on a wind scale from 1 to 5. A
Category 1 hurricane will bring with it sustained winds of 119-
153km/h (74-95 mph) whereas a Category 5 storm can exceed
252km/h (157 mph)
Typhoons: Occur in the northwestern Pacific Ocean, frequently
hitting the Philippines and Japan. Typhoon season is most common
between May to October, but they can form year-round. The
strength of a typhoon has various classification scales with the most
severe storms named “super typhoons”.
Cyclones: Occur in the South Pacific and the Indian Ocean, often
affecting countries from Australia all the way to Mozambique.
Cyclone season is typically between November and April.
The terms hurricane, typhoon and cyclone all refer to tropical cyclones — circular
storms that form over warm waters, with very low air pressure at the center and
winds greater than 74 miles per hour. But different terms are used for such storms in
different parts of the world.
 A hurricane forms in the North Atlantic, the northeastern Pacific, the Caribbean Sea
or the Gulf of Mexico.
 A typhoon develops in the northwestern Pacific and usually affects Asia.
The international date line serves as the Pacific Ocean’s dividing marker, so when a
hurricane crosses it from east to west, it becomes a typhoon, and vice versa.
The same kinds of storms in the Southern Hemisphere have different labels:
 A tropical cyclone forms in the southern Indian Ocean or the South Pacific.
(Remember, tropical cyclone is also the umbrella term for all these storms.)
 A cyclone forms in the Bay of Bengal or Arabian Sea, both in the northern Indian
Ocean.
As violent as they are, these storms help regulate the global climate by moving heat
away from the tropics and toward the poles.
Aside from having different names, hurricanes, typhoons and cyclones have different
seasons. The Atlantic hurricane season officially runs from June 1 to Nov. 30. The
Pacific season starts slightly earlier. Typhoons can form year-round but are most
common from May to October.
In the southern Indian Ocean, the season begins two weeks later and ends at the
same time, except in the island nations of Mauritius and the Seychelles, where it
begins May 15. Cyclones in the northern Indian Ocean have no official season but
tend to be concentrated from May to November.
Tropical cyclones generally become weaker after they arrive on land, since they draw
their energy from the evaporation of water in the oceans below them. But they can
travel quite far inland before they dissipate, wreaking havoc through wind damage,
torrential rains and flooding.
Storms whose winds are not quite strong enough to qualify as tropical cyclones are
called tropical storms if their sustained wind speeds are 39 to 73 miles an hour. They
are called tropical depressions — a reference to the low pressure at their core — when
the speeds are below that range.
Tropical cyclones around the world are named according to a list maintained by the
World Meteorological Organization. The names of the deadliest storms, like Typhoon
Haiyan or Hurricane Katrina, are retired.
A cyclone is any mass of air that spirals around a low pressure center. It is
an organized collection of thunderstorms embedded in a swirling mass of
air. In general, both typhoons and hurricanes are tropical cyclones but
differ in their locations. The difference between hurricane and typhoon is
that tropical cyclones in the west Pacific are called Typhoons and those in
the Atlantic and east Pacific Ocean are called Hurricanes. It's
the longitude that matters.
Comparison chart
Differences — Similarities —
Hurricane versus Typhoon comparison chart
Hurricane Typhoon
About A hurricane is a cyclone that is located
in the North Atlantic Ocean, or the NE
Pacific Ocean east of the International
Date Line, or the South Pacific Ocean
east of 160E, and with sustained
winds that reach or exceed 74 mph.
Tropical cyclones in the Northwest
Pacific Ocean west of the International
Date Line with sustained winds of (or
those that exceed) 74 mph are typhoons.
Rotation Clockwise in the southern hemisphere
and counterclockwise in the northern
hemisphere
Clockwise in the southern hemisphere
and counterclockwise in the northern
hemisphere
Intensity Hurricanes are classified into five
categories according to the Saffir-
Typhoons are generally very strong
because of the Pacific’s warm water,
Hurricane versus Typhoon comparison chart
Hurricane Typhoon
Simpson Hurricane Wind Scale. The
wind speed and intensity of damage
increases as from category 1 to
category 5.
and therefore are more frequent. They
are also classified on the Saffir-Simpson
Hurricane Wind Scale, but can also be
classified on the Japan Meteorological
Agency typhoon scal
Location North Atlantic Ocean, the Northeast
Pacific Ocean east of the International
Date Line, or the South Pacific Ocean
east of 160E. Hurricanes are found
near the tropical zone, over warm
waters in the Atlantic and Pacific
ocean.
Northwest Pacific Ocean west of the
International Date Line
Most affected
areas
Caribbean Sea South East Asia, China Sea etc.
Frequency 10-15 per year 25-30 per year
Occurrence Usually warm areas Usually warm areas
Characteristics Heavy winds, floods, storm surge, a
lot of rain, tornadoes
Heavy winds, floods, storm surge, a lot
of rain, tornadoes
Forms of
precipitation
Rain Rain
Hurricane Irene as seen from space
Speed of a Typhoon vs. Hurricane
A tropical cyclone is one in which the maximum sustained surface wind
(using the U.S. 1-minute average) is generally 64 kt (74 mph or 119 km/hr) or
more.
Differences in Location
The term hurricane is used for Northern Hemisphere tropical cyclones east of
the International Date Lineto the Greenwich Meridian. The term typhoon is
used for Pacific tropical cyclones north of the Equator west of the
International Date Line i.e. between 100E and 180E in the northern
hemisphere.
Hurricane Isaac as seen from a NASA satellite on August 28, 2012.
Differences in Intensity
Typhoons are generally stronger than hurricanes. This is because of warmer
water in the western Pacific which creates better conditions for development
of a storm. This unlimited amount of warm water also makes for increased
frequency of typhoons. Even the wind intensity in a typhoon is stronger than
that of a hurricane but they cause comparatively lesser loss due to their
location. However, both use the Saffir-Simpson Hurricane Wind Scale for
classification.
Direction of Rotation
Some reports also suggest that typhoons can only be counterclockwise
("anti-clockwise" in British English) while hurricanes can be both anti-
clockwise and clockwise.
Areas where hurricanes and typhoons occur
Figures suggest the most common area for a Hurricane to occur is
the Caribbean Sea while typhoons have a frequent occurrence off the coast
of South East Asia.
Intensity Categories
Typhoons are tropical cyclones and are classified differently in various
countries. Here's how Japan classifies typhoons:
Japan Meteorological Agency's Tropical Cyclone Intensity Scale
Category Sustained winds
Violent Typhoon
≥105 knots
≥194 km/h
Very Strong Typhoon
85–104 knots
157–193 km/h
Typhoon
64–84 knots
118–156 km/h
Severe Tropical Storm
48–63 knots
89–117 km/h
Tropical Storm
34–47 knots
62–88 km/h
Tropical Depression
≤33 knots
≤61 km/h
Hurricanes are classified into 5 intensity categories using the Saffir-Simpson
scale.
Saffir–Simpson scale
Category
Wind speeds
(for 1-minute maximum sustained winds)
meters per
second
knots miles per hour
kilometers
per hour
Five ≥ 70 m/s ≥ 137 kn ≥ 157 mph ≥ 252 km/h
Four 58–70 m/s 113–136 kn 130–156 mph 209–251 km/h
Three 50–58 m/s 96–112 kn 111–129 mph 178–208 km/h
Two 43–49 m/s 83–95 kn 96–110 mph 154–177 km/h
One 33–42 m/s 64–82 kn 74–95 mph 119–153 km/h
Category 1 hurricanes cause minimal damage, category 2 cause moderate
damage, category 3 cause extensive damage, category 4 hurricanes cause
extreme damage, and category 5 hurricanes cause catastrophic damage.
Names of hurricanes and typhoons
Some commonly occurring hurricanes and typhoons have been named to
categorize them. The names of Hurricanes are given each year. A few
hurricanes named in the Atlantic in 2007 are Andrea, Barry and Dean. Some
Typhoons named in the Western North Pacific and the South China Sea are
Damrey, Langwang and Kirogi. Typhoons in the Chinese and Japanese
regions are named after living things and often objects like flowers, rivers etc.
Check out every hurricane name since 1950.
About:
A tornado is a rotating column of air
ranging in width from a few yards to
more than a mile and whirling at
destructively high speeds, usually
accompanied by a funnel-shaped
downward extension of a
cumulonimbus cloud. Winds 40-
300+ mph.
Rotation:
Clockwise in the southern
hemisphere and counterclockwise
in the northern hemisphere
Intensity:
The scale used for rating the
strength of tornadoes is called the
Fujita (F), Enhanced Fujita (EF),
and TORRO (T) Scale.
Location:
Tornados have been spotted in all
continents except Antarctica.
Most affected areas:
In areas where a convergence of
cold and warm fronts is common.
i.e. US Midwest.
Frequency:
The United States records about
1200 tornadoes per year, whereas
the Netherlands records the highest
number of tornadoes per area
compared to other countries.
Tornadoes occur commonly in
spring and the fall season and are
less common in winters
Occurrence:
Places where cold and warm fronts
converge. Can be just almost
anywhere.
Characteristics:
Very strong cyclonic winds, very
heavy rain, large hail, strong cloud
to ground lightning.
Forms of precipitation: Rain, sleet, and hail
Number of convective
storms:
One
Temperature gradient
required:
Large
Life span: In minutes
Size: Diameter of hundreds of meters
Amount of warning:
Minutes to hours. The conditions
for the possibility of a tornado can
be predicted hours before an event,
however, tornadoes rarely leave
much more than a couple minutes
warning. And sometimes none.
Shape: Cone shape.
Tidal waves are waves created by the gravitational forces of the sun or
moon, and cause changes in the level of water bodies. Tsunami is also a
series of water waves that are caused because of the displacement of large
bodies of water, but due to seismic disturbances.
Comparison chart
Tidal Wave versus Tsunami comparison chart
Tidal Wave Tsunami
About Tidal waves are waves created
by the gravitational forces of
the sun or moon, and cause
changes in the level of water
bodies.
Tsunami is a series of water waves caused by the
displacement of large bodies of water. They
generally have low amplitude but a high (a few
hundred km long) wavelength. Tsunamis generally
go unnoticed at sea but prominent in shallow waters
or land.
Cause Tidal waves are caused due to
the gravitational force exerted
by the sun and the moon.
Tsunamis are generated by earthquakes, erupting
submarine volcanoes or due to any gas bubble
erupting in the sea or ocean.
Intensity The intensity of a changing tide
is noticeable only in certain
parts where it’s high enough
(As high as 55 feet in the Bay
of Fundy, Canada).
Tsunamis can have wavelengths of up to 200
kilometres and can travel over 800 kilometres per
hour. When tsunamis approach shallow water near
land masses, the speed decreases, and the amplitude
increases very rapidly.
Location Tidal waves are phenomena
seen most at coastal areas.
A majority of tsunamis (80%) occur in the Pacific
Ocean but can occur in any large body of water if
the underlying causes are present.
Frequency Tidal waves occur daily at a
coastal area.
Tsunamis occur only when there is seismic
disturbance in large water bodies.
About
Tidal waves are ocean waves that occur periodically and depend on the relative
position of the Earth and the Moon. This is the reason why the arrival of the tide
differs each day. The height of the tidal wave is determined by the gravitational force
exerted by the moon; hence it is highest during new and full phases of the moon and
lowest during the quarter phases of the moon. The costal areas experience two high
and two low tides daily.
Tsunamis were erroneously referred to as tidal waves in the past, but they are not
related to tide formation and can occur in any tidal state. In Japanese, tsunami
translates to "harbor wave" as this phenomenon is seen more commonly seen in the
coastal areas. In early geographic texts, tsunami was also referred to as seismic sea
waves.
Tsunamis generally have low amplitude but a high wavelength, which can be a few
hundred kilometres long. Tsunamis generally go unnoticed at sea but prominent in
shallow waters or land.
Cause
Tidal waves are caused due to both the sun and the moon, but due to the close
distance between the earth and moon, the effect moon has on tidal waves is much
greater than the sun.
Tsunamis can be generated by earthquakes, erupting submarine volcanoes or due to
any gas bubble erupting in the sea or ocean. These causes have the potential of
creating tsunamis provided it occurs just below the body of water, is of moderate
amplitude or displaces a large volume of water.
Intensity and Damage
The intensity of a changing tide is noticeable only in certain parts where it’s high
enough (the Bay of Fundy in Canada where it reached as high as 55 feet). Strong
tides have the potential to cause damage to the houses on the beach and can result in
flooding.
Tsunamis can have wavelengths of up to 200 kilometres and can travel over 800
kilometres per hour. When tsunamis approach shallow water near land masses, the
speed decreases, and the amplitude increases very rapidly. The scale used to measure
tsunamis is Sieberg-Ambraseys scale and the Imamura-Iida scale used for tsunamis
in the Mediterranean sea and Pacific ocean, respectively. The magnitude of tsunamis
is measured by the ML (Murty and Loomis).
Tsunamis can cause extensive damage. These powerful waves can destroy entire
villages, and drown anything that comes in its way. An effective way to prevent
damage is to plant sturdy trees along the shoreline which are able to withstand the
force of these waves.
Location
Tidal waves are phenomenon seen at most coastal areas. A majority of tsunamis
(80%) occur in the Pacific Ocean but can occur in any large body of water if the
underlying causes are present.
Frequency
Tidal waves occur on a daily basis in most coastal area, whereas tsunamis occur as
when there is seismic disturbance in large water bodies. Although tsunamis cannot be
accurately predicted, there are some warning signs that can be used to save lives.
References
 Causes of tsunamis - Wikipedia
 What is a tidal wave - NOAA.gov
 What is the difference between a tsunami and a tidal wave? - USGS.gov
Weather is the day-to-day state of the atmosphere in a region and its short-
term (minutes to weeks) variations, whereas climate is defined as statistical
weather information that describes the variation of weather at a given place
for a specified interval. They are both used interchangeably sometimes but
differ in terms of the length of time they measure and what trends affect
them.
Weather is the combination of temperature, humidity, precipitation,
cloudiness, visibility, and wind. In popular usage, climate represents the
synthesis of weather; more formally, it is the weather of a locality averaged
over some period (usually 30 years), plus statistics of weather extremes.
In a 2012 survey, a majority of Americans blamed global warming (or
"climate change") for erratic weather patterns in the country, especially heat
waves.[1]
Comparison chart
Climate versus Weather comparison chart
Climate Weather
Definition Describes the average conditions
expected at a specific place at a given
time.A region's climate is generated by
the climate system, which has five
components: atmosphere, hydrosphere,
cryosphere, land surface, and biosphere.
Describes the atmospheric conditions at
a specific place at a specific point in
time. Weather generally refers to day-
to-day temperature and precipitation
activity
Components Climate may include precipitation,
temperature, humidity, sunshine, wind
velocity, phenomena such as fog, frost,
and hail storms over a long period of
time.
Weather includes sunshine, rain, cloud
cover, winds, hail, snow, sleet, freezing
rain, flooding, blizzards, ice storms,
thunderstorms, steady rains from a cold
front or warm front, excessive heat, heat
waves and more
Climate versus Weather comparison chart
Climate Weather
Forecast By aggregates of weather statistics over
periods of 30 years
By collecting meteorological data, like
air temperature, pressure, humidity,
solar radiation, wind speeds and
direction etc.
Determining
factors
Aggregating weather statistics over
periods of 30 years ("climate normals").
Real-time measurements of atmospheric
pressure, temperature, wind speed and
direction, humidity, precipitation, cloud
cover, and other variables
About Climate is defined as statistical weather
information that describes the variation
of weather at a given place for a specified
interval.
Weather is the day-to-day state of the
atmosphere, and its short-term (minutes
to weeks) variation
Time period Measured over a long period Measured for short term
Study Climatology Meteorology
Time factor in climate and weather
The difference between weather and climate is a measure of time. Weather
refers to the atmospheric conditions of a specific place over a short period of
time, usually 24 hours. Climate refers to the average atmospheric conditions
over relatively long periods of time, usually 30 years. In other words, when
one talks about the climate, then they're talking about the pattern over a long
term while when weather is referred to then the conditions of short term are
being spoken of.
Components of weather and climate
There are several aspects to weather. Weather includes sunshine, rain, cloud
cover, winds, hail, snow, sleet, freezing rain, flooding, blizzards, ice
storms, thunderstorms, steady rains from a cold front or warm front,
excessive heat, heat waves and more. Climate may include precipitation,
temperature, humidity, sunshine, wind velocity, phenomena such
as fog, frost, and hail storms over a long period of time.
Changes in climate vs. weather
Weather may change from minute-to-minute, hour-to-hour, day-to-day, and
season-to-season. Climate, however, is the average of weather over time
and space and changes in overall climate tend to be gradual.
Forecast and Measurement
Weather forecasts are made by collecting data that describe the current state
of the atmosphere (particularly the temperature, humidity and wind) and
using physically-based mathematical models to determine how the
atmosphere is expected to change in the future. The chaotic nature of the
atmosphere means that perfect forecasts are impossible, and that forecasts
become less accurate as the range of the forecast increases. Climate is
measured based on the weather statistics. A general period of 30 years is
taken to forecast climate of an area as patterns over a period of time have to
be observed. The standard classification of the earth's climatic zones is
mainly based on the annual cycles of temperature and rainfall. The time
frame makes it possible for weather forecasts to usually be easier and more
accurate than forecasts about climate change.
Human impact and changes on climate and
weather
There is extensive evidence that human activity such as agriculture and
industry results in inadvertent weather modification. Acid rain, caused by
industrial emission of sulfur dioxide and nitrogen oxides into the atmosphere,
adversely affects freshwater lakes, vegetation, and
structures. Anthropogenic pollutants reduce air quality and visibility. The
effects of inadvertent weather modification over the long term may pose
serious threats to many aspects of civilization, including ecosystems, natural
resources, food and fiber production, economic development, and human
health. Climate change caused by human activities that emit greenhouse
gases into the air is expected to affect the frequency of extreme weather
events such as drought, extreme temperatures, flooding, high winds, global
warming and severe storms. Global Warming is
often euphemistically referred to as “Climate Change”.
Study of climate vs. study of weather
Climatology is the study of climate, scientifically defined as weather
conditions averaged over a period of time and is a branch of the atmospheric
sciences. Meteorology (from Greek: μετέωρον, meteoron, "high in the sky";
and λόγος, logos, "knowledge") is the interdisciplinary scientific study of the
atmosphere that focuses on weather processes and forecasting.
References
 http://www.nasa.gov/mission_pages/noaa-n/climate/climate_weather.html
 http://nsidc.org/arcticmet/basics/weather_vs_climate.html
 http://www.mpimet.mpg.de/en/presse/faq-s/was-ist-der-unterschied-zwischen-wetter-
und-klima.html
 http://en.wikipedia.org/wiki/Weather#Weather_modification_and_human_impact
 http://en.wikipedia.org/wiki/Climate#Climate_change
Heat and temperature are related and often confused. More heat
usually means a higher temperature.
Heat (symbol: Q) is energy. It is the total amount of energy
(both kinetic and potential) possessed by the molecules in a piece of
matter. Heat is measured in Joules.
Temperature (symbol: T) is not energy. It relates to the average
(kinetic) energy of microscopic motions of a single particle in the
system per degree of freedom. It is measured in Kelvin (K), Celsius
(C) or Fahrenheit (F).
When you heat a substance, either of two things can happen: the
temperature of the substance can rise or the state of substance can
change.
Comparison chart
Heat versus Temperature comparison chart
Heat Temperature
Definition Heat is energy that is
transferred from one body to
another as the result of a
difference in temperature.
Temperature is a measure of hotness or coldness
expressed in terms of any of several arbitrary scales
like Celsius and Fahrenheit.
Unit Joules Kelvin, Celsius or Fahrenheit
Symbol J K,C,F
SI unit Joule Kelvin
Particles Heat is a measure of how many
atoms there are in a substance
multiplied by how much energy
each atom possesses.
Temperature is related to how fast the atoms within a
substance are moving. The ‘temperature’ of an
object is like the water level – it determines the
direction in which ‘heat’ will flow.
Ability to
do work
Heat has the ability to do work. Temperature can only be used to measure the degree
of heat.
Relationship Between Heat and Temperature
In the video below, Derek Muller of Veritasium goes to the streets to show
strangers how two items may have the same temperature but conduct heat
differently, therefore feeling either warmer or cooler to the touch.
References
While the Mercalli scale describes the intensity of an earthquake
based on its observed effects, the Richter scale describes the
earthquake's magnitude by measuring the seismic waves that cause
the earthquake. The two scales have different applications and
measurement techniques. The Mercalli scale is linear and the Richter
scale is logarithmic. i.e. a magnitude 5 earthquake is ten times as
intense as a magnitude 4 earthquake.
Comparison chart
Mercalli Scale versus Richter Scale comparison chart
Mercalli Scale Richter Scale
Measures The effects caused by an earthquake The energy released by an earthquake
Measuring
Tool
Observation Seismograph
Calculation Quantified from observation of the effects on
earth’s surface, humans, objects and man-
made structures
Base-10 logarithmic scale obtained by
calculating logarithm of the amplitude of
waves.
Scale I (not felt) to XII (total destruction) From 2.0 to 10.0+ (never recorded). A 3.0
earthquake is 10 times stronger than a 2.0
earthquake.
Consistency Varies depending on distance from epicenter Varies at different distances from the
epicenter, but one value is given for the
earthquake as a whole.
Measurement
The Mercalli Intensity Scale measures the intensity of an earthquake by
observing its effect on people, the environment and the earth’s surface.
Richter Scale reading of 2011 Tōhoku earthquake (it was followed by a tsunami)
The Richter Scale measures the energy released by an earthquake using a
seismograph. A base-10 logarithmic scale is obtained by calculating the
logarithm of the amplitude of waves recorded by the seismograph.
Comparing the Scales
Intensity
(Mercalli)
Observations (Mercalli)
Richter Scale
Magnitude
(approx.
comparison)
I No effect 1 to 2
II Noticed only by sensitive people 2 to 3
III Resembles vibrations caused by heavy traffic 3 to 4
IV Felt by people walking; rocking of free standing objects 4
V Sleepers awakened; bells ring 4 to 5
VI Trees sway, some damage from falling objects 5 to 6
VII General alarm, cracking of walls 6
VIII Chimneys fall and some damage to building 6 to 7
IX Ground crack, houses begin to collapse, pipes break 7
X Ground badly cracked, many buildings destroyed. Some landslides 7 to 8
XI Few buildings remain standing, bridges destroyed. 8
XII Total destruction; objects thrown in air, shaking and distortion of ground 8 or greater
Video explaining the differences
This video explains how earthquakes are measured using the Richter and
Mercalli intensity scales.
Applications and Use
2010 Canterbury Earthquake
The Mercalli Intensity Scale is only useful for measuring earthquakes in
inhabited areas and is not considered particularly scientific, as the
experiences of witnesses may vary and the damage caused may not
accurately reflect an earthquake’s strength. It is, however, used to compare
the damage caused by earthquakes in different areas.
The Richter scale is used to measure the magnitude of most modern
earthquakes and allows scientists to accurately compare the strength of
earthquakes at different times and locations.
History
The Mercalli Intensity Scale was developed by Italian volcanologist Giuseppe
Mercalli in 1884 and expanded to include 12 degrees of intensity in 1902 by
Adolfo Cancani. It was modified again by Harry O. Wood and Frank
Neumann in 1931. It is known today as the Modified Mercalli Intensity Scale.
The Richter Magnitude Scale was developed in 1935 by Charles Richter. It
was initially created to study a particular area in California, using the Wood-
Anderson torsion seismograph, to compare the size of different earthquakes
in the region. He later adapted the scale so that it could measure the size of
earthquakes around the globe.
References
 http://en.wikipedia.org/wiki/Richter_magnitude_scale
 http://en.wikipedia.org/wiki/Mercalli_intensity_scale
 http://www.geography-site.co.uk/pages/physical/earth/richt.html
 List of largest Earthquakes - Wikipedia
 Heat and temperature are related and often confused. More
heat usually means a higher temperature.
 Heat (symbol: Q) is energy. It is the total amount of energy
(both kinetic and potential) possessed by the molecules in a
piece of matter. Heat is measured in Joules.
 Temperature (symbol: T) is not energy. It relates to the average
(kinetic) energy of microscopic motions of a single particle in the
system per degree of freedom. It is measured in Kelvin (K),
Celsius (C) or Fahrenheit (F).
Comparison chart
Heat versus Temperature comparison chart
Heat Temperature
Definition Heat is energy that is
transferred from one body to
Temperature is a measure of hotness or coldness
expressed in terms of any of several arbitrary scales
Heat versus Temperature comparison chart
Heat Temperature
another as the result of a
difference in temperature.
like Celsius and Fahrenheit.
Unit Joules Kelvin, Celsius or Fahrenheit
Symbol J K,C,F.
SI unit Joule Kelvin,Celsius or Fahrient.
Particles Heat is a measure of how many
atoms there are in a substance
multiplied by how much energy
each atom possesses.
Temperature is related to how fast the atoms within a
substance are moving. The ‘temperature’ of an
object is like the water level – it determines the
direction in which ‘heat’ will flow.
Ability to
do work
Heat has the ability to do work. Temperature can only be used to measure the degree
of heat.
Relationship Between Heat and Temperature
In the video below, Derek Muller of Veritasium goes to the streets to show
strangers how two items may have the same temperature but conduct heat
differently, therefore feeling either warmer or cooler to the touch.
References
 Heat - Encyclopedia Britannica
 Temperature - Encyclopedia Britannica
 Heat - Wikipedia
The words science and technology can and often are used
interchangeably. But the goal of science is the pursuit of knowledge
for its own sake while the goal of technology is to create products
that solve problems and improve human life. Simply put, technology
is the practical application of science.
Comparison chart
Science versus Technology comparison chart
Science Technology
Result Making virtually value-free Activities always value-laden
Science versus Technology comparison chart
Science Technology
Relevance statements
Evaluation
Methods
Analysis, generalization and
creation of theories
Analysis and synthesis of design
Goals
achieved
through
Corresponding Scientific
Processes
Key Technological Processes
Focus Focuses on understanding
natural phenomena
focuses on understanding the made environment
Development
Methods
Discovery (controlled by
experimentation)
Design, invention, production
Most
observed
quality
Drawing correct conclusions
based on good theories and
accurate data
Taking good decisions based on incomplete data
and approximate models
Skills needed
to excel
Experimental and logical skills Design, construction, testing, planning, quality
assurance, problem solving, decision making,
interpersonal and communication skills
Definition of science and technology
Science from the Latin scientia (knowledge) is a system of
acquiring knowledge based on the scientific method, as well as the organized
body of knowledge gained through such research. Science as defined here is
sometimes termed pure science to differentiate it from applied science, which
is the application of scientific research to specific human needs.
Technology is a broad concept that deals with a species' usage and
knowledge of tools and crafts, and how it affects a species' ability to control
and adapt to its environment. In human society, it is a consequence of
science and engineering, although several technological advances predate
the two concepts.
Science refers to a system of acquiring knowledge. This system uses
observation and experimentation to describe and explain natural phenomena.
The term science also refers to the organized body of
knowledge people have gained using that system.
Fields of science are commonly classified along two major lines:
1. Natural sciences, which study natural phenomena (including biological life),
2. Social sciences, which study human behavior and societies.
These groupings are empirical sciences, which means the knowledge must
be based on observable phenomena and capable of being tested for its
validity by other researchers working under the same conditions.
Differences in Etymology
The word science comes through the Old French, and is derived from the
Latin word scientia for knowledge, which in turn comes from scio - 'I know'.
From the Middle Ages to the Enlightenment, science or scientia meant any
systematic recorded knowledge. Science therefore had the same sort of very
broad meaning that philosophy had at that time. In other languages, including
French, Spanish, Portuguese, and Italian, the word corresponding to science
also carries this meaning. Today, the primary meaning of "science" is
generally limited to empirical study involving use of the scientific method.
Technology is a term with origins in the Greek "technologia", "τεχνολογία" —
"techne", "τέχνη" ("craft") and "logia", "λογία" ("saying"). However, a strict
definition is elusive; "technology" can refer to material objects of use to
humanity, such as machines, hardware or utensils, but can also encompass
broader themes, including systems, methods of organization, and techniques.
The term can either be applied generally or to specific areas: examples
include "construction technology", "medical technology", or "state-of-the-art
technology".
Is Technology Related to Science?
Bigelow’s phrase[1]
“the practical applications of science” points to the root of
much of the current confusion as to the meaning of technology. In using this
phrase to describe technology he effectively placed technology beneath the
umbrella of science to such an extent that science and technology are now,
as Rose described, seen by many as an “indivisible pair” with technology as
the subservient and dependant partner. Thus, for much of the time the pair
are wrapped together into a single conceptual package known simply as
“science”. This point is emphasised when surfing the Internet for technology-
related teaching resources. A plethora of lesson plans exist at sites dedicated
to science education. The problem is, though, that many of these lessons
should properly be termed “technology” but are all too often referred to as
"Applied Science".
One source of confusion is the undoubted relationship that exists between
science and technology and Sparks pointed out that even though science
and technology overlap in an area which might be referred to as “applied
science”, there are a number of important differences between the two, even
though these differences might not be self-evident to an average member of
the general public who, through neglect and through repeated use of the
phrase “science and technology” has lost the distinction between “science”
and between “technology”. The two cannot be told apart, which is hardly
surprising given that, as Mayr put it: “ . . . practical usable criteria for making
sharp neat distinctions between science and technology do not exist.”
What’s the difference between
Partly Cloudy and Partly Sunny?
April 20, 2020 2:27 pm
Dean Wysocki
LINCOLN, NEB. (KLKN) — For starters, partly sunny can only be used during the
day. However, according to the National Weather Service, partly cloudy and partly
sunny mean exactly the same thing.
The NWS definition states that between 3/8 and 5/8 of the sky is covered by clouds
when it’s classified as partly cloudy or partly sunny. Sometimes, a “mix of sun and
clouds” is used by some forecasters instead of “partly sunny” during the daytime
hours, though it is not an official NWS term.
As you may have guessed by now, mostly cloudy means there are more clouds than
sun (or stars, at night). The NWS definition says the sky is classified as mostly
cloudy when 3/4 to 7/8 of the sky is covered by clouds, and it can also be referred to
as “considerable cloudiness.”
On the other hand, mostly sunny means there is more sun than clouds. When 1/8 to
1/4 of the sky is covered by clouds, it’s classified as mostly sunny, or mostly clear at
night, according to the NWS.
Sunny or clear means there are no clouds in the sky, and cloudy means the entire
sky is covered by clouds.
One of the most misused weather terms is “fair.” The NWS uses “fair,” typically at
night, to describe less than 3/8 cloud cover, with no precipitation and no extremes of
visibility, temperature or winds. It describes generally pleasant weather conditions
According to KOMO weatherman Steve Pool[1]
, another difference could be
the nature of change expected. If rain is ending and skies are clearing up,
they tend to use the phrase "partly sunny". On the other hand, if it is sunny
now but is expected to rain later, they would use "partly cloudy" to describe
the forecast.
Sunny
Mostly sunny
Partly cloudy
Partly sunny
Mostly cloudy
Cloudy
The difference is drawn by the amount of precipitation
observed in a particular day: the more precipitation, the higher
humidity, the higher chances for cloudy skies.
“Mostly sunny” and “partly cloudy” being too close to each
other become confusing for most people. “Mostly sunny” simply
means longer periods of sunshine than shady skies, while
“partly cloudy” generally means an equal amount of clouds and
sun. It could be that on a mostly sunny morning, the skies can
be cloudless. On the other hand, a partly cloudy day
may mean that the day would still be warm as there is only a
small amount of clouds in the sky.
There are several accounts, however, that state that “mostly
sunny” and “partly cloudy” weather conditions are essentially
the same. In fact, some meteorologists published a paper giving
support to this claim. According to their studies, both
conditions cover an average amount of opaque clouds that may
range from 45 to 75 per cent.
The only difference is that “partly cloudy” is used when giving a
weather forecast at a time closer to dusk, while “mostly sunny”
is given when the reports are announced during sunrise.
Indeed, saying “mostly sunny” at a time of the day close to
nighttime would be awkward to both the viewers and the
weather reporters.
Theorists of communication and viewer research also agree to
this system of weather forecasts. They have made it a point to
prove that announcing a “mostly sunny” morning
would sound more cheerful to viewers of morning news
programs. This would then give them the vigor and positivity as
they tune in while enjoying at the breakfast table. As obvious
and a no-brainer as it may sound, simply saying “mostly sunny”
instead of “partly cloudy” is found to make the audiences more
cheerful during sunrise.
In line with this, there was actually a paper presented at the
American Meteorological Society which suggests that weather
forecasters and announcers stick to saying “partly cloudy”
regardless of the time of airing to avoid confusion.
Logically, it followed that television stations and broadcasters
showed a howl of protest. Using “mostly sunny” would be more
appropriate as it attracts more optimism from viewers and
rouses positive moods especially during weekend forecasts.
Summary:
1.“Mostly sunny” is a term used by newscasters in announcing
weather conditions during mornings, and “partly cloudy” is
used by evening programs.
2.“Mostly sunny” and “partly cloudy” have the same amount of
percentage of opaque clouds.
3.The difference between the two can be drawn from observing
precipitation: higher humidity gives partly cloudy weather
conditions.
Read more: Difference Between Partly Cloudy and Mostly
Sunny | Difference
Between http://www.differencebetween.net/language/wor
ds-language/difference-between-partly-cloudy-and-mostly-
sunny/#ixzz7kSmyiMxw.
Established by the National Weather Service (NWS) according to a loose set of
rules, the criteria used to describe different elements of your forecast can be pretty
vague.
Sky conditions are classified according to how much “opaque cloud coverage”
(OCC) is expected that day. While the NWS has apparently not defined “opaque
clouds,” they are presumed to be those that can’t be seen through, or more
technically, those that are “opaque to terrestrial radiation.”
To qualify as “Sunny,” there can be no more than 25% OCC. “Clear,” on the other
hand is sometimes used as synonym for “Sunny,” but is only applied when there is
no more than 5% OCC. “Mostly Clear,” which is also a synonym for “Sunny,” is used
when there is between 6% and 25% OCC.
“Mostly Sunny” and “Partly Cloudy” are apparently interchangeable, and apply when
the OCC is between 26% and 50%.”Partly Sunny” and “Mostly Cloudy” can also be
synonyms, when the OCC is between 51% and 69%, although “Mostly Cloudy” can
be applied for OCC up to 87%.
At an OCC of 88% and above, the sky is considered “Cloudy” or “Overcast.”
Note that when there is a “high probability” of precipitation (60% or more), many
weather folks skip the sky condition forecast, since it may be inferred to be “Cloudy.”
When forecasting the chance of precipitation, the NWS considers the likelihood that
there will be at least 0.01 inches of precipitation at one place in the forecast area
within (usually) a 12-hour period (called the probability of precipitation or POP).
Words used in the forecast, such as “chance of rain” and “likely,” as well as “isolated”
and “scattered,” are considered either “expressions of uncertainty” or “qualifiers” (the
last two denote that the entire area will not be affected), and they are tied to ranges
of POPs.
So, when the probability of precipitation (POP) is between 60% and 70%, the
“uncertainty” is low and so the forecast may often include the word “likely,” while
when the POP is only 20%, the “uncertainty” is higher, so the phrase “slight chance,”
may be used.
“Isolated” is used when the POP is between 10% and 29%, while “scattered” is used
when the POP is between 30% and 59%. “Occasional,” “intermittent,” and “periods
of,” denote a POP of greater than 79%, but also that the precipitation will be “on and
off.”
When the forecast temperature is given in a range, it has a particular meaning, as
well. For example, “near 40” means the temperature is expected to be anywhere
from 38F to 42F, “lower 40s” denotes anywhere from 40F to 44F, “mid 40s” from 43F
to 47F and “upper 40s” from 46F to 49F.
Wind terms are tied to specific ranges too, all related to “sustained wind speed”
(SWS), and they can overlap. “Sustained wind” is defined as the average of
observed wind speeds over a two-minute period.
“High,” “strong” and “damaging” winds are those expected to have SWS of at least
40 miles per hour (mph). “Very windy” denotes when SWS is between 30 and 40
mph, and “windy” between anywhere from 20 to 35 mph.
When the SWS is between 15 and 25 mph, “breezy” is used when the weather is
mild, and “brisk” or “blustery” are used when it is cold. “Calm” and “light” are used to
denote SWS of 5 mph or less.
Wind chill incorporates considerations of how much heat a human body will lose to
the environment on a cold or windy day. Calculations are estimated at weather
conditions at 5 feet above ground level (said to be the typical height of a human
face), and begin when SWS reach 3 mph.
The NWS provides a chart that shows wind chill for any temperature between 40F
and -45F with winds between 5 mph and 60 mph, and it reveals that even a slight
wind, with cold temperatures, can have a big effect on wind chill. For example, at 0F
with only calm winds of 5 mph, the wind chill is -11F. Likewise, even when
temperatures are relatively mild, say at 35F, if the winds are high, say 60 mph, it can
make it feel about half the temperature it really is (17F).
On the other hand, the heat index reflects the fact that when the humidity reaches a
certain point, the perspiration on your skin can’t evaporate, you can’t cool down so
easily, and so the apparent temperature feels hotter than it actually is.
On that note, the NWS provides a heat index chart as well, which shows
temperatures between 80F and 110F and relative humidity (RH) between 40% and
100%. Just as with wind chill, slight changes in a single variable can have a dramatic
effect, and when both are high, the heat index becomes dangerous to human health.
For example, at 90F and 40% RH, the heat index is only 91F, but if it’s soupy
outside, say 95% RH, then the heat index shoots up to 127F.
If you liked this article, you might also enjoy our new popular podcast, The
BrainFood Show (iTunes, Spotify, Google Play Music, Feed), as well as:
 Can Bad Weather Cause Joints to Ache?
 What Causes the Smell After Rain
 Why We Call the Seasons Summer, Autumn, Winter, and Spring
 What Causes Dew?
 The Tale of the Man Who Nearly Drowned While Falling from the Sky
Bonus Fact:
 The Occupational Health and Safety Administration (OSHA) has guidance for using the
heat index to protect workers, and calls for escalating measures as the heat index
increases from “moderate” (91F to 103F) to “high” (103F to 115F) to “extreme” (116F or
greater). At all three levels, OSHA recommends for those in the heat: drinking about 4
cups of water per hour, being prepared for heat illnesses, acclimatizing, wearing
sunscreen and taking frequent, shady breaks. As the heat index moves into “high,”
OSHA also recommends limiting physical exertion and becoming vigilant for heat
related illness. Once the heat index moves into “extreme,” OSHA recommends only
essential tasks be performed, and then only during the coolest time possible.
The major difference between Fog and Mist is that fog is much dense
and thicker as compared to mist. It is sometimes difficult to
understand the difference between both. They both are created by
water droplets. The difference is only in their location and density.
The density of fog is more as compared to mist, thus it lasts longer.
Fog reaches ground level even if it is a hill or mountain. Mist is
created by a temperature inversion, changes in humidity, activities
like a volcano. Fog reduces its visibility to less than one kilometer on
the other side, a mist can reduce till one and two-kilometer. Thus, fog
is much more visible as compared to mist. They both are made from
clouds. Fog lasts longer as compared to mist.
The key differences between fog and mist are as follows
Table of content
1 Difference between Fog and Mist
2 Fog
2.1 Radiation Fog
2.2 Evaporating Fog
2.3 Ice Fog
2.4 Ground Fog
2.5 Freezing Fog
3 Mist
Difference between Fog and Mist
Character Fog Mist
Definition
Fog is defined as the
thick layer of cloud,
that appears at the
surface level, and is a
composition of small
droplets of water
suspended in the air.
Mist is defined as the layer of cloud, that is created due to the
volcanic activities, changes in the level of temperature and
humidity.
Density
The density of fog is
always thick as
compared to mist.
The density of mist is comparatively low as compared to Fog.
Durability
Fog last for longer
period.
Mist last for a short time.
Visibility
It is visible for less
than one kilometre.
It is visible between one to two kilometres.
Fog
Fog is a thick layer of cloud at the lower surface and generally
created by a water body like a lake, moist ground, or ocean. It takes
place when the difference between dew point and air temperature is
less than 2.5 degrees celsius.
Fog is created when gas liquefies into small water droplets that are
suspended in the air.
This process includes the intersection of the water vapor to the air
into the areas of upward motion, daytime heating or evaporating
water from the surface of oceans, or wetland. cool air moving over
mild or hot water, and lifting air over mountains. Water vapor
normally begins to liquefy on the surface of dust, salt, or ice in order
to form clouds.
Fog produces drizzle or very light snow. Drizzle takes place when the
humidity attains 100% and the small droplets turn into large droplets.
Depending upon how the cooling caused, different types of Fog
are formed.
 Radiation Fog
 Evaporating Fog
 Ice Fog
 Ground Fog
 Freezing Fog
Radiation Fog
Radiation fog is created by the cooling of land after sunset, this land
then cools the adjacent air by thermal transmission. This transmission
forces the temperature of the air to fall and reach the dew point. This
creates the fog.
Evaporating Fog
Evaporating Fog is formed by water bodies clad with much cool air.
This situation can create whirlwind over the water. This is also
known as steam fog or dust devil.
Ice Fog
Ice Fog is formed at very low temperatures and also by the moisture
in the air when a group of animals exhales. It can be related to the
ground level composed of small ice crystals. This often takes place in
the blue sky conditions.
Ground Fog
Ground Fog is the fog that covers less than 60% of the sky. The
level of this fog does not extend to the higher clouds. However, this
is similar to the radiation fog. In some cases, the depth of the fog is
on the order of tens of the centimetres over certain lands with the
absence of winds.
Freezing Fog
Freezing Fog is the composition of droplets of super cooled water
that freezes to surface on contact.
Mist
Mist is the situation caused by tiny water droplets suspended in the
air. It occurs when warm and moist air meets sudden cooling. It is
most commonly seen when air is exhaled in the winter or throwing
on a stove or sauna.
Mist can be created with the spray if the humidity and temperature
conditions are right. It also happens when humid air cools rapidly
when air comes in contact with the surface which is cooler than the
air, natural weather. It is most often observed when the droplets of
warm water are suddenly cool down and becomes visible to us. The
most common example is exhaling air in the winter or a cool place.
Reference
https://www.diffen.com/difference/Fog_vs_Mist
https://www.thesun.co.uk/news/2339888/fog-mist-difference/
https://www.vedantu.com/biology/difference-between-fog-and-mist
Fog and mist are both created by water droplets, differing only in
their overall locations and density. Fog is a cloud that reaches
ground level, even if that "ground" is a hill or mountaintop. Mist forms
wherever water droplets are suspended in the air by temperature
inversion, volcanic activity, or changes in humidity. Fog is denser
than mist and tends to last longer. In terms of visibility, fog reduces it
to less than one kilometer (0.6 miles), while mist can reduce visibility
to between 1 and 2 kilometers (0.6 - 1.2 miles).
Comparison chart
Fog versus Mist comparison chart
Fog Mist
Effect on
visibility
Reduces visibility to less than 1 km (1,094 yards) Reduces visibility to between 1 and 2 km
Mist vs. Fog Causes
Fog is formed when any cloud type makes contact with the ground. In low-
lying areas, such as valleys and plains, the fog bank (a mass of fog) is
essentially a cloud formation subject to the same wind and temperature
reactions clouds experience in the upper atmosphere.
Clouds form when water droplets condense and merge, but fail to achieve a
size large enough to precipitate as rain. Clouds will form or drift closer to the
ground when humidity rises or changes abruptly, or when wind speeds drop
or acutely change direction.
Mist is also formed by water droplets, but with less merging or coalescing.
This means mist is less dense and quicker to dissipate when wind,
temperature, or relative humidity changes. Mists can form due to abrupt
temperature changes (such as when exhaling in cold air), high levels of
humidity (in a sauna, for example), or from evaporation or condensation,
such as when rain hits sun-warmed rocks and street surfaces or evening
allows dew to form.
Effects on Visibility
Fog is much denser than mist and thus has a greater effect on visibility. A
person can still see out to about 2 kilometers (1.2 miles) in mist, but a fog will
reduce visibility to under one kilometer (0.6 miles). Dense fogs, usually
caused by rapid changes in humidity or combined with smoke, can reduce
visibility to under 50 meters (60 yards). London's infamous "pea-soup fogs" of
the 19th century were said to reduce visibility to less than 20 feet.
How to Drive Safely in Fog and Mist
When driving in misty conditions, it is important for drivers to use wipers with
care. The water droplets in mist are often not dense enough to require the
constant use of wipers, so intermittent patterns will probably do a better job of
keeping the windshield clear. In foggy conditions, wipers might play a smaller
role to that of fog lights or driving lights. In some dense fogs, headlights or
"long" lights will actually reduce visibility as the light is reflected by the fog
itself. To check for best visibility, a driver should flick between headlights and
fog lights to gauge visibility with each. This also serves as a warning signal to
oncoming drivers.
Driving "past your lights," means that the limit of visibility is constantly
exceeded (the speed is too fast to react to what appears out of the fog or
mist) and one is "driving blind." It is best for drivers to slow down in that
situation. If the driving speed in the fog drops to half of the posted maximum
speed, it is a good idea for drivers to find a safe spot to pull well off the road
and wait for the fog to clear. Many accidents are caused in fog banks by cars
going too slow and being hit from behind. When pulling off the road, drivers
should keep their car's hazard lights flashing for additional safety.
In the following video, driving safety instructor Zundrea Baldwin gives further
tips on how to drive safely in foggy conditions.
References
 Wikipedia: Fog
 Wikipedia: Mist
Oceans are vast bodies of water that cover roughly 70% of the
earth. Seas are smaller and partially enclosed by land. The five oceans of
the earth are in reality one large interconnected water body. In contrast,
there are over 50 smaller seas scattered around the world.
Comparison chart
Ocean versus Sea comparison chart
Ocean Sea
Introduction
(from
Wikipedia)
Though generally described as several
'separate' oceans, these waters comprise
one global, interconnected body of salt
water sometimes referred to as the World
Ocean or global ocean.
A sea generally refers to a large body of salt
water, but the term is used in other contexts
as well. Most commonly, it means a large
expanse of saline water connected with an
ocean, and is commonly used as a synonym for
ocean.
Area
Oceans cover 71% of the Earth's surface, and contain 97 percent of the
planet's water. The Pacific Ocean is the largest ocean covering an area of
64,186,000 square miles and the Mediterranean Sea is the largest sea with
an area of 1,144,800 square miles. In fact even the world’s smallest ocean
Arctic Ocean (5,427,000 square miles) is larger than the Mediterranean.
A map of the world, showing four of the five oceans. The Southern Ocean (not marked
on the map) is around the Antarctic Circle.
List of oceans by size
1. Pacific Ocean: 60,060,700 square miles
2. Atlantic Ocean: 29,637,900 square miles
3. Indian Ocean: 26,469,900 square miles
4. Southern Ocean: 7,848,300 square miles
5. Arctic Ocean: 5,427,000 square miles
Top 6 largest seas
1. Mediterranean Sea: 1,144,800 square miles
2. Caribbean Sea: 1,049,500 square miles
3. South China Sea: 895,400 square miles
4. Bering Sea: 884,900 square miles
5. Gulf of Mexico: 615,000 square miles
6. Okhotsk Sea: 613,800 square miles
Depth
The average depth in oceans is from 3,953ft to 15,215ft. Mariana Trench in
the Pacific Ocean is the deepest, 36,200 ft deep. At 22,788 ft, the Caribbean
Sea is the deepest sea. Most seas are much shallower.
Marine life
Oceans and seas are home to rich and diverse marine life. The depth and
distance from shore strongly influence the quantity and biodiversity of the
plants and animals that live there. As seas are always near land marine life
are abundant while oceans which are deeper and farther away from land
have on few basic life forms like bacteria, microscopic plankton and shrimp.
Zones
Any water in a sea, ocean or lake that is not close to the bottom or near to
the shore can be said to be in the pelagic zone. Areas in the pelagic zone are
distinguished by their depth and the ecology of the zone. It is further divided
into:
 The epipelagic zone (sunlit) is closest to the surface and stretches down to
around 200 m. An abundance of light allows for photosynthesis by plants and
nutrients for animals like tuna external and sharks.
 The mesopelagic zone (twilight) begins at 200 m below the surface and
reaches a depth of 1,000 m. There is a little light but not enough for
photosynthesis to occur.
 The bathypelagic zone (midnight) follows, from 1000-4,000 m in depth.
Bioluminescent organisms are found in this zone. Unique animals like the
marine hatchet fish external and giant squid live in this zone, surviving mostly
on the detritus that drifts down from the epipelagic zone.
 The abyssopelagic zone (lower midnight) is located from 4,000 m to directly
above the ocean floor and is a completely dark area home to colorless and
blind animals.
 The Hadopelagic zone is the deep water in ocean trenches. Some define
the hadopelagic as waters below 6,000 m (19,685 ft), whether in a trench or
not. Very little is known about this zone, and very few species are known to
live here.
The bathypelagic, abyssopelagic, and hadopelagic zones have very similar
characteristics. Because of this some marine biologists combine these three
zones or at least combine the last two.
Climate
The Earth's climate is greatly affected by ocean currents which transfer cold
or warm air to different coastal regions. To learn more about how the ocean
affects the climate, watch the following video by NASA.
References
 What's the difference between an ocean and a sea? - NOAA.gov
 Deepest Oceans and Seas of the World - WorldAtlas.com
 Sizes of Oceans and Seas - InfoPlease
 Wikipedia: Sea
 Wikipedia: Ocean
Winter storms are characterized by snowfall, rain, sleet, and ice etc where
temperatures are below freezing point. A winter storm (or snowstorm) is an
event in which the dominant varieties of precipitation are forms that only
occur at cold temperatures, such as snow or sleet, or a rainstorm where
ground temperatures are cold enough to allow ice to form (i.e. freezing
rain). The difference between a blizzard and winter storms lies in the
presence and strength of winds. Blizzards are massive snow storms with
strong winds.
Comparison chart
Blizzard versus Winter Storm comparison chart
Blizzard Winter Storm
Characteristics Severe storm with strong
winds, severe temperatures
and heavy snow.
Cold storm with low temperature, sleet, snow, rain
and ice formations.
Occurrence Winter Winter, spring, autumn
Blizzard versus Winter Storm comparison chart
Blizzard Winter Storm
Forms of
precipitation
Snow Snow, rime, ice pellets, rain, graupel
Types Traditional and ground
blizzards
Snow storm, Freezing rain storm or wintry mixes.
Effect Blizzard gives rise to a
white out with minimum
visibility.
Avalanches, cornices and spring flooding are
common in winter storms.
Economic
impact
Blizzards harm local
economies and cause
paralysis of normal life for
days.
Infections due to frostbites, death from
hypothermia, power outage, car accidents on
slippery roads, fires, carbon monoxide poisoning
etc lead to disruption of life until conditions
improve.
Satellite image of the United States blanketed by snow in February 2011.
Definition of Blizzard
Blizzard like conditions on I94 from Exit 140 overpass 9 miles west of Mandan in ND.
A winter storm occurs at very cold temperatures and is characterized by variety of
precipitations like snow, sleet, freezing rain, and ice formation. These storms occur
in temperate continental climates during winter, early spring and late autumn. Cold
temperature is a must for a winter storm. A winter storm that is particularly severe
and meets some criteria is called a blizzard.
"Blizzard" has different definitions in different countries. The National Weather
Service of the United States define blizzard as continuous winds blowing at 35mph,
leading to blowing snow causing restricted visibility of ¼ miles and lasting for a
minimum of 3 hours. Even though temperature is not taken into consideration here, it
is usually below 32 ˚F or 0 ˚C. Environment Canada defines blizzard as a snow
storm blowing snow with winds at 25mph, temperature of -25˚C or -15˚F and
visibility of less than 500 feet lasting for over 3 hours. The Met Office in UK defines
blizzards as medium to heavy snow with winds of 30mph and visibility of 650 feet or
less.
From all these definitions it can be inferred that strong winds, heavy snow and
restricted visibility are characteristic of a blizzard.
Types of Blizzards and Winter Storms
Traditional blizzards occur with winds blowing falling snow in all directions while
blizzards with no snow fall are called as ground blizzards. Ground blizzards have
very strong winds which rake up the fallen snow and blow it around. Ground
blizzards usually occur in huge flat expanses of land where there is plenty of loose
powdery snow that can be blown by high and strong winds.
Winter storms can be snow storms, freezing rain storms or wintry mixes.
 Snow Storms – huge amount of snow fall creating serious snow drifts, snow piles etc
leading to disruption to traffic, school transport, and normal life.
 Freezing rain – this is among the most dangerous type of winter storms. There is a
presence of a warm air layer over the region but ground temperature is below
freezing point and ambient temperature of around 0˚ C. During this condition roads
are frozen. Sometimes, plants and infrastructure gets covered by a coat of ice and
then the storm is known as ice storm.
 Wintry Mixes – many a time a combination of rain and sleet is the form of
precipitation seen during winter storms or snow and rain alternate with temperature
ranging between -2˚C and 2˚C.
Impact of Blizzards and Winter Storms
Coated in ice, power and telephone lines sag and often break during a blizzard.
The most common effect of a blizzard is a whiteout. White outs are very common in
the Arctic and Antarctic during spring. White outs occur due to a scientific
phenomenon of sunlight being reflected in all directions by the snow and ice.
Snowflakes, droplets of fog and ice particles suspended in air enhance the effect to
such an extent that sense of direction, perception of depth and balance seem to get
lost. The sky and land appear to have blended with a white sheet encompassing
everything. Blizzards disrupt life and cause loss of lives, lessened productivity due to
inability to reach work places, schools closings, airports are closed, delay in delivery
of products etc.
Winter storms cause havoc in regions affected. Death due to hypothermia and
infections by frost bites are common. Car accidents are on the rise due to slippery
roads and there can be power outages for days on end. Communication can be
disrupted with damage to telephone lines and even crops are ruined. Flying becomes
dangerous with formation of rime and graupel – rime is a collection of cooled cloud
or fog droplets that freezes when it makes contact with an object. Hence when ice
crystals fall through rime, droplets of ice get attached to cloud droplets forming
graupel. Aircrafts are particularly endangered when it passes through a cold cloud
since rime can get formed on its wings.
Winter storm news
References
 wikipedia:Winter storm
 wikipedia:Blizzard

Más contenido relacionado

Similar a terms of geography.docx

Similar a terms of geography.docx (20)

Typhoon Final Presentation.pptx
Typhoon Final Presentation.pptxTyphoon Final Presentation.pptx
Typhoon Final Presentation.pptx
 
Typhoon Haiyan
Typhoon HaiyanTyphoon Haiyan
Typhoon Haiyan
 
understanding-typhoon.pptx
understanding-typhoon.pptxunderstanding-typhoon.pptx
understanding-typhoon.pptx
 
cyclone hazards pdf
cyclone hazards pdfcyclone hazards pdf
cyclone hazards pdf
 
cyclone
cyclonecyclone
cyclone
 
Hurricanes Slide share
Hurricanes Slide shareHurricanes Slide share
Hurricanes Slide share
 
typhoon.pptx
typhoon.pptxtyphoon.pptx
typhoon.pptx
 
G8 k-12 Wind worksheet
G8 k-12 Wind worksheetG8 k-12 Wind worksheet
G8 k-12 Wind worksheet
 
New microsoft word document
New microsoft word documentNew microsoft word document
New microsoft word document
 
Cyclones
CyclonesCyclones
Cyclones
 
TYPHOON GRADE 8
TYPHOON GRADE 8TYPHOON GRADE 8
TYPHOON GRADE 8
 
Typhoon
TyphoonTyphoon
Typhoon
 
Natural Disasters Topic 10 (Cyclones)
Natural Disasters Topic 10 (Cyclones)Natural Disasters Topic 10 (Cyclones)
Natural Disasters Topic 10 (Cyclones)
 
Weather Disturbances (Project in Science)
Weather Disturbances (Project in Science)Weather Disturbances (Project in Science)
Weather Disturbances (Project in Science)
 
Weather disturbance
Weather disturbanceWeather disturbance
Weather disturbance
 
Cyclones as natural hazards
Cyclones as natural hazardsCyclones as natural hazards
Cyclones as natural hazards
 
Hurricane
HurricaneHurricane
Hurricane
 
Tropical Cyclones Grade 5 Science St. Therese.pptx
Tropical Cyclones Grade 5 Science St. Therese.pptxTropical Cyclones Grade 5 Science St. Therese.pptx
Tropical Cyclones Grade 5 Science St. Therese.pptx
 
Typhoons in the philippines
Typhoons in the philippinesTyphoons in the philippines
Typhoons in the philippines
 
Understanding typhoonstyphoontyphoontyphoon
Understanding typhoonstyphoontyphoontyphoonUnderstanding typhoonstyphoontyphoontyphoon
Understanding typhoonstyphoontyphoontyphoon
 

Más de G.V.M.GIRLS COLLEGE SONEPAT

मेरी फसल मेरा ब्यौरा 2022.docx
मेरी फसल मेरा ब्यौरा 2022.docxमेरी फसल मेरा ब्यौरा 2022.docx
मेरी फसल मेरा ब्यौरा 2022.docxG.V.M.GIRLS COLLEGE SONEPAT
 
4-2-measuring-development-hdi-country-comparisons-activity.docx
4-2-measuring-development-hdi-country-comparisons-activity.docx4-2-measuring-development-hdi-country-comparisons-activity.docx
4-2-measuring-development-hdi-country-comparisons-activity.docxG.V.M.GIRLS COLLEGE SONEPAT
 
The current social and economic structure in India means that.docx
The current social and economic structure in India means that.docxThe current social and economic structure in India means that.docx
The current social and economic structure in India means that.docxG.V.M.GIRLS COLLEGE SONEPAT
 
NATIONAL POLICY FOR THE EMPOWERMENT OF WOMEN.docx
NATIONAL POLICY FOR THE EMPOWERMENT OF WOMEN.docxNATIONAL POLICY FOR THE EMPOWERMENT OF WOMEN.docx
NATIONAL POLICY FOR THE EMPOWERMENT OF WOMEN.docxG.V.M.GIRLS COLLEGE SONEPAT
 

Más de G.V.M.GIRLS COLLEGE SONEPAT (20)

मेरी फसल मेरा ब्यौरा 2022.docx
मेरी फसल मेरा ब्यौरा 2022.docxमेरी फसल मेरा ब्यौरा 2022.docx
मेरी फसल मेरा ब्यौरा 2022.docx
 
PM Kisan Registration 2023(1).pdf
PM Kisan Registration 2023(1).pdfPM Kisan Registration 2023(1).pdf
PM Kisan Registration 2023(1).pdf
 
PM Antyodaya Anna Yojana.docx
PM Antyodaya Anna Yojana.docxPM Antyodaya Anna Yojana.docx
PM Antyodaya Anna Yojana.docx
 
PM Antyodaya Anna Yojana.docx
PM Antyodaya Anna Yojana.docxPM Antyodaya Anna Yojana.docx
PM Antyodaya Anna Yojana.docx
 
HARYANA ECONOMIC SURVEY ANALYSIS..docx
HARYANA ECONOMIC SURVEY ANALYSIS..docxHARYANA ECONOMIC SURVEY ANALYSIS..docx
HARYANA ECONOMIC SURVEY ANALYSIS..docx
 
HARYANA ECONOMIC SURVEY ANALYSIS..docx
HARYANA ECONOMIC SURVEY ANALYSIS..docxHARYANA ECONOMIC SURVEY ANALYSIS..docx
HARYANA ECONOMIC SURVEY ANALYSIS..docx
 
PM Modi pension Yojana.pdf
PM Modi  pension Yojana.pdfPM Modi  pension Yojana.pdf
PM Modi pension Yojana.pdf
 
PM Modi Yojana.docx
PM Modi Yojana.docxPM Modi Yojana.docx
PM Modi Yojana.docx
 
4-2-measuring-development-hdi-country-comparisons-activity.docx
4-2-measuring-development-hdi-country-comparisons-activity.docx4-2-measuring-development-hdi-country-comparisons-activity.docx
4-2-measuring-development-hdi-country-comparisons-activity.docx
 
ENVIRONMENT.docx
ENVIRONMENT.docxENVIRONMENT.docx
ENVIRONMENT.docx
 
TERMINOLOGY OF GEOGRAPHY.docx
TERMINOLOGY OF GEOGRAPHY.docxTERMINOLOGY OF GEOGRAPHY.docx
TERMINOLOGY OF GEOGRAPHY.docx
 
TERMINOLOGY OF GEOGRAPHY.docx
TERMINOLOGY OF GEOGRAPHY.docxTERMINOLOGY OF GEOGRAPHY.docx
TERMINOLOGY OF GEOGRAPHY.docx
 
Urban Cities and Disaster Management.docx
Urban Cities and Disaster Management.docxUrban Cities and Disaster Management.docx
Urban Cities and Disaster Management.docx
 
What is an Earthquake.docx
What is an Earthquake.docxWhat is an Earthquake.docx
What is an Earthquake.docx
 
Urban Cities and Disaster Management.docx
Urban Cities and Disaster Management.docxUrban Cities and Disaster Management.docx
Urban Cities and Disaster Management.docx
 
CLIMATE CHANGE IN THE WORLD.
CLIMATE CHANGE IN THE WORLD.CLIMATE CHANGE IN THE WORLD.
CLIMATE CHANGE IN THE WORLD.
 
The current social and economic structure in India means that.docx
The current social and economic structure in India means that.docxThe current social and economic structure in India means that.docx
The current social and economic structure in India means that.docx
 
List of Women Empowerment Schemes in India.docx
List of Women Empowerment Schemes in India.docxList of Women Empowerment Schemes in India.docx
List of Women Empowerment Schemes in India.docx
 
NATIONAL POLICY FOR THE EMPOWERMENT OF WOMEN.docx
NATIONAL POLICY FOR THE EMPOWERMENT OF WOMEN.docxNATIONAL POLICY FOR THE EMPOWERMENT OF WOMEN.docx
NATIONAL POLICY FOR THE EMPOWERMENT OF WOMEN.docx
 
WOMEN EMPOWERMENT 2015..docx
WOMEN EMPOWERMENT 2015..docxWOMEN EMPOWERMENT 2015..docx
WOMEN EMPOWERMENT 2015..docx
 

Último

Computed Fields and api Depends in the Odoo 17
Computed Fields and api Depends in the Odoo 17Computed Fields and api Depends in the Odoo 17
Computed Fields and api Depends in the Odoo 17Celine George
 
Q4 English4 Week3 PPT Melcnmg-based.pptx
Q4 English4 Week3 PPT Melcnmg-based.pptxQ4 English4 Week3 PPT Melcnmg-based.pptx
Q4 English4 Week3 PPT Melcnmg-based.pptxnelietumpap1
 
How to do quick user assign in kanban in Odoo 17 ERP
How to do quick user assign in kanban in Odoo 17 ERPHow to do quick user assign in kanban in Odoo 17 ERP
How to do quick user assign in kanban in Odoo 17 ERPCeline George
 
Choosing the Right CBSE School A Comprehensive Guide for Parents
Choosing the Right CBSE School A Comprehensive Guide for ParentsChoosing the Right CBSE School A Comprehensive Guide for Parents
Choosing the Right CBSE School A Comprehensive Guide for Parentsnavabharathschool99
 
How to Add Barcode on PDF Report in Odoo 17
How to Add Barcode on PDF Report in Odoo 17How to Add Barcode on PDF Report in Odoo 17
How to Add Barcode on PDF Report in Odoo 17Celine George
 
call girls in Kamla Market (DELHI) 🔝 >༒9953330565🔝 genuine Escort Service 🔝✔️✔️
call girls in Kamla Market (DELHI) 🔝 >༒9953330565🔝 genuine Escort Service 🔝✔️✔️call girls in Kamla Market (DELHI) 🔝 >༒9953330565🔝 genuine Escort Service 🔝✔️✔️
call girls in Kamla Market (DELHI) 🔝 >༒9953330565🔝 genuine Escort Service 🔝✔️✔️9953056974 Low Rate Call Girls In Saket, Delhi NCR
 
ANG SEKTOR NG agrikultura.pptx QUARTER 4
ANG SEKTOR NG agrikultura.pptx QUARTER 4ANG SEKTOR NG agrikultura.pptx QUARTER 4
ANG SEKTOR NG agrikultura.pptx QUARTER 4MiaBumagat1
 
Full Stack Web Development Course for Beginners
Full Stack Web Development Course  for BeginnersFull Stack Web Development Course  for Beginners
Full Stack Web Development Course for BeginnersSabitha Banu
 
USPS® Forced Meter Migration - How to Know if Your Postage Meter Will Soon be...
USPS® Forced Meter Migration - How to Know if Your Postage Meter Will Soon be...USPS® Forced Meter Migration - How to Know if Your Postage Meter Will Soon be...
USPS® Forced Meter Migration - How to Know if Your Postage Meter Will Soon be...Postal Advocate Inc.
 
ECONOMIC CONTEXT - LONG FORM TV DRAMA - PPT
ECONOMIC CONTEXT - LONG FORM TV DRAMA - PPTECONOMIC CONTEXT - LONG FORM TV DRAMA - PPT
ECONOMIC CONTEXT - LONG FORM TV DRAMA - PPTiammrhaywood
 
ENGLISH6-Q4-W3.pptxqurter our high choom
ENGLISH6-Q4-W3.pptxqurter our high choomENGLISH6-Q4-W3.pptxqurter our high choom
ENGLISH6-Q4-W3.pptxqurter our high choomnelietumpap1
 
ECONOMIC CONTEXT - PAPER 1 Q3: NEWSPAPERS.pptx
ECONOMIC CONTEXT - PAPER 1 Q3: NEWSPAPERS.pptxECONOMIC CONTEXT - PAPER 1 Q3: NEWSPAPERS.pptx
ECONOMIC CONTEXT - PAPER 1 Q3: NEWSPAPERS.pptxiammrhaywood
 
Science 7 Quarter 4 Module 2: Natural Resources.pptx
Science 7 Quarter 4 Module 2: Natural Resources.pptxScience 7 Quarter 4 Module 2: Natural Resources.pptx
Science 7 Quarter 4 Module 2: Natural Resources.pptxMaryGraceBautista27
 
HỌC TỐT TIẾNG ANH 11 THEO CHƯƠNG TRÌNH GLOBAL SUCCESS ĐÁP ÁN CHI TIẾT - CẢ NĂ...
HỌC TỐT TIẾNG ANH 11 THEO CHƯƠNG TRÌNH GLOBAL SUCCESS ĐÁP ÁN CHI TIẾT - CẢ NĂ...HỌC TỐT TIẾNG ANH 11 THEO CHƯƠNG TRÌNH GLOBAL SUCCESS ĐÁP ÁN CHI TIẾT - CẢ NĂ...
HỌC TỐT TIẾNG ANH 11 THEO CHƯƠNG TRÌNH GLOBAL SUCCESS ĐÁP ÁN CHI TIẾT - CẢ NĂ...Nguyen Thanh Tu Collection
 
Earth Day Presentation wow hello nice great
Earth Day Presentation wow hello nice greatEarth Day Presentation wow hello nice great
Earth Day Presentation wow hello nice greatYousafMalik24
 
ENGLISH 7_Q4_LESSON 2_ Employing a Variety of Strategies for Effective Interp...
ENGLISH 7_Q4_LESSON 2_ Employing a Variety of Strategies for Effective Interp...ENGLISH 7_Q4_LESSON 2_ Employing a Variety of Strategies for Effective Interp...
ENGLISH 7_Q4_LESSON 2_ Employing a Variety of Strategies for Effective Interp...JhezDiaz1
 

Último (20)

Computed Fields and api Depends in the Odoo 17
Computed Fields and api Depends in the Odoo 17Computed Fields and api Depends in the Odoo 17
Computed Fields and api Depends in the Odoo 17
 
Q4 English4 Week3 PPT Melcnmg-based.pptx
Q4 English4 Week3 PPT Melcnmg-based.pptxQ4 English4 Week3 PPT Melcnmg-based.pptx
Q4 English4 Week3 PPT Melcnmg-based.pptx
 
FINALS_OF_LEFT_ON_C'N_EL_DORADO_2024.pptx
FINALS_OF_LEFT_ON_C'N_EL_DORADO_2024.pptxFINALS_OF_LEFT_ON_C'N_EL_DORADO_2024.pptx
FINALS_OF_LEFT_ON_C'N_EL_DORADO_2024.pptx
 
YOUVE_GOT_EMAIL_PRELIMS_EL_DORADO_2024.pptx
YOUVE_GOT_EMAIL_PRELIMS_EL_DORADO_2024.pptxYOUVE_GOT_EMAIL_PRELIMS_EL_DORADO_2024.pptx
YOUVE_GOT_EMAIL_PRELIMS_EL_DORADO_2024.pptx
 
How to do quick user assign in kanban in Odoo 17 ERP
How to do quick user assign in kanban in Odoo 17 ERPHow to do quick user assign in kanban in Odoo 17 ERP
How to do quick user assign in kanban in Odoo 17 ERP
 
Model Call Girl in Tilak Nagar Delhi reach out to us at 🔝9953056974🔝
Model Call Girl in Tilak Nagar Delhi reach out to us at 🔝9953056974🔝Model Call Girl in Tilak Nagar Delhi reach out to us at 🔝9953056974🔝
Model Call Girl in Tilak Nagar Delhi reach out to us at 🔝9953056974🔝
 
Choosing the Right CBSE School A Comprehensive Guide for Parents
Choosing the Right CBSE School A Comprehensive Guide for ParentsChoosing the Right CBSE School A Comprehensive Guide for Parents
Choosing the Right CBSE School A Comprehensive Guide for Parents
 
How to Add Barcode on PDF Report in Odoo 17
How to Add Barcode on PDF Report in Odoo 17How to Add Barcode on PDF Report in Odoo 17
How to Add Barcode on PDF Report in Odoo 17
 
call girls in Kamla Market (DELHI) 🔝 >༒9953330565🔝 genuine Escort Service 🔝✔️✔️
call girls in Kamla Market (DELHI) 🔝 >༒9953330565🔝 genuine Escort Service 🔝✔️✔️call girls in Kamla Market (DELHI) 🔝 >༒9953330565🔝 genuine Escort Service 🔝✔️✔️
call girls in Kamla Market (DELHI) 🔝 >༒9953330565🔝 genuine Escort Service 🔝✔️✔️
 
ANG SEKTOR NG agrikultura.pptx QUARTER 4
ANG SEKTOR NG agrikultura.pptx QUARTER 4ANG SEKTOR NG agrikultura.pptx QUARTER 4
ANG SEKTOR NG agrikultura.pptx QUARTER 4
 
TataKelola dan KamSiber Kecerdasan Buatan v022.pdf
TataKelola dan KamSiber Kecerdasan Buatan v022.pdfTataKelola dan KamSiber Kecerdasan Buatan v022.pdf
TataKelola dan KamSiber Kecerdasan Buatan v022.pdf
 
Full Stack Web Development Course for Beginners
Full Stack Web Development Course  for BeginnersFull Stack Web Development Course  for Beginners
Full Stack Web Development Course for Beginners
 
USPS® Forced Meter Migration - How to Know if Your Postage Meter Will Soon be...
USPS® Forced Meter Migration - How to Know if Your Postage Meter Will Soon be...USPS® Forced Meter Migration - How to Know if Your Postage Meter Will Soon be...
USPS® Forced Meter Migration - How to Know if Your Postage Meter Will Soon be...
 
ECONOMIC CONTEXT - LONG FORM TV DRAMA - PPT
ECONOMIC CONTEXT - LONG FORM TV DRAMA - PPTECONOMIC CONTEXT - LONG FORM TV DRAMA - PPT
ECONOMIC CONTEXT - LONG FORM TV DRAMA - PPT
 
ENGLISH6-Q4-W3.pptxqurter our high choom
ENGLISH6-Q4-W3.pptxqurter our high choomENGLISH6-Q4-W3.pptxqurter our high choom
ENGLISH6-Q4-W3.pptxqurter our high choom
 
ECONOMIC CONTEXT - PAPER 1 Q3: NEWSPAPERS.pptx
ECONOMIC CONTEXT - PAPER 1 Q3: NEWSPAPERS.pptxECONOMIC CONTEXT - PAPER 1 Q3: NEWSPAPERS.pptx
ECONOMIC CONTEXT - PAPER 1 Q3: NEWSPAPERS.pptx
 
Science 7 Quarter 4 Module 2: Natural Resources.pptx
Science 7 Quarter 4 Module 2: Natural Resources.pptxScience 7 Quarter 4 Module 2: Natural Resources.pptx
Science 7 Quarter 4 Module 2: Natural Resources.pptx
 
HỌC TỐT TIẾNG ANH 11 THEO CHƯƠNG TRÌNH GLOBAL SUCCESS ĐÁP ÁN CHI TIẾT - CẢ NĂ...
HỌC TỐT TIẾNG ANH 11 THEO CHƯƠNG TRÌNH GLOBAL SUCCESS ĐÁP ÁN CHI TIẾT - CẢ NĂ...HỌC TỐT TIẾNG ANH 11 THEO CHƯƠNG TRÌNH GLOBAL SUCCESS ĐÁP ÁN CHI TIẾT - CẢ NĂ...
HỌC TỐT TIẾNG ANH 11 THEO CHƯƠNG TRÌNH GLOBAL SUCCESS ĐÁP ÁN CHI TIẾT - CẢ NĂ...
 
Earth Day Presentation wow hello nice great
Earth Day Presentation wow hello nice greatEarth Day Presentation wow hello nice great
Earth Day Presentation wow hello nice great
 
ENGLISH 7_Q4_LESSON 2_ Employing a Variety of Strategies for Effective Interp...
ENGLISH 7_Q4_LESSON 2_ Employing a Variety of Strategies for Effective Interp...ENGLISH 7_Q4_LESSON 2_ Employing a Variety of Strategies for Effective Interp...
ENGLISH 7_Q4_LESSON 2_ Employing a Variety of Strategies for Effective Interp...
 

terms of geography.docx

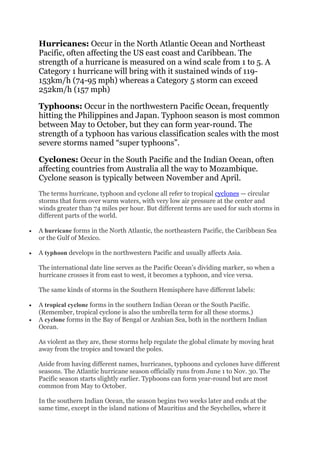
  • 1. Hurricanes: Occur in the North Atlantic Ocean and Northeast Pacific, often affecting the US east coast and Caribbean. The strength of a hurricane is measured on a wind scale from 1 to 5. A Category 1 hurricane will bring with it sustained winds of 119- 153km/h (74-95 mph) whereas a Category 5 storm can exceed 252km/h (157 mph) Typhoons: Occur in the northwestern Pacific Ocean, frequently hitting the Philippines and Japan. Typhoon season is most common between May to October, but they can form year-round. The strength of a typhoon has various classification scales with the most severe storms named “super typhoons”. Cyclones: Occur in the South Pacific and the Indian Ocean, often affecting countries from Australia all the way to Mozambique. Cyclone season is typically between November and April. The terms hurricane, typhoon and cyclone all refer to tropical cyclones — circular storms that form over warm waters, with very low air pressure at the center and winds greater than 74 miles per hour. But different terms are used for such storms in different parts of the world.  A hurricane forms in the North Atlantic, the northeastern Pacific, the Caribbean Sea or the Gulf of Mexico.  A typhoon develops in the northwestern Pacific and usually affects Asia. The international date line serves as the Pacific Ocean’s dividing marker, so when a hurricane crosses it from east to west, it becomes a typhoon, and vice versa. The same kinds of storms in the Southern Hemisphere have different labels:  A tropical cyclone forms in the southern Indian Ocean or the South Pacific. (Remember, tropical cyclone is also the umbrella term for all these storms.)  A cyclone forms in the Bay of Bengal or Arabian Sea, both in the northern Indian Ocean. As violent as they are, these storms help regulate the global climate by moving heat away from the tropics and toward the poles. Aside from having different names, hurricanes, typhoons and cyclones have different seasons. The Atlantic hurricane season officially runs from June 1 to Nov. 30. The Pacific season starts slightly earlier. Typhoons can form year-round but are most common from May to October. In the southern Indian Ocean, the season begins two weeks later and ends at the same time, except in the island nations of Mauritius and the Seychelles, where it
  • 2. begins May 15. Cyclones in the northern Indian Ocean have no official season but tend to be concentrated from May to November. Tropical cyclones generally become weaker after they arrive on land, since they draw their energy from the evaporation of water in the oceans below them. But they can travel quite far inland before they dissipate, wreaking havoc through wind damage, torrential rains and flooding. Storms whose winds are not quite strong enough to qualify as tropical cyclones are called tropical storms if their sustained wind speeds are 39 to 73 miles an hour. They are called tropical depressions — a reference to the low pressure at their core — when the speeds are below that range. Tropical cyclones around the world are named according to a list maintained by the World Meteorological Organization. The names of the deadliest storms, like Typhoon Haiyan or Hurricane Katrina, are retired. A cyclone is any mass of air that spirals around a low pressure center. It is an organized collection of thunderstorms embedded in a swirling mass of air. In general, both typhoons and hurricanes are tropical cyclones but differ in their locations. The difference between hurricane and typhoon is that tropical cyclones in the west Pacific are called Typhoons and those in the Atlantic and east Pacific Ocean are called Hurricanes. It's the longitude that matters. Comparison chart Differences — Similarities — Hurricane versus Typhoon comparison chart Hurricane Typhoon About A hurricane is a cyclone that is located in the North Atlantic Ocean, or the NE Pacific Ocean east of the International Date Line, or the South Pacific Ocean east of 160E, and with sustained winds that reach or exceed 74 mph. Tropical cyclones in the Northwest Pacific Ocean west of the International Date Line with sustained winds of (or those that exceed) 74 mph are typhoons. Rotation Clockwise in the southern hemisphere and counterclockwise in the northern hemisphere Clockwise in the southern hemisphere and counterclockwise in the northern hemisphere Intensity Hurricanes are classified into five categories according to the Saffir- Typhoons are generally very strong because of the Pacific’s warm water,
  • 3. Hurricane versus Typhoon comparison chart Hurricane Typhoon Simpson Hurricane Wind Scale. The wind speed and intensity of damage increases as from category 1 to category 5. and therefore are more frequent. They are also classified on the Saffir-Simpson Hurricane Wind Scale, but can also be classified on the Japan Meteorological Agency typhoon scal Location North Atlantic Ocean, the Northeast Pacific Ocean east of the International Date Line, or the South Pacific Ocean east of 160E. Hurricanes are found near the tropical zone, over warm waters in the Atlantic and Pacific ocean. Northwest Pacific Ocean west of the International Date Line Most affected areas Caribbean Sea South East Asia, China Sea etc. Frequency 10-15 per year 25-30 per year Occurrence Usually warm areas Usually warm areas Characteristics Heavy winds, floods, storm surge, a lot of rain, tornadoes Heavy winds, floods, storm surge, a lot of rain, tornadoes Forms of precipitation Rain Rain Hurricane Irene as seen from space Speed of a Typhoon vs. Hurricane A tropical cyclone is one in which the maximum sustained surface wind (using the U.S. 1-minute average) is generally 64 kt (74 mph or 119 km/hr) or more.
  • 4. Differences in Location The term hurricane is used for Northern Hemisphere tropical cyclones east of the International Date Lineto the Greenwich Meridian. The term typhoon is used for Pacific tropical cyclones north of the Equator west of the International Date Line i.e. between 100E and 180E in the northern hemisphere. Hurricane Isaac as seen from a NASA satellite on August 28, 2012. Differences in Intensity Typhoons are generally stronger than hurricanes. This is because of warmer water in the western Pacific which creates better conditions for development of a storm. This unlimited amount of warm water also makes for increased frequency of typhoons. Even the wind intensity in a typhoon is stronger than that of a hurricane but they cause comparatively lesser loss due to their location. However, both use the Saffir-Simpson Hurricane Wind Scale for classification. Direction of Rotation Some reports also suggest that typhoons can only be counterclockwise ("anti-clockwise" in British English) while hurricanes can be both anti- clockwise and clockwise. Areas where hurricanes and typhoons occur Figures suggest the most common area for a Hurricane to occur is the Caribbean Sea while typhoons have a frequent occurrence off the coast of South East Asia. Intensity Categories Typhoons are tropical cyclones and are classified differently in various countries. Here's how Japan classifies typhoons:
  • 5. Japan Meteorological Agency's Tropical Cyclone Intensity Scale Category Sustained winds Violent Typhoon ≥105 knots ≥194 km/h Very Strong Typhoon 85–104 knots 157–193 km/h Typhoon 64–84 knots 118–156 km/h Severe Tropical Storm 48–63 knots 89–117 km/h Tropical Storm 34–47 knots 62–88 km/h Tropical Depression ≤33 knots ≤61 km/h Hurricanes are classified into 5 intensity categories using the Saffir-Simpson scale. Saffir–Simpson scale Category Wind speeds (for 1-minute maximum sustained winds) meters per second knots miles per hour kilometers per hour Five ≥ 70 m/s ≥ 137 kn ≥ 157 mph ≥ 252 km/h Four 58–70 m/s 113–136 kn 130–156 mph 209–251 km/h Three 50–58 m/s 96–112 kn 111–129 mph 178–208 km/h Two 43–49 m/s 83–95 kn 96–110 mph 154–177 km/h One 33–42 m/s 64–82 kn 74–95 mph 119–153 km/h
  • 6. Category 1 hurricanes cause minimal damage, category 2 cause moderate damage, category 3 cause extensive damage, category 4 hurricanes cause extreme damage, and category 5 hurricanes cause catastrophic damage. Names of hurricanes and typhoons Some commonly occurring hurricanes and typhoons have been named to categorize them. The names of Hurricanes are given each year. A few hurricanes named in the Atlantic in 2007 are Andrea, Barry and Dean. Some Typhoons named in the Western North Pacific and the South China Sea are Damrey, Langwang and Kirogi. Typhoons in the Chinese and Japanese regions are named after living things and often objects like flowers, rivers etc. Check out every hurricane name since 1950. About: A tornado is a rotating column of air ranging in width from a few yards to more than a mile and whirling at destructively high speeds, usually accompanied by a funnel-shaped downward extension of a cumulonimbus cloud. Winds 40- 300+ mph. Rotation: Clockwise in the southern hemisphere and counterclockwise in the northern hemisphere Intensity: The scale used for rating the strength of tornadoes is called the Fujita (F), Enhanced Fujita (EF), and TORRO (T) Scale. Location: Tornados have been spotted in all continents except Antarctica. Most affected areas: In areas where a convergence of cold and warm fronts is common. i.e. US Midwest.
  • 7. Frequency: The United States records about 1200 tornadoes per year, whereas the Netherlands records the highest number of tornadoes per area compared to other countries. Tornadoes occur commonly in spring and the fall season and are less common in winters Occurrence: Places where cold and warm fronts converge. Can be just almost anywhere. Characteristics: Very strong cyclonic winds, very heavy rain, large hail, strong cloud to ground lightning. Forms of precipitation: Rain, sleet, and hail Number of convective storms: One Temperature gradient required: Large Life span: In minutes Size: Diameter of hundreds of meters Amount of warning: Minutes to hours. The conditions for the possibility of a tornado can be predicted hours before an event, however, tornadoes rarely leave much more than a couple minutes warning. And sometimes none.
  • 8. Shape: Cone shape. Tidal waves are waves created by the gravitational forces of the sun or moon, and cause changes in the level of water bodies. Tsunami is also a series of water waves that are caused because of the displacement of large bodies of water, but due to seismic disturbances. Comparison chart Tidal Wave versus Tsunami comparison chart Tidal Wave Tsunami About Tidal waves are waves created by the gravitational forces of the sun or moon, and cause changes in the level of water bodies. Tsunami is a series of water waves caused by the displacement of large bodies of water. They generally have low amplitude but a high (a few hundred km long) wavelength. Tsunamis generally go unnoticed at sea but prominent in shallow waters or land. Cause Tidal waves are caused due to the gravitational force exerted by the sun and the moon. Tsunamis are generated by earthquakes, erupting submarine volcanoes or due to any gas bubble erupting in the sea or ocean. Intensity The intensity of a changing tide is noticeable only in certain parts where it’s high enough (As high as 55 feet in the Bay of Fundy, Canada). Tsunamis can have wavelengths of up to 200 kilometres and can travel over 800 kilometres per hour. When tsunamis approach shallow water near land masses, the speed decreases, and the amplitude increases very rapidly. Location Tidal waves are phenomena seen most at coastal areas. A majority of tsunamis (80%) occur in the Pacific Ocean but can occur in any large body of water if the underlying causes are present. Frequency Tidal waves occur daily at a coastal area. Tsunamis occur only when there is seismic disturbance in large water bodies. About Tidal waves are ocean waves that occur periodically and depend on the relative position of the Earth and the Moon. This is the reason why the arrival of the tide differs each day. The height of the tidal wave is determined by the gravitational force exerted by the moon; hence it is highest during new and full phases of the moon and
  • 9. lowest during the quarter phases of the moon. The costal areas experience two high and two low tides daily. Tsunamis were erroneously referred to as tidal waves in the past, but they are not related to tide formation and can occur in any tidal state. In Japanese, tsunami translates to "harbor wave" as this phenomenon is seen more commonly seen in the coastal areas. In early geographic texts, tsunami was also referred to as seismic sea waves. Tsunamis generally have low amplitude but a high wavelength, which can be a few hundred kilometres long. Tsunamis generally go unnoticed at sea but prominent in shallow waters or land. Cause Tidal waves are caused due to both the sun and the moon, but due to the close distance between the earth and moon, the effect moon has on tidal waves is much greater than the sun. Tsunamis can be generated by earthquakes, erupting submarine volcanoes or due to any gas bubble erupting in the sea or ocean. These causes have the potential of creating tsunamis provided it occurs just below the body of water, is of moderate amplitude or displaces a large volume of water. Intensity and Damage The intensity of a changing tide is noticeable only in certain parts where it’s high enough (the Bay of Fundy in Canada where it reached as high as 55 feet). Strong tides have the potential to cause damage to the houses on the beach and can result in flooding. Tsunamis can have wavelengths of up to 200 kilometres and can travel over 800 kilometres per hour. When tsunamis approach shallow water near land masses, the speed decreases, and the amplitude increases very rapidly. The scale used to measure tsunamis is Sieberg-Ambraseys scale and the Imamura-Iida scale used for tsunamis in the Mediterranean sea and Pacific ocean, respectively. The magnitude of tsunamis is measured by the ML (Murty and Loomis). Tsunamis can cause extensive damage. These powerful waves can destroy entire villages, and drown anything that comes in its way. An effective way to prevent damage is to plant sturdy trees along the shoreline which are able to withstand the force of these waves. Location Tidal waves are phenomenon seen at most coastal areas. A majority of tsunamis (80%) occur in the Pacific Ocean but can occur in any large body of water if the underlying causes are present. Frequency
  • 10. Tidal waves occur on a daily basis in most coastal area, whereas tsunamis occur as when there is seismic disturbance in large water bodies. Although tsunamis cannot be accurately predicted, there are some warning signs that can be used to save lives. Tidal waves are waves created by the gravitational forces of the sun or moon, and cause changes in the level of water bodies. Tsunami is also a series of water waves that are caused because of the displacement of large bodies of water, but due to seismic disturbances. Comparison chart Tidal Wave versus Tsunami comparison chart Tidal Wave Tsunami About Tidal waves are waves created by the gravitational forces of the sun or moon, and cause changes in the level of water bodies. Tsunami is a series of water waves caused by the displacement of large bodies of water. They generally have low amplitude but a high (a few hundred km long) wavelength. Tsunamis generally go unnoticed at sea but prominent in shallow waters or land. Cause Tidal waves are caused due to the gravitational force exerted by the sun and the moon. Tsunamis are generated by earthquakes, erupting submarine volcanoes or due to any gas bubble erupting in the sea or ocean. Intensity The intensity of a changing tide is noticeable only in certain parts where it’s high enough (As high as 55 feet in the Bay of Fundy, Canada). Tsunamis can have wavelengths of up to 200 kilometres and can travel over 800 kilometres per hour. When tsunamis approach shallow water near land masses, the speed decreases, and the amplitude increases very rapidly. Location Tidal waves are phenomena seen most at coastal areas. A majority of tsunamis (80%) occur in the Pacific Ocean but can occur in any large body of water if the underlying causes are present. Frequency Tidal waves occur daily at a coastal area. Tsunamis occur only when there is seismic disturbance in large water bodies. About Tidal waves are ocean waves that occur periodically and depend on the relative position of the Earth and the Moon. This is the reason why the arrival of the tide differs each day. The height of the tidal wave is determined by the gravitational force exerted by the moon; hence it is highest during new and full phases of the moon and lowest during the quarter phases of the moon. The costal areas experience two high and two low tides daily.
  • 11. Tsunamis were erroneously referred to as tidal waves in the past, but they are not related to tide formation and can occur in any tidal state. In Japanese, tsunami translates to "harbor wave" as this phenomenon is seen more commonly seen in the coastal areas. In early geographic texts, tsunami was also referred to as seismic sea waves. Tsunamis generally have low amplitude but a high wavelength, which can be a few hundred kilometres long. Tsunamis generally go unnoticed at sea but prominent in shallow waters or land. Cause Tidal waves are caused due to both the sun and the moon, but due to the close distance between the earth and moon, the effect moon has on tidal waves is much greater than the sun. Tsunamis can be generated by earthquakes, erupting submarine volcanoes or due to any gas bubble erupting in the sea or ocean. These causes have the potential of creating tsunamis provided it occurs just below the body of water, is of moderate amplitude or displaces a large volume of water. Intensity and Damage The intensity of a changing tide is noticeable only in certain parts where it’s high enough (the Bay of Fundy in Canada where it reached as high as 55 feet). Strong tides have the potential to cause damage to the houses on the beach and can result in flooding. Tsunamis can have wavelengths of up to 200 kilometres and can travel over 800 kilometres per hour. When tsunamis approach shallow water near land masses, the speed decreases, and the amplitude increases very rapidly. The scale used to measure tsunamis is Sieberg-Ambraseys scale and the Imamura-Iida scale used for tsunamis in the Mediterranean sea and Pacific ocean, respectively. The magnitude of tsunamis is measured by the ML (Murty and Loomis). Tsunamis can cause extensive damage. These powerful waves can destroy entire villages, and drown anything that comes in its way. An effective way to prevent damage is to plant sturdy trees along the shoreline which are able to withstand the force of these waves. Location Tidal waves are phenomenon seen at most coastal areas. A majority of tsunamis (80%) occur in the Pacific Ocean but can occur in any large body of water if the underlying causes are present. Frequency
  • 12. Tidal waves occur on a daily basis in most coastal area, whereas tsunamis occur as when there is seismic disturbance in large water bodies. Although tsunamis cannot be accurately predicted, there are some warning signs that can be used to save lives. References  Causes of tsunamis - Wikipedia  What is a tidal wave - NOAA.gov  What is the difference between a tsunami and a tidal wave? - USGS.gov Weather is the day-to-day state of the atmosphere in a region and its short- term (minutes to weeks) variations, whereas climate is defined as statistical weather information that describes the variation of weather at a given place for a specified interval. They are both used interchangeably sometimes but differ in terms of the length of time they measure and what trends affect them. Weather is the combination of temperature, humidity, precipitation, cloudiness, visibility, and wind. In popular usage, climate represents the synthesis of weather; more formally, it is the weather of a locality averaged over some period (usually 30 years), plus statistics of weather extremes. In a 2012 survey, a majority of Americans blamed global warming (or "climate change") for erratic weather patterns in the country, especially heat waves.[1] Comparison chart Climate versus Weather comparison chart Climate Weather Definition Describes the average conditions expected at a specific place at a given time.A region's climate is generated by the climate system, which has five components: atmosphere, hydrosphere, cryosphere, land surface, and biosphere. Describes the atmospheric conditions at a specific place at a specific point in time. Weather generally refers to day- to-day temperature and precipitation activity Components Climate may include precipitation, temperature, humidity, sunshine, wind velocity, phenomena such as fog, frost, and hail storms over a long period of time. Weather includes sunshine, rain, cloud cover, winds, hail, snow, sleet, freezing rain, flooding, blizzards, ice storms, thunderstorms, steady rains from a cold front or warm front, excessive heat, heat waves and more
  • 13. Climate versus Weather comparison chart Climate Weather Forecast By aggregates of weather statistics over periods of 30 years By collecting meteorological data, like air temperature, pressure, humidity, solar radiation, wind speeds and direction etc. Determining factors Aggregating weather statistics over periods of 30 years ("climate normals"). Real-time measurements of atmospheric pressure, temperature, wind speed and direction, humidity, precipitation, cloud cover, and other variables About Climate is defined as statistical weather information that describes the variation of weather at a given place for a specified interval. Weather is the day-to-day state of the atmosphere, and its short-term (minutes to weeks) variation Time period Measured over a long period Measured for short term Study Climatology Meteorology Time factor in climate and weather The difference between weather and climate is a measure of time. Weather refers to the atmospheric conditions of a specific place over a short period of time, usually 24 hours. Climate refers to the average atmospheric conditions over relatively long periods of time, usually 30 years. In other words, when one talks about the climate, then they're talking about the pattern over a long term while when weather is referred to then the conditions of short term are being spoken of. Components of weather and climate There are several aspects to weather. Weather includes sunshine, rain, cloud cover, winds, hail, snow, sleet, freezing rain, flooding, blizzards, ice storms, thunderstorms, steady rains from a cold front or warm front, excessive heat, heat waves and more. Climate may include precipitation, temperature, humidity, sunshine, wind velocity, phenomena such as fog, frost, and hail storms over a long period of time. Changes in climate vs. weather Weather may change from minute-to-minute, hour-to-hour, day-to-day, and season-to-season. Climate, however, is the average of weather over time and space and changes in overall climate tend to be gradual. Forecast and Measurement
  • 14. Weather forecasts are made by collecting data that describe the current state of the atmosphere (particularly the temperature, humidity and wind) and using physically-based mathematical models to determine how the atmosphere is expected to change in the future. The chaotic nature of the atmosphere means that perfect forecasts are impossible, and that forecasts become less accurate as the range of the forecast increases. Climate is measured based on the weather statistics. A general period of 30 years is taken to forecast climate of an area as patterns over a period of time have to be observed. The standard classification of the earth's climatic zones is mainly based on the annual cycles of temperature and rainfall. The time frame makes it possible for weather forecasts to usually be easier and more accurate than forecasts about climate change. Human impact and changes on climate and weather There is extensive evidence that human activity such as agriculture and industry results in inadvertent weather modification. Acid rain, caused by industrial emission of sulfur dioxide and nitrogen oxides into the atmosphere, adversely affects freshwater lakes, vegetation, and structures. Anthropogenic pollutants reduce air quality and visibility. The effects of inadvertent weather modification over the long term may pose serious threats to many aspects of civilization, including ecosystems, natural resources, food and fiber production, economic development, and human health. Climate change caused by human activities that emit greenhouse gases into the air is expected to affect the frequency of extreme weather events such as drought, extreme temperatures, flooding, high winds, global warming and severe storms. Global Warming is often euphemistically referred to as “Climate Change”. Study of climate vs. study of weather Climatology is the study of climate, scientifically defined as weather conditions averaged over a period of time and is a branch of the atmospheric sciences. Meteorology (from Greek: μετέωρον, meteoron, "high in the sky"; and λόγος, logos, "knowledge") is the interdisciplinary scientific study of the atmosphere that focuses on weather processes and forecasting. References  http://www.nasa.gov/mission_pages/noaa-n/climate/climate_weather.html  http://nsidc.org/arcticmet/basics/weather_vs_climate.html  http://www.mpimet.mpg.de/en/presse/faq-s/was-ist-der-unterschied-zwischen-wetter- und-klima.html  http://en.wikipedia.org/wiki/Weather#Weather_modification_and_human_impact  http://en.wikipedia.org/wiki/Climate#Climate_change
  • 15. Heat and temperature are related and often confused. More heat usually means a higher temperature. Heat (symbol: Q) is energy. It is the total amount of energy (both kinetic and potential) possessed by the molecules in a piece of matter. Heat is measured in Joules. Temperature (symbol: T) is not energy. It relates to the average (kinetic) energy of microscopic motions of a single particle in the system per degree of freedom. It is measured in Kelvin (K), Celsius (C) or Fahrenheit (F). When you heat a substance, either of two things can happen: the temperature of the substance can rise or the state of substance can change. Comparison chart Heat versus Temperature comparison chart Heat Temperature Definition Heat is energy that is transferred from one body to another as the result of a difference in temperature. Temperature is a measure of hotness or coldness expressed in terms of any of several arbitrary scales like Celsius and Fahrenheit. Unit Joules Kelvin, Celsius or Fahrenheit Symbol J K,C,F SI unit Joule Kelvin Particles Heat is a measure of how many atoms there are in a substance multiplied by how much energy each atom possesses. Temperature is related to how fast the atoms within a substance are moving. The ‘temperature’ of an object is like the water level – it determines the direction in which ‘heat’ will flow. Ability to do work Heat has the ability to do work. Temperature can only be used to measure the degree of heat. Relationship Between Heat and Temperature In the video below, Derek Muller of Veritasium goes to the streets to show strangers how two items may have the same temperature but conduct heat differently, therefore feeling either warmer or cooler to the touch. References
  • 16. While the Mercalli scale describes the intensity of an earthquake based on its observed effects, the Richter scale describes the earthquake's magnitude by measuring the seismic waves that cause the earthquake. The two scales have different applications and measurement techniques. The Mercalli scale is linear and the Richter scale is logarithmic. i.e. a magnitude 5 earthquake is ten times as intense as a magnitude 4 earthquake. Comparison chart Mercalli Scale versus Richter Scale comparison chart Mercalli Scale Richter Scale Measures The effects caused by an earthquake The energy released by an earthquake Measuring Tool Observation Seismograph Calculation Quantified from observation of the effects on earth’s surface, humans, objects and man- made structures Base-10 logarithmic scale obtained by calculating logarithm of the amplitude of waves. Scale I (not felt) to XII (total destruction) From 2.0 to 10.0+ (never recorded). A 3.0 earthquake is 10 times stronger than a 2.0 earthquake. Consistency Varies depending on distance from epicenter Varies at different distances from the epicenter, but one value is given for the earthquake as a whole. Measurement The Mercalli Intensity Scale measures the intensity of an earthquake by observing its effect on people, the environment and the earth’s surface.
  • 17. Richter Scale reading of 2011 Tōhoku earthquake (it was followed by a tsunami) The Richter Scale measures the energy released by an earthquake using a seismograph. A base-10 logarithmic scale is obtained by calculating the logarithm of the amplitude of waves recorded by the seismograph. Comparing the Scales Intensity (Mercalli) Observations (Mercalli) Richter Scale Magnitude (approx. comparison) I No effect 1 to 2 II Noticed only by sensitive people 2 to 3 III Resembles vibrations caused by heavy traffic 3 to 4 IV Felt by people walking; rocking of free standing objects 4 V Sleepers awakened; bells ring 4 to 5 VI Trees sway, some damage from falling objects 5 to 6
  • 18. VII General alarm, cracking of walls 6 VIII Chimneys fall and some damage to building 6 to 7 IX Ground crack, houses begin to collapse, pipes break 7 X Ground badly cracked, many buildings destroyed. Some landslides 7 to 8 XI Few buildings remain standing, bridges destroyed. 8 XII Total destruction; objects thrown in air, shaking and distortion of ground 8 or greater Video explaining the differences This video explains how earthquakes are measured using the Richter and Mercalli intensity scales. Applications and Use 2010 Canterbury Earthquake The Mercalli Intensity Scale is only useful for measuring earthquakes in inhabited areas and is not considered particularly scientific, as the experiences of witnesses may vary and the damage caused may not
  • 19. accurately reflect an earthquake’s strength. It is, however, used to compare the damage caused by earthquakes in different areas. The Richter scale is used to measure the magnitude of most modern earthquakes and allows scientists to accurately compare the strength of earthquakes at different times and locations. History The Mercalli Intensity Scale was developed by Italian volcanologist Giuseppe Mercalli in 1884 and expanded to include 12 degrees of intensity in 1902 by Adolfo Cancani. It was modified again by Harry O. Wood and Frank Neumann in 1931. It is known today as the Modified Mercalli Intensity Scale. The Richter Magnitude Scale was developed in 1935 by Charles Richter. It was initially created to study a particular area in California, using the Wood- Anderson torsion seismograph, to compare the size of different earthquakes in the region. He later adapted the scale so that it could measure the size of earthquakes around the globe. References  http://en.wikipedia.org/wiki/Richter_magnitude_scale  http://en.wikipedia.org/wiki/Mercalli_intensity_scale  http://www.geography-site.co.uk/pages/physical/earth/richt.html  List of largest Earthquakes - Wikipedia  Heat and temperature are related and often confused. More heat usually means a higher temperature.  Heat (symbol: Q) is energy. It is the total amount of energy (both kinetic and potential) possessed by the molecules in a piece of matter. Heat is measured in Joules.  Temperature (symbol: T) is not energy. It relates to the average (kinetic) energy of microscopic motions of a single particle in the system per degree of freedom. It is measured in Kelvin (K), Celsius (C) or Fahrenheit (F). Comparison chart Heat versus Temperature comparison chart Heat Temperature Definition Heat is energy that is transferred from one body to Temperature is a measure of hotness or coldness expressed in terms of any of several arbitrary scales
  • 20. Heat versus Temperature comparison chart Heat Temperature another as the result of a difference in temperature. like Celsius and Fahrenheit. Unit Joules Kelvin, Celsius or Fahrenheit Symbol J K,C,F. SI unit Joule Kelvin,Celsius or Fahrient. Particles Heat is a measure of how many atoms there are in a substance multiplied by how much energy each atom possesses. Temperature is related to how fast the atoms within a substance are moving. The ‘temperature’ of an object is like the water level – it determines the direction in which ‘heat’ will flow. Ability to do work Heat has the ability to do work. Temperature can only be used to measure the degree of heat. Relationship Between Heat and Temperature In the video below, Derek Muller of Veritasium goes to the streets to show strangers how two items may have the same temperature but conduct heat differently, therefore feeling either warmer or cooler to the touch. References  Heat - Encyclopedia Britannica  Temperature - Encyclopedia Britannica  Heat - Wikipedia The words science and technology can and often are used interchangeably. But the goal of science is the pursuit of knowledge for its own sake while the goal of technology is to create products that solve problems and improve human life. Simply put, technology is the practical application of science. Comparison chart Science versus Technology comparison chart Science Technology Result Making virtually value-free Activities always value-laden
  • 21. Science versus Technology comparison chart Science Technology Relevance statements Evaluation Methods Analysis, generalization and creation of theories Analysis and synthesis of design Goals achieved through Corresponding Scientific Processes Key Technological Processes Focus Focuses on understanding natural phenomena focuses on understanding the made environment Development Methods Discovery (controlled by experimentation) Design, invention, production Most observed quality Drawing correct conclusions based on good theories and accurate data Taking good decisions based on incomplete data and approximate models Skills needed to excel Experimental and logical skills Design, construction, testing, planning, quality assurance, problem solving, decision making, interpersonal and communication skills Definition of science and technology Science from the Latin scientia (knowledge) is a system of acquiring knowledge based on the scientific method, as well as the organized body of knowledge gained through such research. Science as defined here is sometimes termed pure science to differentiate it from applied science, which is the application of scientific research to specific human needs. Technology is a broad concept that deals with a species' usage and knowledge of tools and crafts, and how it affects a species' ability to control and adapt to its environment. In human society, it is a consequence of science and engineering, although several technological advances predate the two concepts. Science refers to a system of acquiring knowledge. This system uses observation and experimentation to describe and explain natural phenomena. The term science also refers to the organized body of knowledge people have gained using that system. Fields of science are commonly classified along two major lines: 1. Natural sciences, which study natural phenomena (including biological life), 2. Social sciences, which study human behavior and societies.
  • 22. These groupings are empirical sciences, which means the knowledge must be based on observable phenomena and capable of being tested for its validity by other researchers working under the same conditions. Differences in Etymology The word science comes through the Old French, and is derived from the Latin word scientia for knowledge, which in turn comes from scio - 'I know'. From the Middle Ages to the Enlightenment, science or scientia meant any systematic recorded knowledge. Science therefore had the same sort of very broad meaning that philosophy had at that time. In other languages, including French, Spanish, Portuguese, and Italian, the word corresponding to science also carries this meaning. Today, the primary meaning of "science" is generally limited to empirical study involving use of the scientific method. Technology is a term with origins in the Greek "technologia", "τεχνολογία" — "techne", "τέχνη" ("craft") and "logia", "λογία" ("saying"). However, a strict definition is elusive; "technology" can refer to material objects of use to humanity, such as machines, hardware or utensils, but can also encompass broader themes, including systems, methods of organization, and techniques. The term can either be applied generally or to specific areas: examples include "construction technology", "medical technology", or "state-of-the-art technology". Is Technology Related to Science? Bigelow’s phrase[1] “the practical applications of science” points to the root of much of the current confusion as to the meaning of technology. In using this phrase to describe technology he effectively placed technology beneath the umbrella of science to such an extent that science and technology are now, as Rose described, seen by many as an “indivisible pair” with technology as the subservient and dependant partner. Thus, for much of the time the pair are wrapped together into a single conceptual package known simply as “science”. This point is emphasised when surfing the Internet for technology- related teaching resources. A plethora of lesson plans exist at sites dedicated to science education. The problem is, though, that many of these lessons should properly be termed “technology” but are all too often referred to as "Applied Science". One source of confusion is the undoubted relationship that exists between science and technology and Sparks pointed out that even though science and technology overlap in an area which might be referred to as “applied science”, there are a number of important differences between the two, even though these differences might not be self-evident to an average member of the general public who, through neglect and through repeated use of the phrase “science and technology” has lost the distinction between “science” and between “technology”. The two cannot be told apart, which is hardly surprising given that, as Mayr put it: “ . . . practical usable criteria for making sharp neat distinctions between science and technology do not exist.”
  • 23. What’s the difference between Partly Cloudy and Partly Sunny? April 20, 2020 2:27 pm Dean Wysocki LINCOLN, NEB. (KLKN) — For starters, partly sunny can only be used during the day. However, according to the National Weather Service, partly cloudy and partly sunny mean exactly the same thing. The NWS definition states that between 3/8 and 5/8 of the sky is covered by clouds when it’s classified as partly cloudy or partly sunny. Sometimes, a “mix of sun and clouds” is used by some forecasters instead of “partly sunny” during the daytime hours, though it is not an official NWS term. As you may have guessed by now, mostly cloudy means there are more clouds than sun (or stars, at night). The NWS definition says the sky is classified as mostly cloudy when 3/4 to 7/8 of the sky is covered by clouds, and it can also be referred to as “considerable cloudiness.” On the other hand, mostly sunny means there is more sun than clouds. When 1/8 to 1/4 of the sky is covered by clouds, it’s classified as mostly sunny, or mostly clear at night, according to the NWS. Sunny or clear means there are no clouds in the sky, and cloudy means the entire sky is covered by clouds.
  • 24. One of the most misused weather terms is “fair.” The NWS uses “fair,” typically at night, to describe less than 3/8 cloud cover, with no precipitation and no extremes of visibility, temperature or winds. It describes generally pleasant weather conditions According to KOMO weatherman Steve Pool[1] , another difference could be the nature of change expected. If rain is ending and skies are clearing up, they tend to use the phrase "partly sunny". On the other hand, if it is sunny now but is expected to rain later, they would use "partly cloudy" to describe the forecast. Sunny Mostly sunny Partly cloudy Partly sunny Mostly cloudy Cloudy The difference is drawn by the amount of precipitation observed in a particular day: the more precipitation, the higher humidity, the higher chances for cloudy skies. “Mostly sunny” and “partly cloudy” being too close to each other become confusing for most people. “Mostly sunny” simply means longer periods of sunshine than shady skies, while “partly cloudy” generally means an equal amount of clouds and sun. It could be that on a mostly sunny morning, the skies can be cloudless. On the other hand, a partly cloudy day may mean that the day would still be warm as there is only a small amount of clouds in the sky. There are several accounts, however, that state that “mostly sunny” and “partly cloudy” weather conditions are essentially the same. In fact, some meteorologists published a paper giving
  • 25. support to this claim. According to their studies, both conditions cover an average amount of opaque clouds that may range from 45 to 75 per cent. The only difference is that “partly cloudy” is used when giving a weather forecast at a time closer to dusk, while “mostly sunny” is given when the reports are announced during sunrise. Indeed, saying “mostly sunny” at a time of the day close to nighttime would be awkward to both the viewers and the weather reporters. Theorists of communication and viewer research also agree to this system of weather forecasts. They have made it a point to prove that announcing a “mostly sunny” morning would sound more cheerful to viewers of morning news programs. This would then give them the vigor and positivity as they tune in while enjoying at the breakfast table. As obvious and a no-brainer as it may sound, simply saying “mostly sunny” instead of “partly cloudy” is found to make the audiences more cheerful during sunrise. In line with this, there was actually a paper presented at the American Meteorological Society which suggests that weather forecasters and announcers stick to saying “partly cloudy” regardless of the time of airing to avoid confusion. Logically, it followed that television stations and broadcasters showed a howl of protest. Using “mostly sunny” would be more appropriate as it attracts more optimism from viewers and rouses positive moods especially during weekend forecasts.
  • 26. Summary: 1.“Mostly sunny” is a term used by newscasters in announcing weather conditions during mornings, and “partly cloudy” is used by evening programs. 2.“Mostly sunny” and “partly cloudy” have the same amount of percentage of opaque clouds. 3.The difference between the two can be drawn from observing precipitation: higher humidity gives partly cloudy weather conditions. Read more: Difference Between Partly Cloudy and Mostly Sunny | Difference Between http://www.differencebetween.net/language/wor ds-language/difference-between-partly-cloudy-and-mostly- sunny/#ixzz7kSmyiMxw. Established by the National Weather Service (NWS) according to a loose set of rules, the criteria used to describe different elements of your forecast can be pretty vague. Sky conditions are classified according to how much “opaque cloud coverage” (OCC) is expected that day. While the NWS has apparently not defined “opaque clouds,” they are presumed to be those that can’t be seen through, or more technically, those that are “opaque to terrestrial radiation.” To qualify as “Sunny,” there can be no more than 25% OCC. “Clear,” on the other hand is sometimes used as synonym for “Sunny,” but is only applied when there is no more than 5% OCC. “Mostly Clear,” which is also a synonym for “Sunny,” is used when there is between 6% and 25% OCC. “Mostly Sunny” and “Partly Cloudy” are apparently interchangeable, and apply when the OCC is between 26% and 50%.”Partly Sunny” and “Mostly Cloudy” can also be synonyms, when the OCC is between 51% and 69%, although “Mostly Cloudy” can be applied for OCC up to 87%. At an OCC of 88% and above, the sky is considered “Cloudy” or “Overcast.”
  • 27. Note that when there is a “high probability” of precipitation (60% or more), many weather folks skip the sky condition forecast, since it may be inferred to be “Cloudy.” When forecasting the chance of precipitation, the NWS considers the likelihood that there will be at least 0.01 inches of precipitation at one place in the forecast area within (usually) a 12-hour period (called the probability of precipitation or POP). Words used in the forecast, such as “chance of rain” and “likely,” as well as “isolated” and “scattered,” are considered either “expressions of uncertainty” or “qualifiers” (the last two denote that the entire area will not be affected), and they are tied to ranges of POPs. So, when the probability of precipitation (POP) is between 60% and 70%, the “uncertainty” is low and so the forecast may often include the word “likely,” while when the POP is only 20%, the “uncertainty” is higher, so the phrase “slight chance,” may be used. “Isolated” is used when the POP is between 10% and 29%, while “scattered” is used when the POP is between 30% and 59%. “Occasional,” “intermittent,” and “periods of,” denote a POP of greater than 79%, but also that the precipitation will be “on and off.” When the forecast temperature is given in a range, it has a particular meaning, as well. For example, “near 40” means the temperature is expected to be anywhere from 38F to 42F, “lower 40s” denotes anywhere from 40F to 44F, “mid 40s” from 43F to 47F and “upper 40s” from 46F to 49F. Wind terms are tied to specific ranges too, all related to “sustained wind speed” (SWS), and they can overlap. “Sustained wind” is defined as the average of observed wind speeds over a two-minute period. “High,” “strong” and “damaging” winds are those expected to have SWS of at least 40 miles per hour (mph). “Very windy” denotes when SWS is between 30 and 40 mph, and “windy” between anywhere from 20 to 35 mph. When the SWS is between 15 and 25 mph, “breezy” is used when the weather is mild, and “brisk” or “blustery” are used when it is cold. “Calm” and “light” are used to denote SWS of 5 mph or less. Wind chill incorporates considerations of how much heat a human body will lose to the environment on a cold or windy day. Calculations are estimated at weather conditions at 5 feet above ground level (said to be the typical height of a human face), and begin when SWS reach 3 mph. The NWS provides a chart that shows wind chill for any temperature between 40F and -45F with winds between 5 mph and 60 mph, and it reveals that even a slight wind, with cold temperatures, can have a big effect on wind chill. For example, at 0F with only calm winds of 5 mph, the wind chill is -11F. Likewise, even when temperatures are relatively mild, say at 35F, if the winds are high, say 60 mph, it can make it feel about half the temperature it really is (17F). On the other hand, the heat index reflects the fact that when the humidity reaches a certain point, the perspiration on your skin can’t evaporate, you can’t cool down so easily, and so the apparent temperature feels hotter than it actually is.
  • 28. On that note, the NWS provides a heat index chart as well, which shows temperatures between 80F and 110F and relative humidity (RH) between 40% and 100%. Just as with wind chill, slight changes in a single variable can have a dramatic effect, and when both are high, the heat index becomes dangerous to human health. For example, at 90F and 40% RH, the heat index is only 91F, but if it’s soupy outside, say 95% RH, then the heat index shoots up to 127F. If you liked this article, you might also enjoy our new popular podcast, The BrainFood Show (iTunes, Spotify, Google Play Music, Feed), as well as:  Can Bad Weather Cause Joints to Ache?  What Causes the Smell After Rain  Why We Call the Seasons Summer, Autumn, Winter, and Spring  What Causes Dew?  The Tale of the Man Who Nearly Drowned While Falling from the Sky Bonus Fact:  The Occupational Health and Safety Administration (OSHA) has guidance for using the heat index to protect workers, and calls for escalating measures as the heat index increases from “moderate” (91F to 103F) to “high” (103F to 115F) to “extreme” (116F or greater). At all three levels, OSHA recommends for those in the heat: drinking about 4 cups of water per hour, being prepared for heat illnesses, acclimatizing, wearing sunscreen and taking frequent, shady breaks. As the heat index moves into “high,” OSHA also recommends limiting physical exertion and becoming vigilant for heat related illness. Once the heat index moves into “extreme,” OSHA recommends only essential tasks be performed, and then only during the coolest time possible. The major difference between Fog and Mist is that fog is much dense and thicker as compared to mist. It is sometimes difficult to understand the difference between both. They both are created by water droplets. The difference is only in their location and density. The density of fog is more as compared to mist, thus it lasts longer. Fog reaches ground level even if it is a hill or mountain. Mist is created by a temperature inversion, changes in humidity, activities like a volcano. Fog reduces its visibility to less than one kilometer on the other side, a mist can reduce till one and two-kilometer. Thus, fog is much more visible as compared to mist. They both are made from clouds. Fog lasts longer as compared to mist. The key differences between fog and mist are as follows
  • 29. Table of content 1 Difference between Fog and Mist 2 Fog 2.1 Radiation Fog 2.2 Evaporating Fog 2.3 Ice Fog 2.4 Ground Fog 2.5 Freezing Fog 3 Mist Difference between Fog and Mist Character Fog Mist Definition Fog is defined as the thick layer of cloud, that appears at the surface level, and is a composition of small droplets of water suspended in the air. Mist is defined as the layer of cloud, that is created due to the volcanic activities, changes in the level of temperature and humidity.
  • 30. Density The density of fog is always thick as compared to mist. The density of mist is comparatively low as compared to Fog. Durability Fog last for longer period. Mist last for a short time. Visibility It is visible for less than one kilometre. It is visible between one to two kilometres. Fog Fog is a thick layer of cloud at the lower surface and generally created by a water body like a lake, moist ground, or ocean. It takes place when the difference between dew point and air temperature is less than 2.5 degrees celsius. Fog is created when gas liquefies into small water droplets that are suspended in the air. This process includes the intersection of the water vapor to the air into the areas of upward motion, daytime heating or evaporating water from the surface of oceans, or wetland. cool air moving over mild or hot water, and lifting air over mountains. Water vapor normally begins to liquefy on the surface of dust, salt, or ice in order to form clouds. Fog produces drizzle or very light snow. Drizzle takes place when the humidity attains 100% and the small droplets turn into large droplets.
  • 31. Depending upon how the cooling caused, different types of Fog are formed.  Radiation Fog  Evaporating Fog  Ice Fog  Ground Fog  Freezing Fog Radiation Fog Radiation fog is created by the cooling of land after sunset, this land then cools the adjacent air by thermal transmission. This transmission forces the temperature of the air to fall and reach the dew point. This creates the fog. Evaporating Fog Evaporating Fog is formed by water bodies clad with much cool air. This situation can create whirlwind over the water. This is also known as steam fog or dust devil. Ice Fog Ice Fog is formed at very low temperatures and also by the moisture in the air when a group of animals exhales. It can be related to the ground level composed of small ice crystals. This often takes place in the blue sky conditions. Ground Fog Ground Fog is the fog that covers less than 60% of the sky. The level of this fog does not extend to the higher clouds. However, this is similar to the radiation fog. In some cases, the depth of the fog is on the order of tens of the centimetres over certain lands with the absence of winds.
  • 32. Freezing Fog Freezing Fog is the composition of droplets of super cooled water that freezes to surface on contact. Mist Mist is the situation caused by tiny water droplets suspended in the air. It occurs when warm and moist air meets sudden cooling. It is most commonly seen when air is exhaled in the winter or throwing on a stove or sauna. Mist can be created with the spray if the humidity and temperature conditions are right. It also happens when humid air cools rapidly when air comes in contact with the surface which is cooler than the air, natural weather. It is most often observed when the droplets of warm water are suddenly cool down and becomes visible to us. The most common example is exhaling air in the winter or a cool place. Reference https://www.diffen.com/difference/Fog_vs_Mist https://www.thesun.co.uk/news/2339888/fog-mist-difference/ https://www.vedantu.com/biology/difference-between-fog-and-mist
  • 33. Fog and mist are both created by water droplets, differing only in their overall locations and density. Fog is a cloud that reaches ground level, even if that "ground" is a hill or mountaintop. Mist forms wherever water droplets are suspended in the air by temperature inversion, volcanic activity, or changes in humidity. Fog is denser than mist and tends to last longer. In terms of visibility, fog reduces it to less than one kilometer (0.6 miles), while mist can reduce visibility to between 1 and 2 kilometers (0.6 - 1.2 miles). Comparison chart Fog versus Mist comparison chart Fog Mist Effect on visibility Reduces visibility to less than 1 km (1,094 yards) Reduces visibility to between 1 and 2 km Mist vs. Fog Causes
  • 34. Fog is formed when any cloud type makes contact with the ground. In low- lying areas, such as valleys and plains, the fog bank (a mass of fog) is essentially a cloud formation subject to the same wind and temperature reactions clouds experience in the upper atmosphere. Clouds form when water droplets condense and merge, but fail to achieve a size large enough to precipitate as rain. Clouds will form or drift closer to the ground when humidity rises or changes abruptly, or when wind speeds drop or acutely change direction. Mist is also formed by water droplets, but with less merging or coalescing. This means mist is less dense and quicker to dissipate when wind, temperature, or relative humidity changes. Mists can form due to abrupt temperature changes (such as when exhaling in cold air), high levels of humidity (in a sauna, for example), or from evaporation or condensation, such as when rain hits sun-warmed rocks and street surfaces or evening allows dew to form. Effects on Visibility Fog is much denser than mist and thus has a greater effect on visibility. A person can still see out to about 2 kilometers (1.2 miles) in mist, but a fog will reduce visibility to under one kilometer (0.6 miles). Dense fogs, usually caused by rapid changes in humidity or combined with smoke, can reduce visibility to under 50 meters (60 yards). London's infamous "pea-soup fogs" of the 19th century were said to reduce visibility to less than 20 feet. How to Drive Safely in Fog and Mist When driving in misty conditions, it is important for drivers to use wipers with care. The water droplets in mist are often not dense enough to require the constant use of wipers, so intermittent patterns will probably do a better job of keeping the windshield clear. In foggy conditions, wipers might play a smaller role to that of fog lights or driving lights. In some dense fogs, headlights or "long" lights will actually reduce visibility as the light is reflected by the fog itself. To check for best visibility, a driver should flick between headlights and fog lights to gauge visibility with each. This also serves as a warning signal to oncoming drivers. Driving "past your lights," means that the limit of visibility is constantly exceeded (the speed is too fast to react to what appears out of the fog or mist) and one is "driving blind." It is best for drivers to slow down in that situation. If the driving speed in the fog drops to half of the posted maximum speed, it is a good idea for drivers to find a safe spot to pull well off the road and wait for the fog to clear. Many accidents are caused in fog banks by cars going too slow and being hit from behind. When pulling off the road, drivers should keep their car's hazard lights flashing for additional safety. In the following video, driving safety instructor Zundrea Baldwin gives further tips on how to drive safely in foggy conditions.
  • 35. References  Wikipedia: Fog  Wikipedia: Mist Oceans are vast bodies of water that cover roughly 70% of the earth. Seas are smaller and partially enclosed by land. The five oceans of the earth are in reality one large interconnected water body. In contrast, there are over 50 smaller seas scattered around the world. Comparison chart Ocean versus Sea comparison chart Ocean Sea Introduction (from Wikipedia) Though generally described as several 'separate' oceans, these waters comprise one global, interconnected body of salt water sometimes referred to as the World Ocean or global ocean. A sea generally refers to a large body of salt water, but the term is used in other contexts as well. Most commonly, it means a large expanse of saline water connected with an ocean, and is commonly used as a synonym for ocean. Area Oceans cover 71% of the Earth's surface, and contain 97 percent of the planet's water. The Pacific Ocean is the largest ocean covering an area of 64,186,000 square miles and the Mediterranean Sea is the largest sea with an area of 1,144,800 square miles. In fact even the world’s smallest ocean Arctic Ocean (5,427,000 square miles) is larger than the Mediterranean.
  • 36. A map of the world, showing four of the five oceans. The Southern Ocean (not marked on the map) is around the Antarctic Circle. List of oceans by size 1. Pacific Ocean: 60,060,700 square miles 2. Atlantic Ocean: 29,637,900 square miles 3. Indian Ocean: 26,469,900 square miles 4. Southern Ocean: 7,848,300 square miles 5. Arctic Ocean: 5,427,000 square miles Top 6 largest seas 1. Mediterranean Sea: 1,144,800 square miles 2. Caribbean Sea: 1,049,500 square miles 3. South China Sea: 895,400 square miles 4. Bering Sea: 884,900 square miles 5. Gulf of Mexico: 615,000 square miles 6. Okhotsk Sea: 613,800 square miles Depth The average depth in oceans is from 3,953ft to 15,215ft. Mariana Trench in the Pacific Ocean is the deepest, 36,200 ft deep. At 22,788 ft, the Caribbean Sea is the deepest sea. Most seas are much shallower. Marine life
  • 37. Oceans and seas are home to rich and diverse marine life. The depth and distance from shore strongly influence the quantity and biodiversity of the plants and animals that live there. As seas are always near land marine life are abundant while oceans which are deeper and farther away from land have on few basic life forms like bacteria, microscopic plankton and shrimp. Zones Any water in a sea, ocean or lake that is not close to the bottom or near to the shore can be said to be in the pelagic zone. Areas in the pelagic zone are distinguished by their depth and the ecology of the zone. It is further divided into:  The epipelagic zone (sunlit) is closest to the surface and stretches down to around 200 m. An abundance of light allows for photosynthesis by plants and nutrients for animals like tuna external and sharks.  The mesopelagic zone (twilight) begins at 200 m below the surface and reaches a depth of 1,000 m. There is a little light but not enough for photosynthesis to occur.  The bathypelagic zone (midnight) follows, from 1000-4,000 m in depth. Bioluminescent organisms are found in this zone. Unique animals like the marine hatchet fish external and giant squid live in this zone, surviving mostly on the detritus that drifts down from the epipelagic zone.
  • 38.  The abyssopelagic zone (lower midnight) is located from 4,000 m to directly above the ocean floor and is a completely dark area home to colorless and blind animals.  The Hadopelagic zone is the deep water in ocean trenches. Some define the hadopelagic as waters below 6,000 m (19,685 ft), whether in a trench or not. Very little is known about this zone, and very few species are known to live here. The bathypelagic, abyssopelagic, and hadopelagic zones have very similar characteristics. Because of this some marine biologists combine these three zones or at least combine the last two. Climate The Earth's climate is greatly affected by ocean currents which transfer cold or warm air to different coastal regions. To learn more about how the ocean affects the climate, watch the following video by NASA. References  What's the difference between an ocean and a sea? - NOAA.gov  Deepest Oceans and Seas of the World - WorldAtlas.com  Sizes of Oceans and Seas - InfoPlease  Wikipedia: Sea  Wikipedia: Ocean Winter storms are characterized by snowfall, rain, sleet, and ice etc where temperatures are below freezing point. A winter storm (or snowstorm) is an event in which the dominant varieties of precipitation are forms that only occur at cold temperatures, such as snow or sleet, or a rainstorm where ground temperatures are cold enough to allow ice to form (i.e. freezing rain). The difference between a blizzard and winter storms lies in the presence and strength of winds. Blizzards are massive snow storms with strong winds. Comparison chart Blizzard versus Winter Storm comparison chart Blizzard Winter Storm Characteristics Severe storm with strong winds, severe temperatures and heavy snow. Cold storm with low temperature, sleet, snow, rain and ice formations. Occurrence Winter Winter, spring, autumn
  • 39. Blizzard versus Winter Storm comparison chart Blizzard Winter Storm Forms of precipitation Snow Snow, rime, ice pellets, rain, graupel Types Traditional and ground blizzards Snow storm, Freezing rain storm or wintry mixes. Effect Blizzard gives rise to a white out with minimum visibility. Avalanches, cornices and spring flooding are common in winter storms. Economic impact Blizzards harm local economies and cause paralysis of normal life for days. Infections due to frostbites, death from hypothermia, power outage, car accidents on slippery roads, fires, carbon monoxide poisoning etc lead to disruption of life until conditions improve. Satellite image of the United States blanketed by snow in February 2011. Definition of Blizzard Blizzard like conditions on I94 from Exit 140 overpass 9 miles west of Mandan in ND.
  • 40. A winter storm occurs at very cold temperatures and is characterized by variety of precipitations like snow, sleet, freezing rain, and ice formation. These storms occur in temperate continental climates during winter, early spring and late autumn. Cold temperature is a must for a winter storm. A winter storm that is particularly severe and meets some criteria is called a blizzard. "Blizzard" has different definitions in different countries. The National Weather Service of the United States define blizzard as continuous winds blowing at 35mph, leading to blowing snow causing restricted visibility of ¼ miles and lasting for a minimum of 3 hours. Even though temperature is not taken into consideration here, it is usually below 32 ˚F or 0 ˚C. Environment Canada defines blizzard as a snow storm blowing snow with winds at 25mph, temperature of -25˚C or -15˚F and visibility of less than 500 feet lasting for over 3 hours. The Met Office in UK defines blizzards as medium to heavy snow with winds of 30mph and visibility of 650 feet or less. From all these definitions it can be inferred that strong winds, heavy snow and restricted visibility are characteristic of a blizzard. Types of Blizzards and Winter Storms Traditional blizzards occur with winds blowing falling snow in all directions while blizzards with no snow fall are called as ground blizzards. Ground blizzards have very strong winds which rake up the fallen snow and blow it around. Ground blizzards usually occur in huge flat expanses of land where there is plenty of loose powdery snow that can be blown by high and strong winds. Winter storms can be snow storms, freezing rain storms or wintry mixes.  Snow Storms – huge amount of snow fall creating serious snow drifts, snow piles etc leading to disruption to traffic, school transport, and normal life.  Freezing rain – this is among the most dangerous type of winter storms. There is a presence of a warm air layer over the region but ground temperature is below freezing point and ambient temperature of around 0˚ C. During this condition roads are frozen. Sometimes, plants and infrastructure gets covered by a coat of ice and then the storm is known as ice storm.  Wintry Mixes – many a time a combination of rain and sleet is the form of precipitation seen during winter storms or snow and rain alternate with temperature ranging between -2˚C and 2˚C. Impact of Blizzards and Winter Storms
  • 41. Coated in ice, power and telephone lines sag and often break during a blizzard. The most common effect of a blizzard is a whiteout. White outs are very common in the Arctic and Antarctic during spring. White outs occur due to a scientific phenomenon of sunlight being reflected in all directions by the snow and ice. Snowflakes, droplets of fog and ice particles suspended in air enhance the effect to such an extent that sense of direction, perception of depth and balance seem to get lost. The sky and land appear to have blended with a white sheet encompassing everything. Blizzards disrupt life and cause loss of lives, lessened productivity due to inability to reach work places, schools closings, airports are closed, delay in delivery of products etc. Winter storms cause havoc in regions affected. Death due to hypothermia and infections by frost bites are common. Car accidents are on the rise due to slippery roads and there can be power outages for days on end. Communication can be disrupted with damage to telephone lines and even crops are ruined. Flying becomes dangerous with formation of rime and graupel – rime is a collection of cooled cloud or fog droplets that freezes when it makes contact with an object. Hence when ice crystals fall through rime, droplets of ice get attached to cloud droplets forming graupel. Aircrafts are particularly endangered when it passes through a cold cloud since rime can get formed on its wings. Winter storm news References  wikipedia:Winter storm  wikipedia:Blizzard