For returning subjects with diabetes (N=1415), improvements were observed over time in BMI, blood pressure, total cholesterol, and A1c concentrations (p<0.05). Waist circumferences were unchanged. For subjects without diabetes (N=1398), improvements were seen in blood pressure and total cholesterol only (p<0.05), while BMI and waist circumference increased (p<0.05) and A1c was unaffected. While diabetes outcomes are improving with outreach programs, more intense strategies may be needed to modify risk factors in those with pre-diabetes.
Diabetes and Cardiovascular Risk in Driftpile First Nation: Longitudinal Results
Improved Outcomes from Diabetes Outreach Programs in Rural and Remote Aboriginal Communities of Alberta, Canada
1. Improved Outcomes from Diabetes Outreach Programs in Rural
and Remote Aboriginal Communities of Alberta, Canada
Richard T. Oster, Kelli Ralph-Campbell, Tracy Connor, Ellen L. Toth
Department of Medicine, University of Alberta
k
ABSTRACT
Aboriginal and rural/remote communities
have increased risk and prevalences of
diabetes, with less access to preventive
health care and less opportunities for
healthy lifestyles. Since 2001, Alberta
has hosted outreach and/or community-
based screening programs in such
communities for diabetes and diabetes
risk. A total of 2879 persons with
diabetes and 4663 persons without
diagnosed diabetes (mostly Aboriginal
and rural/remote) have been tested and
counseled in over 14,000 visits. Baseline
adult characteristics have been
previously reported, and generally were
unfavorable, showing up to 31% with
pre-diabetes and 83% overweight or
obese. In this study we examined,
longitudinally, the diabetes-related
health of returning adult individuals.
“Point-of-care” lab equipment was
transported to each community to
screen for diabetes and cardiovascular
risk; individuals with known diabetes
were also screened for complications. In
the current investigation, body mass
index (BMI), waist circumference,
hemoglobin A1c (A1c), blood pressure
and total cholesterol were considered.
For the longitudinal analysis, univariate
general linear mixed effect models with
random client effect and fixed time (year)
effect were utilized to obtain overall
trend estimates (considered significant if
p < 0.05). Improvements in BMI, blood
pressure, total cholesterol and A1c
concentrations were observed among
returning subjects with diabetes (p <
0.05) (N = 1415). Waist circumferences
were unchanged. In contrast, subjects
without known diabetes experienced
improvements only in blood pressure
and total cholesterol (p < 0.05), whereas
both BMI and waist circumference
increased over time (p < 0.05), and A1c
was unaffected (N = 1398). While secular
improvements in diabetes outcomes are
occurring in rural Aboriginal adults
exposed to diabetes outreach programs,
the “dose” of such programs is likely
insufficient to modify significant risk
factors in pre-diabetic clients, thus
different and/or more intense, and/or
more integrated strategies need to be
explored.
For additional information contact:
Richard Oster
1055 RTF bldg, University of Alberta
Edmonton, Alberta, Canada
T6G 2V2
780-407-8445
roster@ualberta.ca
KS
INTRODUCTION Statistical analysis
Analyses were done with SPSS 17.0. Mean baseline and subsequent
indicators were compared for individuals over time with a univariate
general linear mixed effect model. Those with and without diabetes
were analyzed separately. Resultant overall trend estimates for each
indicator were considered significant if P < 0.05.
Since 2001, three separate screening programs have travelled to First
Nations communities, Métis settlements, and other remote Alberta
communities. Mobile clinics provide diabetes risk assessment, diabetes
complications screening, and community-based care. Ethical approval
was secured from the Health Research Ethics Board at the University of
Alberta, and individuals consented to aggregate analysis.
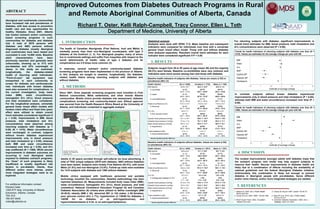
For returning subjects with diabetes, significant improvements in
overall trend estimates for BMI, blood pressure, total cholesterol and
A1c concentrations were observed (P < 0.05).
4. DISCUSSION
The modest improvements amongst adults with diabetes imply that
the outreach program care model may help support subjects to
improve their health. Secular improvements in diabetes health are
likely due to a combination of effects including the availability of
national guidelines and the federal Aboriginal Diabetes Initiative.
Unfortunately this combination is likely not enough to prevent
diabetes in Aboriginal people with pre-diabetes, hence different
and/or more intense, and/or more integrated strategies are needed.
5. REFERENCES
1. Adelson N. 2005. Can J Public Health. 2. Gracey M, King M. 2009. Lancet. 374:65-75.
96(S2):S45-S61.
3. Young TK et al. 2000. CMAJ. 163:561-566. 4. Oster RT et al. 2010. Can J Public Health.
101(5):410-414.
5. NCEP Expert Panel. 2002. Circulation . 6. Canadian Diabetes Association. 2008. Can J
106(25):3143-3421. Diabetes. 32(S1):S1-S201.
In contrast, subjects without known diabetes experienced
improvements only in blood pressure and total cholesterol (P < 0.05),
whereas both BMI and waist circumference increased over time (P <
0.05).
Trends for health indicators of returning subjects with diabetes over time (N =
1415). Values are estimates for the average change per year with SE.
Baseline health indicators of subjects with diabetes. Values are means (± SD) or
prevalences (95% CI).
3. RESULTS
Subjects ranged from 20 to 92 years of age (mean 48) and the majority
(64.2%) were female. Baseline co-morbidities were very common and
indicators were more severe among men and those with diabetes.
2. METHODS
Canadian Aboriginal Issues
Database, www.ualberta.ca/
~walld/map.html
Indian and Northern
Affairs Canada,
www.ainc-inac.gc.ca
-1.5 -1 -0.5 0 0.5 1 1.5
BMI
Waist
A1c
MAP
Systolic BP
Diastolic BP
Cholesterol
Estimate of average change
-1.5 -1 -0.5 0 0.5 1 1.5
BMI
Waist
A1c
MAP
Systolic BP
Diastolic BP
Cholesterol
Estimate of average change
Health indicator All (n = 2838) Females (n = 1732) Males (n = 1106)
BMI (kg/m2) 33.6 ± 10.7 34.2 ± 12.3* 32.5 ± 7.4
% overweight 25.2%
(23.6 – 27.0)
22.7%
(20.7 – 24.9)*
29.1%
(26.3 – 32.0)
% obese 67.4%
(65.6 – 69.2)
70.0%
(67.6 – 72.2)*
62.5%
(59.5 – 65.6)
% overweight/obese 92.3%
(91.2 – 93.3)
92.7%
(91.3 – 94.0)
91.6%
(89.7 – 93.3)
Waist circumference (cm) 110.7 ± 14.7 110.9 ± 14.7 110.5 ± 14.7
% Abnormal 83.2%
(81.7 – 84.6)
88.9%
(87.3 – 90.4)*
73.6%
(70.6 – 76.3)
A1c (%) 8.0 ± 7.7 8.0 ± 9.7 8.0 ± 2.0
% Poor glucose control 57.7%
(55.7 – 59.5)
55.6%
(53.1 – 58.1)*
60.9%
(57.8 – 63.9)
Systolic blood pressure (mmHg) 131.1 ± 19.1 129.3 ± 18.7* 133.9 ± 19.2
Diastolic blood pressure (mmHg) 77.4 ± 11.0 75.7 ± 10.5* 80.0 ± 11.1
Mean arterial pressure (mmHg) 95.3 ± 12.1 93.6 ± 11.7* 98.0 ± 12.1
% Hypertensive 67.3%
(65.5 – 69.0)
62.9%
(60.5 – 65.2)*
74.1%
(71.4 – 76.7)
Total cholesterol (mM) 4.9 ± 1.2 5.0 ± 1.2 4.9 ± 1.3
% Hypercholesterolemia 36.9%
(34.9 – 39.0)
38.0%
(35.4 – 40.6)
35.4%
(32.2 – 38.6)
Health indicator All (n = 4020) Females (n = 2673) Males (n = 1347)
BMI (kg/m2) 30.8 ± 6.4 31.1 ± 6.8* 30.1 ± 5.5
% overweight 31.1%
(29.6 – 32.5)
27.7%
(26.0 -29.5)*
37.7%
(35.1 – 40.4)
% obese 51.3%
(49.7 – 52.9)
54.0%
(43.3 – 48.7)*
46.0%
(43.3 – 48.7)
% overweight/obese 82.4%
(81.1 – 83.6)
81.7%
(80.2 – 83.2)
83.7%
(81.6 – 85.6)
Waist circumference (cm) 102.2 ± 15.6 101.3 ± 16.2* 104.1 ± 14.3
% Abnormal 70.9%
(69.4 – 72.3)
79.3%
(77.7 – 80.9)*
54.2%
(51.4 – 56.9)
A1c (%) 5.5 ± 0.7 5.4 ± 0.6 5.6 ± 0.9
% Undiagnosed diabetes (≥ 7%) 2.1%
(1.7 – 2.6)
1.8%
(1.3 – 2.4)*
2.9%
(2.0 – 3.9)
Systolic blood pressure (mmHg) 121.6 ± 17.9 118.5 ± 17.2* 127.6 ± 17.8
Diastolic blood pressure (mmHg) 75.3 ± 10.7 73.6 ± 10.3* 78.6 ± 10.8
Mean arterial pressure (mmHg) 90.7 ± 12.1 88.6 ± 11.6* 94.9 ± 12.0
% Hypertensive 26.2%
(24.5 – 27.9)
21.5%
(19.6 – 23.6)*
34.9%
(31.7 – 38.1)
Total cholesterol (mM) 4.8 ± 1.1 4.7 ± 1.0* 4.9 ± 1.1
% Hypercholesterolemia 32.8%
(31.4 – 34.3)
30.8%
(29.0 – 32.6)*
36.9%
(34.3 – 39.5)
1. INTRODUCTION
The health of Canadian Aboriginals (First Nations, Inuit and Métis) is
markedly poorer than their non-Aboriginal counterparts, with type 2
diabetes at the forefront (1, 2). For Aboriginal peoples, many of whom
live in rural/remote settings and suffer from inequities with respect to the
social determinants of health, rates of type 2 diabetes and its
complications are 2-5 times more common (3).
In response, several outreach and/or community-based diabetes
screening programs have been implemented in the province of Alberta.
In this analysis we sought to examine, longitudinally, the diabetes-
related health status among returning subjects with diabetes and
without diabetes.
Adults (≥ 20 years) enrolled through self-referral via local advertising. A
total of 7542 unique subjects (2879 with diabetes, 4663 without diabetes)
have been tested. Subjects were mostly First Nations (64.4%), with some
Métis (21.8%) and non-Aboriginal (13.9%). Follow-up visits were available
for 1415 subjects with diabetes and 1398 without diabetes.
Mobile clinics equipped with healthcare personnel and portable
technology travelled the communities. Detailed methodology has been
reported elsewhere (4). Measurements included body mass index (BMI),
waist circumference, hemoglobin A1c (A1c), blood pressure, and total
cholesterol. National Cholesterol Education Program (5) and Canadian
Diabetes Association (6) criteria were utilized to define overweight (BMI
25-29.9), obesity (BMI ≥ 30), abnormal WC (≥ 102 males; ≥ 88 females),
poor glucose control (A1c ≥ 7%), hypertension (≥ 130/80 for diabetes; ≥
140/90 for no diabetes, or on anti-hypertensives), and
hypercholesterolemia (≥ 5.24, or on anti-hyperlipidemics).
Baseline health indicators of subjects without diabetes. Values are means (± SD)
or prevalences (95% CI).
Trends for health indicators of returning subjects with diabetes over time (N =
1398). Values are estimates for the average change per year with SE.
* denotes significant gender difference
* denotes significant gender difference