SlideShare una empresa de Scribd logo
1 de 5
Descargar para leer sin conexión
Flexible Labor Concurrent Indicator of the Economy and Leading Read on Labor

     US flexible labor returned to year-over-year growth for the first time this recovery in February 2010,
     and has showed 13 consecutive months of double-digit growth since April of last year. Consistent
     with historical trends, nonfarm payroll recovery trailed the flexible labor recovery by several months,
     returning to y/y growth in September 2010.

     Relative to past recoveries, flexible labor has seen a faster lift off the bottom in the current cycle, as
     companies have recognized the value of labor flexibility in the uncertain economic environment
     following the great recession.


                 US Flexible Workers (SA) vs. US Nonfarm Payroll (SA)                      US Flexible Workers (SA)
                                 Levels: 2000 – 2011                                  Year-over-Year Change: 2000 – 2011
        3.0                                                             140    30%
                            US Nonfarm Payroll                          138
        2.8                 (in millions) (Right Axis)                         20%
                                                                        136
        2.6                                                             134
                                                                               10%
        2.4                                                             132
                                                                        130     0%
        2.2                                                             128
                                                                              (10%)
        2.0                                                             126                   US Flex Workers
                            US Flex Workers                             124                   Year-over-Year Change
        1.8                                                                   (20%)
                            (in millions) (Left Axis)                   122
        1.6                                                             120   (30%)
                                                                                      1/00


                                                                                      1/02
                                                                                      7/02


                                                                                      7/04
                                                                                      1/05


                                                                                      1/07
                                                                                      7/07


                                                                                      1/09
                                                                                      7/09
                                                                                      7/00
                                                                                      1/01
                                                                                      7/01


                                                                                      1/03
                                                                                      7/03
                                                                                      1/04


                                                                                      7/05
                                                                                      1/06
                                                                                      7/06


                                                                                      1/08
                                                                                      7/08


                                                                                      1/10
                                                                                      7/10
                                                                                      1/11
              1/00

              1/01


              7/04

              7/05

              7/06

              7/07

              7/08

              7/09

              7/10
              7/00

              7/01
              1/02
              7/02
              1/03
              7/03
              1/04

              1/05

              1/06

              1/07

              1/08

              1/09

              1/10

              1/11


              Source: US Bureau of Labor Statistics and J.P. Morgan
              SA = seasonally adjusted
Professional Segment Drives Flexible Staffing Growth and Profitability

     Over recent economic cycles, US flexible staffing has been diversifying beyond its traditional
     commercial staffing base and is gaining further adoption in professional staffing (including
     accounting/finance and IT) that is key to future secular growth of the broader sector.

     Light industrial staffing, which led the flex staffing recovery in early 2010 has shown strong growth
     through the past year, although it has begun to come up against tougher year-over-year comps. IT
     staffing led the professional staffing segment’s return to year-over-year growth in mid-2010, while
     non-IT professional staffing (e.g., accounting/finance and legal) returned to growth later in 2010.

     We believe flexible labor in the professional staffing segment possesses greater opportunities to
     outpace the growth and profitability of commercial staffing over this economic expansion.

                   US Flexible Staffing Market Growth by Sector Highlights Higher Growth Rates in Professional Staffing: 1996 - 2012F
     Type of Flexible Staffing        1996    1997     1998   1999   2000 2001 2002 2003          2004    2005   2006   2007 2008 2009 2010 2011F 2012F
       Office/Clerical                 9%     10%       8%     7%     7%   (5% ) (5% ) 2%           4%     8%     2%     (2% ) (9% ) (24% )  9% 13% 8%
       Industrial                      7%     10%       6%     7%     7% (12% )   0%   5%         23%      7%     3%     (5% ) (7% ) (25% ) 27% 14% 7%
     Commercial Staffing                8%     10%       7%     7%     7%   (9%) (3%)  4%          14%      7%     3%     (4%) (8%) (25%) 19% 14%    7%
       IT Staffing                     NA       NA     23%    11%     9% (13% ) (21% )    (3% )   10%     10%     9%     8%   (4% )   (20% )   13%     12%   12%
       Finance & Accounting            5%       9%     10%    15%    15% 27% 24%          (8% )   (3% )    2%     6%     6%    1%     (28% )   (7% )    4%    9%
       Technical/Engineering           NA       NA     21%    24%    26%  (9% ) (13% )      2%    21%     23%    11%     6%   (7% )   (29% )    2%     10%    8%
       Healthcare                     24%      29%      8%     7%     4%    4%   (6% )    (3% )   11%     16%    10%    11%    2%     (23% )   14%     11%    8%
       Legal                           NA       NA     25%    20%    17% 14% 13%            9%    12%     18%    15%     7%    6%     (41% )   10%      9%   17%
       Other                           NA       NA     25%    20%    29% 13%     (9% )    (1% )   10%     11%     8%     7%    4%     (26% )    9%      5%   10%
     Professional Staffing            31%      33%     18%    13%    13%   (2%) (7%)       (3%)    8%     11%     9%     7%   (1%)     (25%)    7%     11%   10%
     Total US Flexible Staffing       16%      19%      12%   10%    10%    (5%)   (5%)    0%     11%      9%     6%     2%   (4%) (25%)       12%     12%    9%

       Source: Staffing Industry Analysts (SIA), April 2011
Flexible Staffing Still a Secular Growth Industry

     Flexible staffing penetration (flexible labor as a % of the total labor market) in the 2002-2007 upcycle
     peaked at 1.96% in November 2005, slightly below the 2.03% level achieved during the previous
     expansion.

     The flexible labor peak of 2005 did not surpass prior peaks because of: 1) a relatively deeper trough
     following the 2001 recession, 2) a relatively shorter expansionary cycle of 2002-2007, and 3) the IT
     staffing drag in 2002-2003.

     We believe flexible labor in the US still has ample secular growth potential, despite not surpassing
     the prior peak levels in the last economic expansion, as the memory of the great recession continues
     to spur businesses to look to flex staffing as a source of agility in an uncertain economic
     environment.
                                      Rising Rate of Increase in Flex Penetration Over Economic Cycles, 1972 -2011
                    2.25%
                                                                             Flex Penetration
                    2.00%                                                    1.72% in April '11
                                                                                                         D
                    1.75%                                                               C
                                                                                                                        E
                    1.50%

                    1.25%

                    1.00%                                     B

                    0.75%
                                        A
                    0.50%

                    0.25%

                    0.00%
                         1/72 1/74 1/76 1/78 1/80 1/82 1/84 1/86 1/88 1/90 1/92 1/94 1/96 1/98 1/00 1/02 1/04 1/06 1/08 1/10

                        Source: US Bureau of Labor Statistics, National Bureau of Economic Research, and J.P. Morgan
Global Trends in Flexible Staffing Penetration

     The US has long enjoyed liberal labor regulations related to flexible staffing. American companies
     and workers have both benefited from the flexibility offered by staffing services.

     The long-term trend is toward global deregulation/adoption of flex staffing due to the benefits of
     flexible labor, despite the residual opposition from unions and socialist political parties.

     Flexible staffing offers benefits to companies (by allowing for a more variable cost base and
     opportunities to preview full-time workers), to workers (by allowing for more flexible work-life
     arrangements), and to governments/society (by helping to reduce unemployment rates and related
     costs).

                                       2009 Flexible Staffing Penetration in Key Global Regions


                           3.6%


                                      2.5%


                                                 1.7%          1.7%    1.7%        1.6%
                                                                                              1.3%

                                                                                                     0.7%

                           U.K.    Netherlands France     Belgium     Japan     Germany       U.S.   Italy

                          Source: CIETT Economic Report 2011
Demystifying Flexible Staffing's Role in Today's Labor Market & Economy

Más contenido relacionado

La actualidad más candente

២០ ស្វាយរៀង
២០ ស្វាយរៀង២០ ស្វាយរៀង
២០ ស្វាយរៀង
sam seyla hun
 
១២ រាជធានីភ្នំពេញ
១២ រាជធានីភ្នំពេញ១២ រាជធានីភ្នំពេញ
១២ រាជធានីភ្នំពេញ
sam seyla hun
 
Summary of JUNE 2010 Existing Home Sales Statistics
Summary of JUNE 2010 Existing Home Sales StatisticsSummary of JUNE 2010 Existing Home Sales Statistics
Summary of JUNE 2010 Existing Home Sales Statistics
NAR Research
 
២១ ខេត្តតាកែវ
២១ ខេត្តតាកែវ២១ ខេត្តតាកែវ
២១ ខេត្តតាកែវ
sam seyla hun
 
០៥ ខេត្តកំពង់ស្ពឺ
០៥ ខេត្តកំពង់ស្ពឺ០៥ ខេត្តកំពង់ស្ពឺ
០៥ ខេត្តកំពង់ស្ពឺ
sam seyla hun
 
1-800-PetMeds September 2011 Business Plan
1-800-PetMeds September 2011 Business Plan1-800-PetMeds September 2011 Business Plan
1-800-PetMeds September 2011 Business Plan
Pet Meds
 
Commercial Aviation
Commercial AviationCommercial Aviation
Commercial Aviation
Embraer RI
 
ashland awt%20info
ashland awt%20infoashland awt%20info
ashland awt%20info
finance29
 

La actualidad más candente (16)

Future Challenges for Big Pharma
Future Challenges for Big PharmaFuture Challenges for Big Pharma
Future Challenges for Big Pharma
 
២០ ស្វាយរៀង
២០ ស្វាយរៀង២០ ស្វាយរៀង
២០ ស្វាយរៀង
 
១២ រាជធានីភ្នំពេញ
១២ រាជធានីភ្នំពេញ១២ រាជធានីភ្នំពេញ
១២ រាជធានីភ្នំពេញ
 
SERI 2011 Korea Economic Forum
SERI 2011 Korea Economic ForumSERI 2011 Korea Economic Forum
SERI 2011 Korea Economic Forum
 
Summary of JUNE 2010 Existing Home Sales Statistics
Summary of JUNE 2010 Existing Home Sales StatisticsSummary of JUNE 2010 Existing Home Sales Statistics
Summary of JUNE 2010 Existing Home Sales Statistics
 
២១ ខេត្តតាកែវ
២១ ខេត្តតាកែវ២១ ខេត្តតាកែវ
២១ ខេត្តតាកែវ
 
Oct 2009 Tatum Survey
Oct 2009 Tatum SurveyOct 2009 Tatum Survey
Oct 2009 Tatum Survey
 
Korean social game market trend report (2011Q2) Eng
Korean social game market trend report (2011Q2) EngKorean social game market trend report (2011Q2) Eng
Korean social game market trend report (2011Q2) Eng
 
Presentation On Sustaining A Healthy Enterprise During Turbulent Times
Presentation On Sustaining A Healthy Enterprise During Turbulent TimesPresentation On Sustaining A Healthy Enterprise During Turbulent Times
Presentation On Sustaining A Healthy Enterprise During Turbulent Times
 
០៥ ខេត្តកំពង់ស្ពឺ
០៥ ខេត្តកំពង់ស្ពឺ០៥ ខេត្តកំពង់ស្ពឺ
០៥ ខេត្តកំពង់ស្ពឺ
 
1-800-PetMeds September 2011 Business Plan
1-800-PetMeds September 2011 Business Plan1-800-PetMeds September 2011 Business Plan
1-800-PetMeds September 2011 Business Plan
 
Commercial Aviation
Commercial AviationCommercial Aviation
Commercial Aviation
 
Managing Fixed Income Risk in an Uncertain World
Managing Fixed Income Risk in an Uncertain WorldManaging Fixed Income Risk in an Uncertain World
Managing Fixed Income Risk in an Uncertain World
 
ashland awt%20info
ashland awt%20infoashland awt%20info
ashland awt%20info
 
Carpe Diem: Living in a Post-Durbin World (Credit Union Conference Session Pr...
Carpe Diem: Living in a Post-Durbin World (Credit Union Conference Session Pr...Carpe Diem: Living in a Post-Durbin World (Credit Union Conference Session Pr...
Carpe Diem: Living in a Post-Durbin World (Credit Union Conference Session Pr...
 
BLA Capabilities
BLA CapabilitiesBLA Capabilities
BLA Capabilities
 

Destacado

Taking Services Procurement Beyond Contingent Workers: Opportunities And Chal...
Taking Services Procurement Beyond Contingent Workers: Opportunities And Chal...Taking Services Procurement Beyond Contingent Workers: Opportunities And Chal...
Taking Services Procurement Beyond Contingent Workers: Opportunities And Chal...
Beeline
 

Destacado (6)

Beeline Analytics Workshop
Beeline Analytics WorkshopBeeline Analytics Workshop
Beeline Analytics Workshop
 
What Influences Contract Talent Usage?
What Influences Contract Talent Usage?What Influences Contract Talent Usage?
What Influences Contract Talent Usage?
 
Beyond Savings – Measuring What Matters
Beyond Savings – Measuring What MattersBeyond Savings – Measuring What Matters
Beyond Savings – Measuring What Matters
 
Integrating Your VMS into an Evolving Program
Integrating Your VMS into an Evolving ProgramIntegrating Your VMS into an Evolving Program
Integrating Your VMS into an Evolving Program
 
Welcome to the New Procurement: Scenarios and Strategies to Ride the Services...
Welcome to the New Procurement: Scenarios and Strategies to Ride the Services...Welcome to the New Procurement: Scenarios and Strategies to Ride the Services...
Welcome to the New Procurement: Scenarios and Strategies to Ride the Services...
 
Taking Services Procurement Beyond Contingent Workers: Opportunities And Chal...
Taking Services Procurement Beyond Contingent Workers: Opportunities And Chal...Taking Services Procurement Beyond Contingent Workers: Opportunities And Chal...
Taking Services Procurement Beyond Contingent Workers: Opportunities And Chal...
 

Similar a Demystifying Flexible Staffing's Role in Today's Labor Market & Economy

Ajax Integration Guide
Ajax Integration GuideAjax Integration Guide
Ajax Integration Guide
rajivmordani
 
India in a debt trap
India in a debt trapIndia in a debt trap
India in a debt trap
RS P
 
Investment Strategy
Investment StrategyInvestment Strategy
Investment Strategy
guest88148
 
App tracker file
App tracker fileApp tracker file
App tracker file
saranya3123
 
CDS Europe government history
CDS Europe government historyCDS Europe government history
CDS Europe government history
genauer
 
Commercial aviation
Commercial aviationCommercial aviation
Commercial aviation
Embraer RI
 
Commercial Aviation
Commercial AviationCommercial Aviation
Commercial Aviation
Embraer RI
 
alcoa 2008 meeting presentation
alcoa 2008 meeting presentationalcoa 2008 meeting presentation
alcoa 2008 meeting presentation
finance8
 

Similar a Demystifying Flexible Staffing's Role in Today's Labor Market & Economy (20)

Ajax Integration Guide
Ajax Integration GuideAjax Integration Guide
Ajax Integration Guide
 
2009 Ebig.Boston.Basis Risk
2009 Ebig.Boston.Basis Risk2009 Ebig.Boston.Basis Risk
2009 Ebig.Boston.Basis Risk
 
India in a debt trap
India in a debt trapIndia in a debt trap
India in a debt trap
 
Quick hits 020613 Europe
Quick hits 020613   EuropeQuick hits 020613   Europe
Quick hits 020613 Europe
 
USA LATAM Road Show
USA LATAM Road ShowUSA LATAM Road Show
USA LATAM Road Show
 
Wesp mb42
Wesp mb42Wesp mb42
Wesp mb42
 
מצגת רשות ניירות ערך
מצגת רשות ניירות ערךמצגת רשות ניירות ערך
מצגת רשות ניירות ערך
 
Columbus 2020 Q4 Report 2012
Columbus 2020 Q4 Report 2012Columbus 2020 Q4 Report 2012
Columbus 2020 Q4 Report 2012
 
SAP HANA For Genome Data Processing: A Deep Dive
SAP HANA For Genome Data Processing: A Deep DiveSAP HANA For Genome Data Processing: A Deep Dive
SAP HANA For Genome Data Processing: A Deep Dive
 
Investment Strategy
Investment StrategyInvestment Strategy
Investment Strategy
 
Multiple Species Grazing in Oklahoma
Multiple Species Grazing in OklahomaMultiple Species Grazing in Oklahoma
Multiple Species Grazing in Oklahoma
 
PeopleBrowsr Kred ad:tech Influence13SF
PeopleBrowsr Kred ad:tech Influence13SFPeopleBrowsr Kred ad:tech Influence13SF
PeopleBrowsr Kred ad:tech Influence13SF
 
App tracker file
App tracker fileApp tracker file
App tracker file
 
CDS Europe government history
CDS Europe government historyCDS Europe government history
CDS Europe government history
 
2012 Q1 Report
2012 Q1 Report2012 Q1 Report
2012 Q1 Report
 
3Q07 presentation
3Q07 presentation3Q07 presentation
3Q07 presentation
 
Vietnam Macro And Equity Market 2011 Dec22
Vietnam Macro And Equity Market 2011 Dec22Vietnam Macro And Equity Market 2011 Dec22
Vietnam Macro And Equity Market 2011 Dec22
 
Commercial aviation
Commercial aviationCommercial aviation
Commercial aviation
 
Commercial Aviation
Commercial AviationCommercial Aviation
Commercial Aviation
 
alcoa 2008 meeting presentation
alcoa 2008 meeting presentationalcoa 2008 meeting presentation
alcoa 2008 meeting presentation
 

Último

+971581248768>> SAFE AND ORIGINAL ABORTION PILLS FOR SALE IN DUBAI AND ABUDHA...
+971581248768>> SAFE AND ORIGINAL ABORTION PILLS FOR SALE IN DUBAI AND ABUDHA...+971581248768>> SAFE AND ORIGINAL ABORTION PILLS FOR SALE IN DUBAI AND ABUDHA...
+971581248768>> SAFE AND ORIGINAL ABORTION PILLS FOR SALE IN DUBAI AND ABUDHA...
?#DUbAI#??##{{(☎️+971_581248768%)**%*]'#abortion pills for sale in dubai@
 
Why Teams call analytics are critical to your entire business
Why Teams call analytics are critical to your entire businessWhy Teams call analytics are critical to your entire business
Why Teams call analytics are critical to your entire business
panagenda
 

Último (20)

AWS Community Day CPH - Three problems of Terraform
AWS Community Day CPH - Three problems of TerraformAWS Community Day CPH - Three problems of Terraform
AWS Community Day CPH - Three problems of Terraform
 
How to Troubleshoot Apps for the Modern Connected Worker
How to Troubleshoot Apps for the Modern Connected WorkerHow to Troubleshoot Apps for the Modern Connected Worker
How to Troubleshoot Apps for the Modern Connected Worker
 
Ransomware_Q4_2023. The report. [EN].pdf
Ransomware_Q4_2023. The report. [EN].pdfRansomware_Q4_2023. The report. [EN].pdf
Ransomware_Q4_2023. The report. [EN].pdf
 
Exploring the Future Potential of AI-Enabled Smartphone Processors
Exploring the Future Potential of AI-Enabled Smartphone ProcessorsExploring the Future Potential of AI-Enabled Smartphone Processors
Exploring the Future Potential of AI-Enabled Smartphone Processors
 
Apidays New York 2024 - Passkeys: Developing APIs to enable passwordless auth...
Apidays New York 2024 - Passkeys: Developing APIs to enable passwordless auth...Apidays New York 2024 - Passkeys: Developing APIs to enable passwordless auth...
Apidays New York 2024 - Passkeys: Developing APIs to enable passwordless auth...
 
MS Copilot expands with MS Graph connectors
MS Copilot expands with MS Graph connectorsMS Copilot expands with MS Graph connectors
MS Copilot expands with MS Graph connectors
 
Cyberprint. Dark Pink Apt Group [EN].pdf
Cyberprint. Dark Pink Apt Group [EN].pdfCyberprint. Dark Pink Apt Group [EN].pdf
Cyberprint. Dark Pink Apt Group [EN].pdf
 
Biography Of Angeliki Cooney | Senior Vice President Life Sciences | Albany, ...
Biography Of Angeliki Cooney | Senior Vice President Life Sciences | Albany, ...Biography Of Angeliki Cooney | Senior Vice President Life Sciences | Albany, ...
Biography Of Angeliki Cooney | Senior Vice President Life Sciences | Albany, ...
 
Repurposing LNG terminals for Hydrogen Ammonia: Feasibility and Cost Saving
Repurposing LNG terminals for Hydrogen Ammonia: Feasibility and Cost SavingRepurposing LNG terminals for Hydrogen Ammonia: Feasibility and Cost Saving
Repurposing LNG terminals for Hydrogen Ammonia: Feasibility and Cost Saving
 
"I see eyes in my soup": How Delivery Hero implemented the safety system for ...
"I see eyes in my soup": How Delivery Hero implemented the safety system for ..."I see eyes in my soup": How Delivery Hero implemented the safety system for ...
"I see eyes in my soup": How Delivery Hero implemented the safety system for ...
 
Strategies for Landing an Oracle DBA Job as a Fresher
Strategies for Landing an Oracle DBA Job as a FresherStrategies for Landing an Oracle DBA Job as a Fresher
Strategies for Landing an Oracle DBA Job as a Fresher
 
Polkadot JAM Slides - Token2049 - By Dr. Gavin Wood
Polkadot JAM Slides - Token2049 - By Dr. Gavin WoodPolkadot JAM Slides - Token2049 - By Dr. Gavin Wood
Polkadot JAM Slides - Token2049 - By Dr. Gavin Wood
 
Rising Above_ Dubai Floods and the Fortitude of Dubai International Airport.pdf
Rising Above_ Dubai Floods and the Fortitude of Dubai International Airport.pdfRising Above_ Dubai Floods and the Fortitude of Dubai International Airport.pdf
Rising Above_ Dubai Floods and the Fortitude of Dubai International Airport.pdf
 
+971581248768>> SAFE AND ORIGINAL ABORTION PILLS FOR SALE IN DUBAI AND ABUDHA...
+971581248768>> SAFE AND ORIGINAL ABORTION PILLS FOR SALE IN DUBAI AND ABUDHA...+971581248768>> SAFE AND ORIGINAL ABORTION PILLS FOR SALE IN DUBAI AND ABUDHA...
+971581248768>> SAFE AND ORIGINAL ABORTION PILLS FOR SALE IN DUBAI AND ABUDHA...
 
AXA XL - Insurer Innovation Award Americas 2024
AXA XL - Insurer Innovation Award Americas 2024AXA XL - Insurer Innovation Award Americas 2024
AXA XL - Insurer Innovation Award Americas 2024
 
Why Teams call analytics are critical to your entire business
Why Teams call analytics are critical to your entire businessWhy Teams call analytics are critical to your entire business
Why Teams call analytics are critical to your entire business
 
Apidays New York 2024 - The Good, the Bad and the Governed by David O'Neill, ...
Apidays New York 2024 - The Good, the Bad and the Governed by David O'Neill, ...Apidays New York 2024 - The Good, the Bad and the Governed by David O'Neill, ...
Apidays New York 2024 - The Good, the Bad and the Governed by David O'Neill, ...
 
DEV meet-up UiPath Document Understanding May 7 2024 Amsterdam
DEV meet-up UiPath Document Understanding May 7 2024 AmsterdamDEV meet-up UiPath Document Understanding May 7 2024 Amsterdam
DEV meet-up UiPath Document Understanding May 7 2024 Amsterdam
 
CNIC Information System with Pakdata Cf In Pakistan
CNIC Information System with Pakdata Cf In PakistanCNIC Information System with Pakdata Cf In Pakistan
CNIC Information System with Pakdata Cf In Pakistan
 
Corporate and higher education May webinar.pptx
Corporate and higher education May webinar.pptxCorporate and higher education May webinar.pptx
Corporate and higher education May webinar.pptx
 

Demystifying Flexible Staffing's Role in Today's Labor Market & Economy

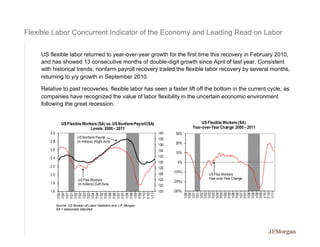
  • 1. Flexible Labor Concurrent Indicator of the Economy and Leading Read on Labor US flexible labor returned to year-over-year growth for the first time this recovery in February 2010, and has showed 13 consecutive months of double-digit growth since April of last year. Consistent with historical trends, nonfarm payroll recovery trailed the flexible labor recovery by several months, returning to y/y growth in September 2010. Relative to past recoveries, flexible labor has seen a faster lift off the bottom in the current cycle, as companies have recognized the value of labor flexibility in the uncertain economic environment following the great recession. US Flexible Workers (SA) vs. US Nonfarm Payroll (SA) US Flexible Workers (SA) Levels: 2000 – 2011 Year-over-Year Change: 2000 – 2011 3.0 140 30% US Nonfarm Payroll 138 2.8 (in millions) (Right Axis) 20% 136 2.6 134 10% 2.4 132 130 0% 2.2 128 (10%) 2.0 126 US Flex Workers US Flex Workers 124 Year-over-Year Change 1.8 (20%) (in millions) (Left Axis) 122 1.6 120 (30%) 1/00 1/02 7/02 7/04 1/05 1/07 7/07 1/09 7/09 7/00 1/01 7/01 1/03 7/03 1/04 7/05 1/06 7/06 1/08 7/08 1/10 7/10 1/11 1/00 1/01 7/04 7/05 7/06 7/07 7/08 7/09 7/10 7/00 7/01 1/02 7/02 1/03 7/03 1/04 1/05 1/06 1/07 1/08 1/09 1/10 1/11 Source: US Bureau of Labor Statistics and J.P. Morgan SA = seasonally adjusted
  • 2. Professional Segment Drives Flexible Staffing Growth and Profitability Over recent economic cycles, US flexible staffing has been diversifying beyond its traditional commercial staffing base and is gaining further adoption in professional staffing (including accounting/finance and IT) that is key to future secular growth of the broader sector. Light industrial staffing, which led the flex staffing recovery in early 2010 has shown strong growth through the past year, although it has begun to come up against tougher year-over-year comps. IT staffing led the professional staffing segment’s return to year-over-year growth in mid-2010, while non-IT professional staffing (e.g., accounting/finance and legal) returned to growth later in 2010. We believe flexible labor in the professional staffing segment possesses greater opportunities to outpace the growth and profitability of commercial staffing over this economic expansion. US Flexible Staffing Market Growth by Sector Highlights Higher Growth Rates in Professional Staffing: 1996 - 2012F Type of Flexible Staffing 1996 1997 1998 1999 2000 2001 2002 2003 2004 2005 2006 2007 2008 2009 2010 2011F 2012F Office/Clerical 9% 10% 8% 7% 7% (5% ) (5% ) 2% 4% 8% 2% (2% ) (9% ) (24% ) 9% 13% 8% Industrial 7% 10% 6% 7% 7% (12% ) 0% 5% 23% 7% 3% (5% ) (7% ) (25% ) 27% 14% 7% Commercial Staffing 8% 10% 7% 7% 7% (9%) (3%) 4% 14% 7% 3% (4%) (8%) (25%) 19% 14% 7% IT Staffing NA NA 23% 11% 9% (13% ) (21% ) (3% ) 10% 10% 9% 8% (4% ) (20% ) 13% 12% 12% Finance & Accounting 5% 9% 10% 15% 15% 27% 24% (8% ) (3% ) 2% 6% 6% 1% (28% ) (7% ) 4% 9% Technical/Engineering NA NA 21% 24% 26% (9% ) (13% ) 2% 21% 23% 11% 6% (7% ) (29% ) 2% 10% 8% Healthcare 24% 29% 8% 7% 4% 4% (6% ) (3% ) 11% 16% 10% 11% 2% (23% ) 14% 11% 8% Legal NA NA 25% 20% 17% 14% 13% 9% 12% 18% 15% 7% 6% (41% ) 10% 9% 17% Other NA NA 25% 20% 29% 13% (9% ) (1% ) 10% 11% 8% 7% 4% (26% ) 9% 5% 10% Professional Staffing 31% 33% 18% 13% 13% (2%) (7%) (3%) 8% 11% 9% 7% (1%) (25%) 7% 11% 10% Total US Flexible Staffing 16% 19% 12% 10% 10% (5%) (5%) 0% 11% 9% 6% 2% (4%) (25%) 12% 12% 9% Source: Staffing Industry Analysts (SIA), April 2011
  • 3. Flexible Staffing Still a Secular Growth Industry Flexible staffing penetration (flexible labor as a % of the total labor market) in the 2002-2007 upcycle peaked at 1.96% in November 2005, slightly below the 2.03% level achieved during the previous expansion. The flexible labor peak of 2005 did not surpass prior peaks because of: 1) a relatively deeper trough following the 2001 recession, 2) a relatively shorter expansionary cycle of 2002-2007, and 3) the IT staffing drag in 2002-2003. We believe flexible labor in the US still has ample secular growth potential, despite not surpassing the prior peak levels in the last economic expansion, as the memory of the great recession continues to spur businesses to look to flex staffing as a source of agility in an uncertain economic environment. Rising Rate of Increase in Flex Penetration Over Economic Cycles, 1972 -2011 2.25% Flex Penetration 2.00% 1.72% in April '11 D 1.75% C E 1.50% 1.25% 1.00% B 0.75% A 0.50% 0.25% 0.00% 1/72 1/74 1/76 1/78 1/80 1/82 1/84 1/86 1/88 1/90 1/92 1/94 1/96 1/98 1/00 1/02 1/04 1/06 1/08 1/10 Source: US Bureau of Labor Statistics, National Bureau of Economic Research, and J.P. Morgan
  • 4. Global Trends in Flexible Staffing Penetration The US has long enjoyed liberal labor regulations related to flexible staffing. American companies and workers have both benefited from the flexibility offered by staffing services. The long-term trend is toward global deregulation/adoption of flex staffing due to the benefits of flexible labor, despite the residual opposition from unions and socialist political parties. Flexible staffing offers benefits to companies (by allowing for a more variable cost base and opportunities to preview full-time workers), to workers (by allowing for more flexible work-life arrangements), and to governments/society (by helping to reduce unemployment rates and related costs). 2009 Flexible Staffing Penetration in Key Global Regions 3.6% 2.5% 1.7% 1.7% 1.7% 1.6% 1.3% 0.7% U.K. Netherlands France Belgium Japan Germany U.S. Italy Source: CIETT Economic Report 2011