SlideShare una empresa de Scribd logo
1 de 175
Descargar para leer sin conexión
MEANINGFUL ELECTRONIC MEDICAL RECORD USE:
A SURVEY OF FAMILY PRACTICE CLINICS
BEKKI LYNN TAGG
BA, University of Lethbridge, 2000
BN, University of Lethbridge, 2008
A Thesis
Submitted to the School of Graduate Studies
of the University of Lethbridge
in Partial Fulfillment of the
Requirements for the Degree
MASTER OF SCIENCE (HEALTH SCIENCES)
Faculty of Health Sciences
University of Lethbridge
LETHBRIDGE, ALBERTA, CANADA
© Bekki Lynn Tagg, 2015
MEANINGFUL ELECTRONIC MEDICAL RECORD USE:
A SURVEY OF FAMILY PRACTICE CLINICS
BEKKI LYNN TAGG
Date of Defence: April 8, 2015
Dr. C. Steinke Associate Ph.D.
Supervisor Professor
Dr. O. Awosoga Assistant Ph.D.
Thesis Examination Committee Member Professor
Dr. B. Williams Associate Ph.D.
Thesis Examination Committee Member Professor
Dr. C. Witcher Assistant Ph.D.
Chair, Thesis Examination Committee Professor
iii
Dedication
This thesis is dedicated to my life love, Bernardo Perez, and to my dear friends
Valerie Moldowin, Nicole Hemsing, Krista Craik, and Christine Kennedy for carrying me
through this long process. It is also dedicated to Dr. Rozemin Kizuk, who first gave me
the opportunity to learn and explore the possibilities of how EMRs can transform a
physician clinic. Finally, to my supervisor - Dr. Claudia Steinke, who never let me give
up on myself.
iv
Abstract
This thesis explores the factors related to increased meaningful use of Electronic Medical
Records (EMRs) in family physician clinics in Alberta, Canada. Measurements were
made using the Innovation Implementation scale (Klein & Sorra, 1996) and the
Meaningful EMR Use scale, newly developed by Price, Lau, and Lai (2011).
Demographics were collected for profession, age, gender, years of experience, and took
into account the participation of the clinic in government improvement programs
including Physician Office Systems Program (POSP) and primary care networks (PCNs).
Implementation Climate was found to be the most important factor in predicting high
levels of EMR use. Historically documented barriers to EMR implementation were
neither as significant nor impactful as the literature suggested.
v
Acknowledgements
I would like to thank Dr. Olu Awosoga for his vast statistical knowledge, and his
endless patience in educating me throughout this project and Dr. Bernie Williams for his
ongoing support, encouragement and feedback. Also, I would like to acknowledge my
colleague Samuel Mantey Ofori Dei for freely offering his help whenever it was needed.
Next, I say a thank you to Peter Kellet for his willingness to provide consultation in this
work, and would also like to acknowledge the timely support of my editor, Shanaya
Nelson. Finally, I give a heartfelt thank you to each and every participant who gave of
their time to make this research possible. I am endlessly grateful for your support.
vi
Table of Contents
Dedication.......................................................................................................................... iii
Abstract.............................................................................................................................. iv
Acknowledgements..............................................................................................................v
Table of Contents............................................................................................................... vi
List of Tables ..................................................................................................................... ix
List of Figures......................................................................................................................x
Chapter One: Introduction ...................................................................................................1
Background Information..........................................................................................2
Chapter Two: Review of the Literature ...............................................................................4
Benefits of EMR Use...............................................................................................4
Improved efficiency.....................................................................................4
Improved patient care and safety.................................................................5
Financial benefits.........................................................................................5
Support for future health care ......................................................................6
Barriers to EMR Use................................................................................................6
Financial concerns .......................................................................................6
Trust in technology ......................................................................................7
Perception of insufficient technology support .............................................7
Steep learning curve.....................................................................................8
Difficulty with EMR implementation..........................................................8
Comparing Benefits and Barriers.............................................................................9
Critical Success Factors .........................................................................................10
Business case .............................................................................................10
Physician support.......................................................................................10
Local champion..........................................................................................12
Planning phase ...........................................................................................12
Project management skills .........................................................................12
Process reengineering ................................................................................13
Meaningful EMR Use............................................................................................13
Measurement..............................................................................................14
Theoretical Framework..........................................................................................18
Innovation implementation model .............................................................18
Climate for implementation...........................................................18
Innovation-values fit ......................................................................20
Skills, incentives, absence of obstacles and commitment..............21
Implementation effectiveness ........................................................22
Strategic accuracy of innovation....................................................22
Innovation effectiveness ................................................................22
Chapter Three: Research Design .......................................................................................23
Research Objectives...............................................................................................23
Research Hypotheses .............................................................................................23
Research Design.....................................................................................................24
Phase I: pilot study.....................................................................................24
Phase II: Quantitative survey.....................................................................25
Setting ............................................................................................25
vii
Sample............................................................................................26
Data collection method ..................................................................26
Step 1: Recruit participants................................................27
Step 2: Secure participants and distribute memo to
inform.................................................................................27
Step 3: Distribute letter of consent with customized
survey link..........................................................................28
Step 4: Participants complete the survey ...........................29
Data collection experience.............................................................29
Challenges and limitations.................................................29
Strengths ............................................................................31
Instrument and measures................................................................31
Klein and Sorra‟s innovation implementation model ........32
Meaningful EMR use.........................................................38
Demographics questions: About you.................................45
Demographics questions: About your clinic......................45
Data analysis ..................................................................................46
Ethics..............................................................................................46
Chapter Four: Discussion of Results..................................................................................48
Demographics: Organizational Level of Analysis.................................................48
Demographics – Individual Level of Analysis ......................................................50
Descriptive Statistics..............................................................................................52
Innovation implementation model .............................................................53
Implementation climate .................................................................53
Innovation-values fit ......................................................................53
Skills ..............................................................................................54
Absence of obstacles......................................................................54
Incentives .......................................................................................55
Commitment ..................................................................................55
Implementation effectiveness ........................................................56
Meaningful EMR use.................................................................................56
Recoding for meaningful EMR use ...............................................56
Medication .....................................................................................58
Laboratory......................................................................................59
Medical imaging ............................................................................59
Referrals.........................................................................................60
Decision support ............................................................................60
Electronic communication and connectivity..................................61
Patient support ...............................................................................61
Administrative process...................................................................61
Reporting and population health management ..............................62
Summary of meaningful EMR use ................................................62
Analysis of Variance..............................................................................................63
POSP funding.............................................................................................63
Primary care network.................................................................................64
Health zone ................................................................................................64
viii
Profession...................................................................................................66
Age.............................................................................................................66
Gender........................................................................................................67
Correlations............................................................................................................67
Innovation implementation correlations ....................................................67
Meaningful EMR use correlations.............................................................70
Testing the Hypotheses..........................................................................................70
Hypothesis 1...............................................................................................70
Hypothesis 2...............................................................................................74
Hypothesis 3...............................................................................................78
Hypothesis 4...............................................................................................83
Financial concerns .........................................................................83
Trust in technology ........................................................................85
Perception of insufficient technology support ...............................86
Steep learning curve.......................................................................87
Difficulty with EMR implementation............................................89
Factor analysis ...............................................................................90
Chapter Five: Conclusion, Recommendations and Limitations ........................................93
Demographics ........................................................................................................93
Relationships Among the Measures.......................................................................94
Impact of Barriers ..................................................................................................95
Other Findings .......................................................................................................96
Conclusion .............................................................................................................97
Contributions and implications for practice...............................................97
Limitations of the research.........................................................................98
Directions for future research ....................................................................99
References........................................................................................................................101
Appendices.......................................................................................................................106
A: Complete Survey for Meaningful Electronic Medical Record Use................107
B: Letter of Informed Consent.............................................................................125
C: Alberta Health Services Zone Map.................................................................127
D: Call for Participants ........................................................................................128
E: Description of Research Study........................................................................129
F: Demographics Tables ......................................................................................131
G: Innovation Implementation Model .................................................................135
H: Meaningful Electronic Medical Record Use...................................................151
ix
List of Tables
Table 1 eHealth Observatory‟s Meaningful EMR Use Stages ......................................... 16
Table 2 Innovation Implementation Items........................................................................ 32
Table 3 Factor Analysis for Skills .................................................................................... 36
Table 4 Reliability and Variance for the measure of Meaningful EMR Use.................... 45
Table 5 Most Common EMR by Health Zone.................................................................. 48
Table 6 Most Common EMR Programs by Respondent and Clinic................................. 49
Table 7 Summary of Demographic Information............................................................... 51
Table 8 Descriptive Statistics and Frequencies for Commitment..................................... 55
Table 9 Recoded Responses for Meaningful EMR Use Scale.......................................... 57
Table 10 Descriptive Statistics and Frequencies for “Medications” Item ........................ 58
Table 11 Descriptive Statistics for Meaningful EMR Use Categories (Sub-Measures)... 63
Table 12 Analysis of Variance for Health Zones – Innovation Implementation and
Meaningful EMR Use........................................................................................ 65
Table 13 Comparison of Means Between Health Zones Used in ANOVA...................... 65
Table 14 Correlations for Innovation Implementation Model Measures.......................... 68
Table 15 Correlation for Implementation Effectiveness and measures for motivation.... 68
Table 16 Correlations Between Meaningful EMR Use Sub-Measures ............................ 69
Table 17 Correlations for Hypothesis 1............................................................................ 71
Table 18 Correlations for Meaningful EMR Use and Implementation Climate Sub-
Measures ............................................................................................................ 71
Table 19 Correlations for Implementation Climate and Meaningful EMR Use Sub-
Measures ............................................................................................................ 72
Table 20 Correlation Between Implementation Climate Sub-Measures and Meaningful
EMR Use Sub-Measures.................................................................................... 73
Table 21 Correlations for Hypothesis 2............................................................................ 75
Table 22 Correlations for Meaningful EMR Use and Innovation Values Fit Sub-Measures
............................................................................................................................ 75
Table 23 Correlations Between Innovation Values Fit and Meaningful EMR Use Sub-
Measures ............................................................................................................ 76
Table 24 Correlations Between Sub-Measures of Innovation Values Fit and Sub-
Measures of Meaningful EMR Use ................................................................... 77
Table 25 Correlations Between Meaningful EMR Use, Implementation Climate and
Commitment ...................................................................................................... 78
Table 26 Number of Respondents Working in POSP-Funded Clinics............................. 84
Table 27 Items Correlated to Financial Concerns............................................................. 85
Table 28 Items Correlated to Trust in Technology........................................................... 86
Table 29 Items Related to Perception of Insufficient Technology Support...................... 87
Table 30 Items Related to Steep Learning Curve ............................................................. 88
Table 31 Difficulty with EMR Implementation................................................................ 89
Table 32 Factor Loadings for Hypothesis 4 Items............................................................ 90
x
List of Figures
Figure 1. Differences in EMR adoption assessments of one case study clinic at two
and eight months post EMR adoption measuring several aspects of EMR
functioning........................................................................................................ 17
Figure 2. Klein and Sorra‟s Model: Determinants and Consequences of
Implementation Effectiveness. ......................................................................... 21
Figure 3. Model 1 with Commitment as a moderator – diagram...................................... 80
Figure 4. Model 1 data output with commitment as a moderator – measurements.......... 80
Figure 5. Model 4 with a Commitment as a mediator – diagram ..................................... 81
Figure 6. Model 4 data output with Commitment as a mediator – measurements ........... 82
1
Chapter One: Introduction
This purpose of this research was to assess the level of meaningful electronic
medical record (EMR) usage of several family practice clinics throughout the province of
Alberta. The researcher chose to explore this area of study due to her professional
experience working in a family practice clinic and her efforts to increase the level of
meaningful EMR use within the clinic. In addition, the researcher was motivated by the
fact that Canada historically lags when it comes to EMR adoption, reporting 27.7%
adoption rates (Canadian Medical Association, 2010) in comparison to those in the 90%
range in other parts of the world (Jha, Doolan, Grandt, Scott, & Bates, 2008). Even when
an EMR system has been implemented, it does not necessarily mean that it is being used
in a meaningful, thorough, or high-level way (i.e., to its full capacity).
There were three key reasons why this was an important area to research: First,
the current literature was limited and there were very few existing studies examining
meaningful EMR use in family practice clinics. Second, this was an important safety
issue to the general public. For example, if a family physician owned an EMR that had
the capability to protect a patient from a serious medication interaction, there would be an
expectation that the technology would be used. Unfortunately, that was often not the case.
Last, in the Province of Alberta, taxpayer money had gone to support the adoption and
use of EMRs through a program called the Physician Office Systems Program (POSP).
Between 2001 and 2014, POSP provided funding, information technology services and
change management services to help physicians automate their practices. With so many
resources being allocated to this adoption process, this researcher feels there should also
be accompanying efforts (and evaluation of efforts) to ensure high levels of meaningful
2
EMR usage. The research applied a quantitative study to explore current levels and
contributing factors to having high levels of meaningful EMR usage within family
practice clinic in the Province of Alberta, Canada.
Background Information
The first conceptualization of a computerized medical record was in the 1960s by
an American physician named Lawrence L. Weed; his goal was to improve patient care
by automating and enhancing accessibility to their information (Pinkerton, 2006). This
work went on to form the PROMIS project at the University of Vermont, where they
aspired to develop the first EMR. The Mayo clinic also began emerging with ideas during
this time. More and more companies and academic institutions developed systems in the
coming decades, including Harvard‟s COSTAR system, the Technicon system, the
HELP, system, the Duke‟s „The Medical Record‟, and the Regenstrief record in Indiana
(Pinkerton, 2006).
Although the concept for an EMR originated in North America, Canada and the
United States have remained the two countries with the lowest clinical EMR usage at 20–
28% (Jha et al., 2008). In fact, according to MacKinnon and Wasserman (2009), the
health care industry was “decades behind other industries with respect to information
technology (IT) adoption and utilization” (p. 50). It has been only recently, however, that
incentives like POSP have been offered to physicians in order to entice EMR adoption. In
contrast, countries such as in Australia, Germany, Netherlands, New Zealand and the
United Kingdom, have reached EMR adoption levels of over 90% (Jha et al., 2008). In
New Zealand, the adoption tactics have been much more strategic than those in North
America. The New Zealand government started a three-stage plan in 1992 that ended 17
3
years later with 100% EMR adoption rate, 75% claiming to utilize functionality in a
meaningful way (Jha et al., 2008). This was accomplished mainly through the
development of a national health identifier database, privacy and information-sharing
agreements, one-time grants to physicians to purchase hardware, and mandatory
electronic billing. As of 2009, there was one privately owned company, HealthLink,
which was the sole provider for all electronic health care services (Protti, Dip, &
Johansen, 2008a, 2008b).
4
Chapter Two: Review of the Literature
Benefits of EMR Use
The benefits of EMR usage are plentiful. Some are as rudimentary as the benefits
of a computer. Others are broader and look to improve the health care system at large.
These benefits include improved efficiency and patient care, financial benefits, and
support for future health care.
Improved efficiency. One way of showing the administrative benefits of EMR
use is to shed light on the drawbacks of paper charts: inconsistent abbreviations, illegible
handwriting, and difficulty in searching for specific information in a timely manner. In
contrast, with an EMR, information is available and legible to all. Multiple people can
access a chart simultaneously. Forms and requisitions can be set up to pull demographics
and other data from the chart instantaneously. This eliminates the need for duplicate data
entry, and sifting through several sheets in a paper chart. Referral letters and billing can
be done at the time of the appointment, instead of being done after hours or in between
patients. The cost of paper goes down as forms and referrals can be e-faxed. Templates
can be created to reduce the number of steps to chart and bill for common procedures or
visit types (Eichenwald Maki & Petterson, 2008; Gartee, 2007; Lai, Lau, & Shaw, 2009;
Miller & Sim, 2004).
The availability of EMR-integrated messaging systems also improves timeliness
and accuracy of inter-office communication, and can take the place of post-it notes
around the office. Tasks are easily transferred from one clinic employee to another,
thereby reducing “dropped balls” (Miller & Sim, 2004, p. 119).
5
Improved patient care and safety. The usage of EMRs supports clinical
decision-making, improves coordination and quality of care, and increases patient safety
(Gartee, 2007). The existence of built-in medical libraries improves the physician‟s
ability to access these resources within the EMR, reducing the need to go to an external
source. Clinical decision supports such as allergy alerts, drug incompatibilities, and
prompts to follow protocols reduce errors and improve patient safety. This increased
safety impacts not only the patient, but the health care system at large. The use of EMRs
also provides a landscape conducive to the proactive management of all patients,
especially those with chronic diseases like diabetes, hypertension and heart failure.
Proactive management includes screening reminders and vaccination recommendations,
while tracking test-order status and improving coordination of care across providers
(Eichenwald Maki & Petterson, 2008; Fraser et al., 2005; Gartee, 2007, 2011; Lai et al.,
2009; Miller & Sim, 2004).
Financial benefits. Improved efficiency provides indirect financial benefits of
running a more efficient office. However, there are more direct financial benefits from
EMRs that serve both the health care system and the physician. An EMR is able to
improve efficiency of care for patients by reducing duplicate testing. This ability is
especially important to taxpayers in the Canadian health care system, in which every test
is covered by public funds. For the most part, Canadian physicians use fee-for service as
their funding model. This means that for each type of visit and service that a physician
provides, there is a specific fee code attached. The physician reports the visit type and
service that they provide, bill for the service, and receive payment from the provincial
college of physicians and surgeons. The 2010 National Physician Survey reported that for
6
those physicians reporting a primary remuneration method, 41.9% used fee-for-service.
Of the 32.3% reporting a blended method, 46.36% of that blend was fee-for service
(Canadian Medical Association, 2010). With the integration of EMR and electronic
billing services, there is an improved process of data capture within the clinic visit that
can ensure that the physician bills for all of the services provided (Miller & Sim, 2004).
Support for future health care. An EMR helps those who provide health care to
think past the present moment, and plan for the future. When data are entered, it is
entered in such a way that is retrievable in a meaningful way down the road. Diagnoses,
medications, laboratory results, and many other bits of information are recorded as
discrete pieces of data in an organized database. This opens the door for clinical practice
reporting, program reporting, and research in a way that would be extremely cumbersome
to the point of being nearly impossible with paper charts (Lai et al., 2009). It also paves
the way for the possibility of interoperable health information systems. At this point in
the computer age, our health information should transfer from one end of the country to
the other with the ease and security.
Barriers to EMR Use
There are several reasons why Canada lags behind in EMR implementation. The
literature shows barriers including financial concerns, trust in technology, perception of
insufficient IT support, steep learning curve, complex technology, and difficulty with
EMR implementation.
Financial concerns. Cost has been one of the first issues identified by physicians
as the most common reason for not adopting in the early days of EMRs in the late 1990s
and early 2000s (Valdes, Kibbe, Tolleson, Kunik, & Petersen, 2004). These costs
7
involved four main categories. The first was initial start-up costs, including all hardware
as well as the loss of productivity during the changeover period. The second was staff
training and EMR customization costs. The third category was ongoing costs to maintain
the system, including monthly fees to the vendor. The final category was the matter of
return on investment. This potential barrier continues to be a particularly troublesome
one, as the family practice clinics see the direct impact of the outgoing costs, but it is the
healthcare system that reaps the rewards of proactive care. The return on investment is
therefore seemingly intangible and uncertain for family physicians (Boonstra &
Broekhuis, 2010).
Trust in technology. Unfortunately, in the early years, some issues arose relating
to EMR vendor reliability. Schmitt and Wofford (2002) declared there has been volatility
in the health care IT industry, and that it is only recently that EMR vendors have started
to fulfill what they have been promising. In a study of computer-naïve primary care
centres in Greece in 2007, frequent system “breakdowns” were reported (Samoutis et al.,
2007). A review of the literature by Boonstra and Broekhuis (2010) revealed that there
was much evidence to support the notion that physicians were concerned about the
stability, safety, and access to their patients‟ data in the event of viruses, computer
crashes, or power outages. However, Dawes and Chan (2010) insisted that EMRs were a
safe way to collect and store patient data. Their review of the literature found no reported
incidences of “catastrophic data loss” (Dawes & Chan, 2010, p. 16).
Perception of insufficient technology support. Simon et al. (2007) found that
two thirds of physicians identified a lack of technical support as a major barrier to their
clinics adopting EMR systems. The literature showed that physicians feel like the IT
8
support is inadequate, and that there was slow turn-around time by vendors for solving
technical issues once an EMR had been implemented (Boonstra & Broekhuis, 2010;
Ludwick & Doucette, 2009b; Samoutis et al., 2007).
Steep learning curve. As EMR systems are attempting to simulate the complex
problem solving that occurs in a physician‟s mind during a patient encounter, they are
likewise, complex. To some physicians and support staff with less familiarity with
technology, the learning curve is very steep. This is seen as quite the burden to physicians
(Boonstra & Broekhuis, 2010). In a study in Greece, physicians reported “poor usability”
and “non-user friendly interface features” in the initial implementation phase, which
surprised the researchers, because they had selected the EMR taking ease of navigation
into account (Samoutis et al., 2007). The authors concluded that this finding was due to
the lack of base level skill of some physicians and support staff, and that more attention
to workflow development was needed.
Difficulty with EMR implementation. The enormity of the project of
implementing an EMR is the most daunting barrier of all. Implementing an EMR changes
everything about the way the office runs. There are processes for how a patient is booked,
how they are checked in, how they are processed at the time of their appointment, and
how the appointment is conducted. Even after the patient is gone, there are workflows for
completing billing. As Lyons and Klasko (2011b) attested, “The introduction of an EMR
into the practice precipitates the need to re-think nearly every process in the office – even
some processes that appear, upon first glance, to be unrelated to the task of recording
medical information” (p. 38). The proper functioning and usability of the EMR tomorrow
depends on the quality of the information entered in today.
9
Research has shown that EMR implementations are costly, time consuming, and
failure rates are high. A recent case study in Canada following three hospitals as they
implemented EMR solutions in a hospital setting saw a success rate of only 33%
(Lapointe & Rivard, 2005). This means that of the three hospitals that attempted the
implementation of an EMR system, two of them eventually announced the
implementation a failure, stopped using the software entirely, and reverted back to their
original workflows. This is a situation not unique to health care. Even in the management
world, failure rates as high as 50% are reported for large-scale company-wide IT
implementations that are business-world equivalents of EMRs (Bradley, 2009).
Even if an implementation initially succeeds, there is still the phenomenon of
Information System (IS) Avoidance, which Kane and Labianca (2011) defined as “an
individual‟s preference to avoid working with an information system despite the need and
opportunity to do so” (p. 505). As Kane and Labianca further described, there are a range
of resistance behaviours that range from active (physical destruction or vandalism) to
passive (lack of cooperation or apathy) that thwart the long-term success of an EMR
implementation.
Comparing Benefits and Barriers
Many literary sources have documented numerous benefits that prove to offset the
cost of the EMR, including reduction of clerical labour, transcription costs, order entry,
documentation time, and storage and supply costs (Renner, 1996; Schmitt & Wofford,
2002). An EMR system also increases ease of access to and availability of patient
information, standardization of documentation, and inter-staff communication. EMR use
also allows for better data and patient panel analysis and reporting, including billing
10
maximization (Miller & Sim, 2004; Schmitt & Wofford, 2002). When discussing this
issue, Walker (2005) concluded, “We have enough estimates. They suggest, as
persuasively as such estimates can, that well-implemented EMRs have the potential to
improve health care at an acceptable cost” (p. 1120).
Critical Success Factors
Since significant resources are invested into the adoption of EMRs, there has been
much research into critical success factors investigating this topic. Individual factors
found in the literature are a having a business case, physician support, an internal project
champion, a planning phase, strong project management skills and process reengineering.
Business case. Just like any other business venture, there must be a strategic and
economic justification for implementing an EMR, as well as a way to measure the return
on the investment (MacKinnon & Wasserman, 2009). Wang et al. (2003) statistically
hypothesized one such business case using an actual patient panel from a primary care
ambulatory setting in Massachusetts. Wang et al. used variations that included “light
EMR users” (p. 400), “full EMR users” (p. 400), “most pessimistic assumptions”
(p. 397), and “most favourable assumptions” (p. 399), and concluded that the potential
net benefit over a 5-year period showed a range of $2,300–330,900 USD, with an average
of $86,400 USD per provider. Their research suggested that there is a solid 5-year
business case for every family practice clinic to adopt an EMR, even for the most
minimal users, under the most modest of circumstances (Wang et al., 2003).
Physician support. Technology implementation projects require the strong
support of the physicians involved. This is, however, not an easy feat to accomplish. In a
clinic, the physicians are in the unique position of having top management authority and
11
also being involved in the day-to-day use of the software. As Mishra, Anderson, Angst,
and Agarwal (2012) described it, physicians have historically had unprecedented
autonomy and independence when it came to conducting their work routines. With the
introduction of EMRs, physicians can perceive this intrusion in one of two ways: they
can see it as either reinforcing or a deteriorating their perceived care provider identity.
Mishra et al. found that if the local community of physicians saw the adoption of an EMR
as something positive that would reinforce the provider identity, then the EMR would be
assimilated well into physician practice. Conversely, if the local community of physicians
saw the adoption of an EMR as something that would deteriorate the perceived identity,
the EMR assimilation would not go well.
Another study regarding physician attitudes and EMR adoption used social
network theory as its framework. The authors divided up health care personnel into three
groups: physicians; paraprofessionals (nurses, physician assistants, technicians, and those
who are in direct or indirect care-giving roles); and administrative personnel (Venkatesh,
Zhang, & Sykes, 2011). They looked at in-group ties (e.g., physician to physician) and
out-group ties (e.g., physician to paraprofessional) and studied the effect these ties had on
EMR use. Venkatesh et al. (2011) found that with every profession except physicians,
both in-group and out-group ties led to a positive effect on EMR use. However, with
physicians, in-group ties led to a negative effect on EMR use, and out-group ties led to no
effect on use. According to Venkatesh et al. (2011), only physicians who are on the social
periphery of the network will be less influenced by their peers, and are more likely to
explore the use of an EMR system.
12
Although a very complicated phenomenon, without the local physician support
throughout the process of adoption and implementation, there is a great risk of the project
failing (MacKinnon & Wasserman, 2009). Ultimately, it is up to the implementation team
to negotiate the relationship with the physician throughout the implementation process in
order to have a successful outcome.
Local champion. Several pieces of literature identify the importance of a local
project champion or “super-user” (Duperier, 2011, p. 29), who may or may not be a
physician (Dawes & Chan, 2010; Duperier, 2011; Ludwick & Doucette, 2009a;
MacKinnon & Wasserman, 2009). Gagnon et al. (2010) was more specific with the roles
and characteristics this champion would ideally possess. They asserted that champions
act as a bridge between the software developers and the clinical users. Champions
participate in the design and decision making, ensuring that their “vision” is always kept
as the goal. They lead and train the team, while providing technical support along the
way. This point person can act as the direct liaison with the project manager, as the
natural family practice office environment can have diffuse authority, leading to
confusion of who to turn to for problem-solving (Lyons & Klasko, 2011a).
Planning phase. A deliberate planning phase is often neglected in smaller non-
management organizations, such as medical practices. This phase, however, is absolutely
essential to ensure that the business case is translated into clear goals and objectives with
concrete processes and timelines (MacKinnon & Wasserman, 2009).
Project management skills. Project managers are as essential as champions in
the transition process. They act as a liaison between the EMR vendor and the clinic,
orchestrating the initial rollout procedure, and addressing post-implementation concerns.
13
Often, smaller healthcare organizations do not have personnel who possess project
management skills, and so must fill this need by looking to independent contractors or
vendor consultants (MacKinnon & Wasserman, 2009).
Process reengineering. During an EMR implementation, there are massive
changes in clinic workflow processes as well as business processes, including accounting
and other reporting structures. It is critical that a point person carefully thinks about all of
these processes, creates new workflows, and then implements proper training for all of
the employees that will be using the new system (MacKinnon & Wasserman, 2009).
Venkatesh et al. (2011) cited this as a roadblock seeing as it is typical of the health care
system to inflict new software on its professionals with little or no training or process
support. This causes delayed full adoption and delayed realization of benefits.
Meaningful EMR Use
The concept of “meaningful use” of an EMR originated from a report put out by
the U.S. Department of Health and Human Services (2010). It outlined a program for
financial compensation for EMR usage called the Health Information Technology for
Economic and Clinical Health Act (2009). In order to access this staged funding, and to
avoid penalties, physicians needed to meet three stages of meaningful use by 2015. Stage
1 criteria involved “electronically capturing health information in a structured format”
(U.S. Department of Health and Human Services, 2010, p. 44321). Stage 2 criteria
involved “expand[ing] upon stage 1 criteria to encourage the use of health IT for
continuous quality improvement at the point of care and the exchange of information in
the most structured format possible” (U. S. Department of Health and Human Services,
2010, p. 44321). Stage 3 criteria required the following:
14
Focus on promoting improvements in quality, safety, and efficiency leading to
improved health outcomes, focusing on decision support for national high priority
conditions, patient access to self-management tools, access to comprehensive
patient data through robust, patient centered health information exchange and
improving population health. (U. S. Department of Health and Human Services,
2010, p. 44322)
Canada has also created a program to utilize funding geared towards enhancing
EMR solutions, called Electronic Medical Records and Integration (Canada Health
Infoway, 2014). This program used Clinical Value Levels to outline EMR capabilities.
Clinical Value Level 1 includes using the EMR to “enter patient demographics; record
encounters, problem lists, allergies, immunizations; record and print prescriptions;
generate alerts and reminders; and receive laboratory tests” (Zucker, 2011, para. 4).
Clinical Value Level 2 focused on interoperability of electronic prescribing with
established drug information systems in place in many provinces and territories.
In the past few years, Alberta has surged ahead of other provinces in Canada and
greatly increased the number of family practice clinics operating an EMR. One private,
unpublished study by POSP reported a 79.4% EMR adoption rate among general family
physicians (D. Sheplawy, personal communication, January 29, 2013). However, this
study simply asked the question of whether or not the physician‟s office owned and
operated EMR software. It did not ask any questions regarding how much it was being
used, what and how data were being captured, nor did it assess the meaningfulness of the
use. The use of an EMR is a vast spectrum of greys that must be defined, if it is going to
be studied.
Measurement. The standard scale for measuring clinical meaningfulness of EMR
usage is Healthcare Information and Management Systems Society (HIMSS) analytics.
This scale was first developed to measure EMR use in hospitals in the United States, but
15
has also been applied in hospitals in Canada (HIMSS Analytics™, 2015a). There are
seven stages of use, with the higher the number being a more advanced level of use. The
questionnaires to produce these results are not available to the public, but the can be
viewed on the HIMSS Analytics™ (2015b) webpage
(www.himssanalytics.org/stagesGraph.asp).
There are few existing studies that have examined the actual level of EMR usage
in family practice clinics, but researchers‟ estimates suggest EMRs are being utilized at
only a fraction of their potential capacity. Despite Canada‟s good intentions to increase
the number of physicians using EMR systems, Dermer and Morgan (2010) claimed that
only 14% of those physicians are using their EMRs to capture data in a meaningful way.
One would expect to also see research documenting EMR implementation failure
rates in family practice offices, but repeated searches by this researcher did not yield any
results. The researcher‟s experience working in a family practice clinic, and in speaking
to others in the same position, leads her to arrive at the conclusion that when EMR
implementations go wrong in a family practice clinic, physicians and clinic managers are
simply not in a financial position to declare an adoption a “failure” and walk away from
it. Instead, they simply must bear with the situation because they have invested too much
money to go back (Cramer, 2010, p. 30). These clinics will achieve only a low “stage” of
EMR use.
Researchers at the eHealth Observatory at the University of Victoria in British
Columbia adapted the HIMMS analytics scale used in hospitals in the United States and
Canada in order to be used in family practice clinics (Price, Lau, & Lai, 2011). This scale
measures meaningful EMR use in stages from 0–5 (see Table 1). Throughout this paper,
16
the terms meaningful use, stage, and level of EMR use will be used as interchangeable
concepts.
Table 1
eHealth Observatory’s Meaningful EMR Use Stages
Stage Cumulative Capabilities
0 Traditional paper-based practice.
1 Electronic reference material, but still paper charting.
2 Partial use of computers at point of care for recording patient information.
3 Computer has replaced paper chart.
4 Advanced clinical decision support in use, including practice level reporting.
5 Full EMR interconnected with regional/community hospitals, other practices,
labs and pharmacies for collaborative care.
Price et al. (2011) organized their scale into 10 functional categories: Health
Information, Laboratory Management, Diagnostic Imaging, Prescription Management,
Referrals, Decision Support, Electronic Communication & Connectivity, Patient Support,
Administrative Processes, and Reporting and Population Health Management.
The only research found applying this same staging tool was a case study reported
by Price et al. (2011) that was performed in a full-service family practice clinic in rural
British Columbia documenting their stage of EMR use at two months after adopting an
EMR, and then a follow-up at eight months post-adoption (see Figure 1). The data
showed that from month two to month eight there was an EMR stage increase from 2.17
to 2.87. However, not all categories had equal improvement. The greatest improvement
was in practice reporting and reflection.
17
Figure 1. Differences in EMR adoption assessments of one case study clinic at two and
eight months post EMR adoption measuring several aspects of EMR functioning.
Note. From “Measuring EMR adoption: A framework and case study” by M. Price, F.
Lau, and J. Lai, 2011, Electronic Health Care, 10(1), p. e26. Copyright 2011 by
Longwoods.
It is important to note that in order to attain a Level 5 there needs to be certain
provincial infrastructure in place. For example, if there is no provincial repository for
prescription information and no system for e-prescribing, there is a ceiling effect that
keeps a clinic at a Level 4 until such a time that those larger provincial systems are
available.
It was only after this researcher had undertaken her study using the above-
described measurement tool when the HIMSS Analytics™ (2015b) website released a set
of results for a questionnaire based on an ambulatory or clinic-based EMR. Like the other
HIMSS Analytics™ measurement tools, the actual questionnaire itself is not available for
the public, but the results can be viewed on the HIMSS Analytics™ website
(www.himssanalytics.org/emram/index.aspx).
18
Theoretical Framework
The main theoretical framework for this study is based on the work of Klein and
Sorra (1996) and their Innovation Implementation Model.
Innovation implementation model. Katherine Klein and Johann Sorra coined the
term of Innovation Implementation in their seminal work “The Challenge of Innovation
Implementation” published in 1996. Since their model focused on “innovations that
require the active and coordinated use of multiple organizational members to benefit the
organization” (Klein & Sorra, 1996, p. 1057), this model is appropriate to use when
assessing EMR implementations (see Figure 2).
There were some basic definitions Klein and Sorra (1996) used in their model that
were slightly different than the typically understood meanings. Klein and Sorra defined
Innovation Adoption as “a decision, typically made by senior organizational managers,
that employees within the organization will use the innovation in their work” (p. 1055).
In contrast, they defined Innovation Implementation as “the transition period during
which targeted organizational members ideally become increasingly skillful, consistent,
and committed in their use of an innovation” (Klein & Sorra, 1996, p. 1057).
Implementation Failure is said to occur when “employees use the innovation less
frequently, less consistently, or less assiduously than required for the potential benefits of
the innovation to be realized” (Klein & Sorra, 1996, p. 1055). More and more, they
claimed, it is the implementation of the innovation that is to blame for failures, not the
innovation itself.
Climate for implementation. When describing the climate in an organization
during the implementation of a specific innovation, Klein and Sorra (1996) referred to “a
19
targeted employees‟ shared summary perceptions of the extent to which their use of a
specific innovation [would be] rewarded, supported, and expected within their
organization” (p. 1060). In order to gain a positive climate for implementation, Klein and
Sorra scoured existing literature and found several techniques, policies and practices that
may influence how an innovation is used. Techniques included adequate training, user
support, time for users to experiment with the innovation, and praise from supervisors for
innovation use. Policies included constraints on budgetary expenses during
implementations, job reassignment, or even job elimination for employees who did not
learn to use the new innovation (Klein & Sorra, 1996).
Klein and Sorra (1996) applied a three-pronged approach to foster a strong
implementation climate by “(a) ensuring employee skill in innovation use, (b) providing
incentives for innovation use and disincentives for innovation avoidance, and
(c) removing obstacles to innovation use” (p. 1060). Klein, Conn, and Sorra (2001)
validated the concept of climate for implementation in their study when it came to
management support, financial resource availability, policies and practices, and overall
climate. The validation study conducted by Holahan, Aronson, Jurkat, and Schoorman
(2004) found that climate for implementation is a key predictor for implementation
effectiveness, especially when measured as a quality of innovation use and consistency of
use. They also found that an organization‟s receptivity towards change was an important
antecedent of climate (Holahan et al., 2004). Osei-Bryson, Dong, and Ngwenyama (2008)
discovered an unexpected finding utilizing a data analysis method called the multivariate
adaptive regression splines technique, which is “a technique used for discovering,
evaluating, and describing the causal links between factors in any theoretical model”
20
(p. 510). Osei-Bryson et al. discovered that managers have the ability to manipulate both
the Implementation Climate and the Innovation-Values Fit in order to achieve innovation
implementation. The proposed causal links in Klein and Sorra‟s (1996) innovation
implementation model is discussed below (see Figure 2).
Ensuring that a climate for implementation exists in family practice clinics refers
to employee perceptions of the practices, procedures, and behaviours that get rewarded,
supported, and expected with regard to the use of EMRs. An example of this is when
members of clinic staff are consistently informed about new updates to the technology,
software, and changes to the workflow (i.e., mean emphasis). These actions help maintain
their interest about why they should care about the system by making it feel like “their”
system (i.e., goal emphasis). Task Support empowers them by giving them the tools to
keep them up to date with training, and Reward Emphasis serves as a reward system and
cause employees to be extrinsically motivated to use the system better.
Innovation-values fit. Klein and Sorra (1996) also hypothesized that “employees‟
commitment to the use of an innovation is a function of the perceived fit of the
innovation to employees‟ values” (pp. 1062–1063). They also state that “innovation-
values fit describes the extent to which targeted users perceive that use of the innovation
will foster (or conversely, inhibit) the fulfillment of their values” (Klein & Sorra, 1996, p.
1063). As mentioned above, Osei-Bryson et al. (2008) found evidence that managers
have the ability to manipulate Innovation-Values Fit in order to improve the
implementation of innovations. An unexpected finding was that there was the influence
of innovation-values fit on implementation effectiveness. These researchers stated that
high Innovation-Values Fit helped users to obtain better skills, perceive less obstacles,
21
and feel more motivated while using the system. One explanation for this was that if
users felt that the innovation would help them solve their work-related problems, they
would internalize the benefits of the system. They would, therefore, be more open to
learning about and mastering the system, thus becoming more intrinsically motivated.
Dong, Neufeld, and Higgins (2008) replicated these findings in their study.
Figure 2. Klein and Sorra‟s Model: Determinants and Consequences of Implementation
Effectiveness.
Note. From “The Challenge of Innovation Implementation,” by K. J. Klein & J. S. Sorra,
1996, Academy of Management Journal, 21, p. 1056. Copyright 1996 by Klein & Sorra.
Reprinted with permission.
Skills, incentives, absence of obstacles and commitment. If the family practice
clinic can establish an Implementation Climate and ensure an effective Innovation-Values
Fit, the presence of these things can help to facilitate enhanced Skills (e.g., a higher-order
understanding of the EMR, and how some parts of the EMR system link with other parts
of the system); facilitate the Absence of Obstacles (e.g., identifying and removing
organizational or technical barriers for using the EMR system); ensure Incentives
(e.g., determining if employees are discouraged or motivated to use the EMR system);
and facilitate employee Commitment (e.g., seeks to understand if employees attach
22
personal meaning to the EMR system, and if they enjoy mastering it and discussing it
with other colleagues).
Implementation effectiveness. The combination of the above stated measures can
lead to Implementation Effectiveness. In this state, employees choose to use the system
given the opportunity, and feel it is a valuable addition to the work practices of the
organization.
Strategic accuracy of innovation. In their original article, Klein and Sorra (1996)
did not mention “strategic accuracy of innovation” (p. 1056) outside of the diagram of the
actual model. In a correspondence with K. Klein (personal communication, November
28, 2012), the researcher was told that this measure indicated whether the innovation was
actually appropriate for the organization. However, Klein stated that this measure has not
been empirically tested, as there is currently no “formal” measure for doing so. It is for
this reason that this researcher decided to exclude this from her conceptual framework.
Innovation effectiveness. The final measure of Klein and Sorra‟s (1996) model
titled Innovation Effectiveness (p. 1056) is intended to be measured by a scale assessing
the level of use for the innovation under study. Therefore, in this case, this researcher
chose to apply Price et al.‟s (2011) measure of Meaningful EMR Use into this portion of
the model. The measure of Meaningful EMR Use looked at the extent to which clinics
optimize the capabilities of their EMR system.
23
Chapter Three: Research Design
Research Objectives
The primary research objective for this study was to assess meaningful EMR use
in family practice clinics across the Province of Alberta. In conducting this project, this
researcher did the following:
 Applied the Klein and Sorra (1996) model for innovation implementation to
understand the importance of developing a climate for implementation with
EMRs in family practice clinics.
 Explored the Implementation Climate and the level of Meaningful EMR Use
that existed within family practice clinics in the province of Alberta.
 Examined the importance of innovation values fit in achieving meaningful
EMR use.
 Provided family practice clinics with a measure with which they could gauge
the extent of EMR use.
Research Hypotheses
The following hypotheses guided this research study:
 Hypothesis 1: In the family practice clinics under study, there is a positive
relationship between Implementation Climate and Meaningful EMR Use.
 Hypothesis 2: In the family practice clinics under study, there is a positive
relationship between Innovation-Values Fit and Meaningful EMR Use.
 Hypothesis 3: The stronger the implementation climate for a given innovation
(i.e., EMRs), the greater employees‟ use of that innovation (i.e., meaningful
EMR use), provided there are high levels of commitment.
24
 Hypothesis 4: Some of the barriers to EMR use identified in the literature will
also be found in the present study (e.g., lack of training and support).
Research Design
The research consisted of a pilot study followed by a quantitative study. The full
survey for Meaningful EMR Use can be found in Appendix A along with the Letter of
Informed Consent (see Appendix B).
Phase I: pilot study. The researcher first conducted a pilot study to assess the
overall data collection process including the online survey instrument. The researcher
was interested in assessing the time it would take to complete the survey, the flow of
questions, wording, and to ensure face and content validity.
The pilot study consisted of a convenience sample of five participants (n = 5)
from one single physician family practice clinic, which was the primary place of
employment of the researcher. The sample included one family practice physician, one
receptionist, one registered nurse, and two medical office assistants. To avoid conflict of
interest, this pilot study data was not included in the final analysis. The setting, sample,
instrument and measures, and methods for data collection and data analysis were similar
to what is described below in Phase II, only differing in the means for recruitment and the
sample size. The researcher chose this clinic because in November of 2010 this clinic
switched EMR systems, moving from the EMR Clinicare to the EMR Telus Med-Access.
In addition, the clinic voiced support for the study and agreed to participate.
The pilot study participants were asked to complete the online survey and then
provide feedback on their experience with the survey. Some of the feedback received
pointed to a few missing commas, misspelled words. It was also reported that the survey
25
was quite long. In addition, Question 10 originally reading, “Is your clinic a Family Care
Clinic (FCC),” was confusing to the respondents. They mistakenly identified their
primary care network (PCN) clinic as a family care clinic (FCC). Question 10 was then
changed to, “Is your clinic a Family Care Clinic (FCC)? (Definition: An FCC is one of
the 24 facilities announced for creation throughout Alberta by [former] Premier Alison
Redford in June 2013. A clinic cannot be both a PCN facility and an FCC facility).” The
researcher did not conduct statistical analysis of the pilot study data due to the small
sample size.
Phase II: Quantitative survey. The changes suggested by the participants in the
pilot study were made. Next, a quantitative survey was conducted.
Setting. The setting for this study involved family practice clinics within the
industry of health care in the Province of Alberta. According to a representative at POSP,
at the time the study was conducted, there were approximately 845 family practice clinics
and 2,895 family practice physicians in Alberta (D. Sheplawy, personal communication,
March 24, 2013). Within this number, approximately 2,300 of these physicians used an
EMR system (D. Sheplawy, personal communication, January 29, 2013).
Family practice clinics serve as a first point of contact for the public entering the
health care system. Family doctors are held as the most responsible person to create and
maintain a patient‟s health care record over the years. Patients go to their family doctor
for episodic care such as infections, intermittent care such as prenatal care, and chronic
care such as diabetes and hypertension management. They also manage patients who
have complex multiple conditions, and those who are on multiple continuous
prescriptions. The responsibility for regular screening for things like breast, colon, and
26
cervical cancer, as well as several other diseases and conditions also falls on the
shoulders of the family physician.
Some clinics in this research had only the reception staff and one physician, while
others had a number of multidisciplinary staff members (e.g., dieticians, physiotherapists,
registered nurses, etc.). In addition, some clinics were members of the PCN and some
were funded through POSP while others were not. Regardless of these factors,
participants had only to fulfill the criteria of working in a family practice clinic in Alberta
that had some sort of EMR system currently in place.
Sample. At the organizational level of analysis, there were approximately 845
(N = 845) family practice clinics in Alberta and 2,895 family practice physicians.
Assuming one assistant per physician, the researcher aimed to recruit 338 (n = 338)
participants in order to have a 95% CI, or n = 247 to have a 90% CI. Due to unexpected
recruitment difficulties, the researcher was only able to recruit 139 participants (41%
success rate) during the 8-month period that she attempted to collect data.
Inclusion criteria involved clinics located within any one of the five zones within
Alberta Health Services (refer to Appendix C: Alberta Health Services Zone Map) who
currently had an EMR system in place (e.g., Telus Wolf, Practice Solutions, Telus Med-
Access, etc.). The researcher attempted to acquire data from PCN and non-PCN clinics as
well as POSP and non-POSP clinics.
Data collection method. Study participants were recruited through convenience
sampling. The researcher chose to apply a quantitative method to this study through the
use of an online survey. The following steps were applied for data collection:
27
Step 1: Recruit participants. A faxed letter to inform (i.e., Call for Participants)
was the primary means for recruiting participants (refer to Appendix D). This faxed letter
was sent to all physician clinics in the Province of Alberta; a list that was acquired from
the College of Physicians and Surgeons website. Of the 845 family practice clinics listed
on the College of Physicians and Surgeons of Alberta (n.d.) website, 802 clinics had fax
numbers, and 43 did not. The researcher sent faxes to each of the 802 clinics with fax
numbers, and sent paper copies to the other 43 clinics. One month later, the letter was
faxed again to those clinics who had not yet responded. Realizing that this population
was quite difficult to access, the researcher decided to employ other strategies to acquire
participants. The researcher networked with her professional contacts across the province.
A call for participants was put in both the Primary Care Initiative and Alberta Medical
Association‟s monthly electronic newsletter. There was a notice to POSP employees, a
post placed on a professional networking site, Yammer (2015), and a message sent out to
the Alberta Screening and Prevention Improvement Facilitators Network group (AS@p).
Finally, some cold calls were done to clinics in specific health care zones in which
limited interest was shown initially. Through various efforts, 47 clinics responded with
interest to participate in the survey. Of those 47 clinics, 44 ultimately did complete the
survey, which provided a clinic participation rate of 93.6%. In looking at the response
rate of 44 clinics out of the total 845 clinics in the province, the response rate is 5.2%.
Step 2: Secure participants and distribute memo to inform. During the recruitment
process (i.e., in the Call for Participants letter; see Appendix D), interested subjects were
asked to contact the researcher directly for further information. Once participants emailed
the researcher to express their interest, the researcher then emailed them the Description
28
of Research Study (see Appendix E). The most crucial part to the smooth progression of
the data collection process was that the participants followed the instructions on the Call
for Participants. The participants were asked to include the name of their clinic and the
city or town name so that the researcher could generate a clinic code, which was used to
keep all clinic specific data together. If a participant emailed their interest without
including these details, the researcher responded with an email requesting this
information. The intent in following this procedure was that the researcher could produce
customized reports for participating clinics and provide a more thorough analysis at the
level of the organization. This was a preferable method because it would avoid the
potential for entry errors that would compromise the integrity of the data set. If a
participant had concerns about providing this information, it was stressed that only the
researcher would have the master list of which clinics belonged with which clinic codes,
and that this information would remain private and in a secured location known only to
the researcher and her supervisor.
Step 3: Distribute letter of consent with customized survey link. Once participants
were confirmed, the researcher then followed up with an email that contained the Letter
of Informed Consent (see Appendix B), and another email containing a customized link
to the online survey. In the body of this email, the researcher asked the participant to
complete the survey within a two-week time frame. The participant was encouraged to
tell others who would also qualify for the research (family physician with an EMR). If the
participant knew of other people in another clinic who would like to participate, the
individual was asked to email the researcher with the name of the new clinic and the city
or town to ensure the new clinic had a code in order to complete the survey.
29
The call for participants was almost always responded to by the clinic manager.
Acting as a point person, the manager emailed the researcher to express interest in having
their clinic participate. The manager then inquired amongst staff members of their clinic
as to who wanted to participate, and then provided a list of email addresses to the
researcher. The researcher registered the participants in the database using
SurveyMonkey® (2015). She then emailed each of the participants individually with a
unique link to the online survey, as well as the document Description of Research Study
found in Appendix E. If a participant had not responded to their unique link within a 2-
week time period, a reminder email was sent.
Step 4: Participants complete the survey. The online survey was completed by the
participants using SurveyMonkey® (2015), which is a web survey development cloud-
based company. When participants clicked on the survey link provided to them and
completed the survey, the data were automatically compiled into the online database. The
survey took approximately 25 minutes to complete (refer to Appendix D for survey
questions). Of the 194 participants emailed from within the 44 (n = 44) participating
clinics, 139 (n = 139) completed the survey, providing a response rate of 72% (attrition
rate of 28%). The researcher chose to analyze the data at two levels of analysis: the clinic
or organizational level (n = 44) as well as the individual level (n = 139).
Data collection experience. Upon reflecting on the process of recruitment and
data collection, several challenges, limitations, and strengths were discovered that merit
discussion. These items are discussed in the following section.
Challenges and limitations. In general, the researcher experienced many
difficulties in accessing this population. The researcher had to be quite persistent with
30
those clinics and individuals who had agreed to participate in order for them to follow
through to completion.
Having a unique link sent to each participant was found to be a detriment to
participation. There were times that a participant wanted to “send the link” to their
colleague. Instead, the researcher had to get the email address of the colleague and go
through the SurveyMonkey® (2015) registration process in order to have the new
individual participate. As a result, some participants expressed hesitancy to complete the
survey because their responses were going to be temporarily connected to their email
addresses. The reason for this process was clearly explained to the participants in the
“Description of Research Study” document (see Appendix E), but nevertheless this
remained a factor for some participants.
The researcher found that in speaking with health care leaders at a program
planning level there was great interest in and support for the study, and many expressed a
desire to participate; however, because they did not work at a clinic level, they did not fit
the criteria, and could not participate. These people would try to recruit down to specific
clinics they worked with, but this method didn‟t yield any new participants. This spoke to
the difficulty of getting those at a clinic level to participate in practice assessment, even
when they were invited by their direct leaders.
It was also challenging to recruit several employees from one clinic. Most times, a
clinic had less than five people participating, and many times only the clinic manager
completed the survey. This was an unexpected phenomenon. The researcher did
emphasize that there would be a benefit to the clinic if there were many participants,
31
since participating clinics would receive a customized report with a summary of findings.
However, this did not sufficiently motivate the target group.
The length of the survey deterred many from participating. There were several
participants who didn‟t finish the entire survey in their first session. These people usually
did not return on their own to finish it, and reminder emails ad to be sent requesting the
participants to complete the survey.
Strengths. Many of the people contacted throughout the process were pleased that
research was being done in this area, and expressed a desire to view the results once the
study was complete.
Although the unique links and registration process made it difficult to recruit
participants, knowing a participant‟s clinic opened up interesting possibilities for analysis
that would not otherwise exist. The registration process also allowed for a very accurate
calculation of participation rates. The length of the survey, though identified as one of the
challenges to recruitment, allowed for a comprehensive view of the study topic.
Instrument and measures. The survey instrument used in this study included
well-established measures borrowed from the literature, and a recently developed
measure borrowed from industry. The well-established (scholarly) measure was the Klein
and Sorra (1996) 50-item measure for assessing innovation implementation (i.e.
Innovation Implementation Model). The industry measure was developed by Price et al.
(2011), and was a 30-item EMR adoption survey measure (Meaningful EMR Use). In
addition, some demographic questions were included that assessed attributes of
participants‟ clinics (including number of general practice physicians and number of non-
physician health care employees in the clinic), and personal demographics such as age
32
and gender. By asking these questions, the researcher hoped to explore the relationship
between innovation implementation and meaningful EMR use as it related to employee
composition, age, and gender. The survey instrument contained a total of 80 questions
and 20 demographic questions with an estimated completion time of 25 minutes.
Klein and Sorra’s innovation implementation model. The content validity of the
Innovation Implementation Model and its measures came from its long-established use in
several studies across several sectors. Construct validity was also shown by the
established reliabilities between α = 0.78 to 0.92 reported in the literature. The first 50
items came directly from Klein and Sorra‟s (1996) Innovation Implementation
questionnaire, and were categorized according to the following measures:
Implementation Climate, Innovation-Values Fit, Skills, Absence of Obstacles, Incentives,
Commitment, and Implementation Effectiveness. Factor analyses were conducted for all
of these measures, and are included in the Appendix G with a sample presented in Table
2.
Table 2
Innovation Implementation Items
Variable Questionnaire Item Description
Implementation Climate 17 items; 14a–14q  Mean Emphasis 14a–14c
 Goal Emphasis 14d–14f
 Task Support 14g–14l
 Reward Emphasis 14m–14q
Innovation-Values Fit 13 items; 15a–15m  Quality 15a–15f
 Locatibility 15g–15j
 Flexibility and Coordination
15k–15m
Skills 6 items; 16a–16f
Absence of Obstacles 3 items; 17a–17c
Incentives 2 items; 18a–18b
33
Variable Questionnaire Item Description
Commitment 4 items; 19a–19d
Implementation
Effectiveness
5 items; 20a–20e
Implementation Climate assessed “employees shared summary perceptions of the
extent to which their use of a specific innovation is [would be] rewarded, supported, and
expected within their organization” (Klein & Sorra, 1996, p. 1060). This 17-item measure
(Cronbach‟s α = 0.90) was based on the work of Kopelman, Brief, and Guzzo (1990) and
Dong et al. (2008), and included the sub-measures of Mean Emphasis, Goal Emphasis,
Task Support, and Reward Emphasis. Items were assessed in a five-point Likert scale
ranging from 1 (Strongly Disagree) to 5 (Strongly Agree). Higher scores were indicative
of higher levels of implementation climate.
 Mean emphasis: These three items (14a, 14b, 14c) focused on the extent to
which employees are made aware of methods and procedures. An example
item was “Employees were told about the changes in the work procedures due
to the implementation of the system.”
 Goal emphasis: These three items (14d, 14e, 14f) focused on goal emphasis,
which is the extent to which employees are made aware of outcomes and
standards. An example was “Employees were told the types of outcomes that
they needed to accomplish in using the system.”
 Task support: These six items (14g, 14h, 14i, 14j, 14k, 14l) focused on how
much employees felt they were being supported and supplied with necessary
resources to do their jobs, including equipment, services, and training. An
34
example item was: “Employees were given sufficient time to learn the new
system before they had to use it.”
 Reward emphasis: These five items (14m, 14n, 14o, 14p, 14q) sought to
understand employees‟ perceptions on the connection between job
performance and organizational rewards. An example item was: “Employees
were told the potential risk if they did not use the new system.”
A factor analysis with Varimax rotation converged in six iterations and yielded
four factors with an eigenvalue greater than 1.00 that explained 74.3% of the variance
(Cronbach‟s α = 0.91). Attempting to categorize the components, the researcher
discovered that the yielded groupings were inconsistent and ambiguous and some items
were loading on multiple components. These items (items g, l, and m) were removed.
From here a second factor analysis was run using Varimax rotation, which converged in
five iterations and explained 72.63% of the variance. Although the reliability was slightly
lower (Cronbach‟s α = 0.89), there was much more clarity to these categorizations. The
researcher identified these categories as employee awareness (items 14a, 14b, 14c, 14d,
14e, 14f), which assessed the degree to which employees are aware of the methods,
procedures, and expectations when using the system (six items; Cronbach‟s α = 0.93).
The next component that emerged focused on external rewards (14n, 14o, 14p, 14q),
which looked at employees‟ perception of the evaluation of their performance and
recognition of effort (four items; Cronbach‟s α = 0.89). Finally, there was a component
featuring training and support (items 14h, 14i, 14j, 14k), which spoke of the resources
available to employees in order to further their knowledge and skill in operating the EMR
35
(four items; Cronbach‟s α = 0.80). A complete set of factor analyses are found in
Appendix G.
Innovation-Values Fit assessed “the extent to which targeted users perceive that
the use of the innovation will foster (or conversely, inhibit) the fulfillment of their
values” (Klein & Sorra, 1996, p. 1063). This measure contained 13 items (Cronbach‟s α
= 0.92), which were divided into the following three sub-dimensions: Quality,
Locatibility, and Flexibility and Coordination. Dong et al. (2008) developed this 13-item
construct based on research by Goodhue and Thompson (1995), and Valle, Martin,
Romero, and Dolan (2000). The sub-measures are explained as follows:
 Quality: This sub-measure contained six items and assessed the extent to which
information was current, up to date, and useful.
 Locatibility: This four-item sub-measure assessed how easy it was to locate the
desired information. Some wording was modified in this item to better suit the
context of family practice clinics.
 Flexibility and Coordination: This final sub-measure consisted of three items and
assessed the extent that the system enhanced the work process. This researcher
changed the wording from “departments” to “departments or working groups” to
make it more appropriate for family practice clinics.
A factor analysis with Varimax rotation produced two components with an
eigenvalue greater than 1.00 that explained 62.4% of the variance. The rotation
converged in three iterations, Cronbach‟s α = 0.92. The researcher attempted to group
components in a more distinct way by forcing number of components to be in line with
the literature (i.e., three components). However, the explanation of variance did not
36
improve, and some components continued to load onto multiple components. Refer to
Appendix G for detailed factor analysis matrix.
The six item Skills measure (Cronbach‟s α = 0.90), was developed by Dong et al.
(2008). These authors partially based this item on training material from an enterprise
system vendor, and sought to discover if a user had a higher-order understanding of the
EMR, and how some parts of the EMR system linked with other parts of the system. An
example item was, “I am very knowledgeable about how the system works.” A factor
analysis produced one component (Cronbach‟s α = 0.84) with an eigenvalue greater than
1.00 that explained 56.25% of the variance. As only one component was extracted, the
solution could not be rotated. An example of the factor analysis for this item is shown in
Table 3. A complete set of factor analyses are provided in Appendix G.
Table 3
Factor Analysis for Skills
Items: Skills Component
16d. I know how data in my work group links to data in other work
groups.
0.83
16e. I know which work groups receive the information I input into the
system.
0.77
16b. I understand all of the special features of the system. 0.76
16a. I am very knowledgeable about how the system works. 0.75
16f. I can interpret the data shown in the system without problems. 0.73
16c. I can enter into the system whenever I need to. 0.65
Note. Extraction Method: Principal Component Analysis; 1 component extracted;
Cronbach‟s α = 0.84; Eigenvalue = 3.38; % Variance = 56.25%.
The three-item Absence of Obstacles scale (Cronbach‟s α = 0.83) was created by
Dong et al. (2008). This scale was based on Klein and Sorra‟s (1996) definition to assess
if the use of a computerized system was being supported or blocked. All items were
37
reverse-scored as stated in the literature (e.g., “Due to the lack of technical support, I
have found the system difficult to use”). A factor analysis produced one component with
an eigenvalue greater than 1.00 that explained 75.05% of the variance. Again, because
only one component was extracted, the solution could not be rotated (α = 0.83).
The two item Incentives scale (Cronbach‟s α = 0.78) was created by Dong et al.
(2008), and was based on the work Klein and Sorra (1996). This measure determined if
employees were discouraged or motivated to use the EMR system. An example items
was, “I am motivated to use the system.” A factor analysis produced one component (α =
0.70), with an eigenvalue greater than 1.00 that explained 78.64% of the variance. Again,
because only one component was extracted, the solution could not be rotated.
The four item Commitment scale (Cronbach‟s α = 0.84) was created by Dong et
al. (2008) by adapting the measure of Meyer and Allen (1991). This item sought to
understand if employees had begun to attach personal meaning to the EMR system, and if
they enjoyed mastering it and discussing it with other colleagues. An example item was,
“Using the system is personally meaningful to me.” A factor analysis produced one
component (Cronbach‟s α = 0.84), with an eigenvalue greater than 1.00 that explained
68.00% of the variance. Again, because only one component was extracted, the solution
could not be rotated.
The five item Implementation Effectiveness scale was created by Dong et al.
(2008) by adapting Klein et al. (2001). This measure explored if employees would choose
to use the system given the opportunity, and if they felt it was a valuable addition to the
work practices of the organization. Klein et al. (2001) originally developed three sub-
measures for this scale as avoidance, endorsement, and quality of use. The corresponding
38
Cronbach‟s α were 0.68, 0.85, and 0.75, respectively, and 0.89 for the measure as a
whole. However, in Dong et al.‟s (2008) work there was no division into sub-measures.
This researcher slightly modified the wording of one item to make it more relevant to
family practice clinics - the word “plant” was replaced with “clinic.” All five items in this
scale were reverse-scored as shown in the literature. An example item was, “If I had my
way, this clinic would go back to the old way and forget the system.” A factor analysis
produced one component measure (α = 0.88) with an eigenvalue greater than 1.00 that
explained 70.47% of the variance. Again, because only one component was extracted, the
solution could not be rotated.
Meaningful EMR use. There were 30 items with 10 dimensions that assessed
EMR usage from a scale adapted from Price et al. (2011). The researcher modified some
items to make them less wordy and to remove any reference to programs and tools used
exclusively in the province of British Columbia, where the scale was created. The
responses were placed on a continuum from 0 (zero) to 5, with zero representing minimal
use and 5 representing high-stage and meaningful use. The original scale (eHealth
Observatory, 2011) has 10 items in which there are blanks within the 0 - 5 range.
According to the principal author, Morgan Price, “The gaps are intentional - we were not
able to find realistic examples of that feature at that level” (M. Price, personal
communication, November 13, 2012). This researcher adapted nine of these items to have
full-scale range, leaving only one item without a fifth-range option. Up until Price et al.‟s
study, no validations had been performed on this scale and no assessments done beyond
simple reporting (M. Price, personal communication, November 13, 2012), there were no
established Cronbach‟s α values to report. Since this scale was not yet tested, this
39
researcher attempted to gain some content validity by consulting with those professionals
working in physician offices to ensure that the tool appeared to measure what it set out to
measure, and that the levels of use were realistic. Determining the reliabilities for the
items and offering some initial quantitative content validity is a contribution to the
literature made through this study by this author. The Cronbach‟s α for the full 30-item
measure was α = 0.88. The 10 dimensions of the measure were as follows:
 Health Information: (three items; 21–23)
 Medications (four items; 24–27)
 Laboratory (two items; 28–29)
 Medical Imaging: (three items; 30–32)
 Referrals: (three items; 33–35)
 Decision Support: (four items; 36–39)
 Electronic Communication and Connectivity (three items, 40–42)
 Patient Support: (two items; 43–44)
 Administrative Processes: (four items; 45–48)
 Reporting and Population Health Management (two items; 49–50)
The three item Health Information measure was originally created by Price et al.
(2011) to assess the level at which general patient information was being kept in the
clinic. An example was “Where do you keep a patient‟s medical summary?” Response 0
(zero) read “I maintain a separate face sheet in the paper chart that I manually update.” A
response of 5 indicated, “as described above, (I use my EMR, which stores all my patient
information in a structured form, e.g., Coded problem lists, drop-downs, pick lists, etc.),
but the EMR also syncs summary data with a provincial electronic health record.” A
40
factor analysis produced one component (α = 0.45) with an eigenvalue greater than 1.00
that explained 52.78% of the variance. As only one component was extracted, the
solution could not be rotated. These numbers indicate that this is only a moderately
reliable measure.
The four item Medications measure was originally created by Price et al. (2011)
to assess the level at which medication information was being created and supported in
the clinic. An example item was “How do you write new drug prescriptions?” A response
of 0 (zero) stated “I write them on my RX pad and record them in the patient‟s paper
chart,” whereas a response of 5 was “I write them for all patients using my EMR which
has an advanced RX module and is linked to a province wide ePrescription system that is
linked to pharmacies.” A factor analysis produced one component Cronbach‟s α = 0.64
with an eigenvalue greater than 1.00 that explained 52.86% of the variance. Since only
one component was extracted, the solution could not be rotated.
The two item Laboratory measure was originally created by Price et al. (2011) to
assess the processes for ordering and receiving lab tests in the clinic. An example was,
“How do you receive, review, and process lab results?” A response of 0 (zero) stated,
“Lab reports of tests I ordered (or were copied to me) are received in paper form by mail
and/or fax and filed in the paper chart.” However, a response of 5 corresponded to “All
lab results I ordered (or were copied to me) are downloaded into my EMR, which also
has a viewer to integrate and display all available lab data on a patient from multiple lab
databases and hospitals.” A factor analysis produced one component (Cronbach‟s α =
0.52) with an eigenvalue greater than 1.00 that explained 68.95% of the variance. As only
41
one component was extracted, the solution could not be rotated. These numbers indicate
that this is only a moderately reliable measure.
The three item Medical Imaging measure was originally created by Price et al.
(2011) to assess the processes for ordering and receiving medical imaging tests in the
clinic. An example item was: “How do you order diagnostic tests?” (i.e., X-rays, U/S,
MRI, PFT, stress tests, etc.). A response of 0 (zero) read, “I complete a paper requisition
specific to each diagnostic center,” whereas a response of 5 stated “I use an advanced
diagnostic test requisition manager in my EMR that is securely linked to diagnostic test
sites so that I can order, record and reconcile tests electronically. No paper requisitions
are generated.” A factor analysis produced one component (Cronbach‟s α = 0.22) with an
eigenvalue greater than 1.00 that explained 39.14% of the variance. These low numbers
indicate that this is not a reliable measure.
The three item Referrals measure was originally created by Price et al. (2011) to
assess the processes for ordering, receiving, and managing referrals in the clinic. An
example was, “How do you make a referral?” A score of 0 (zero) stated, “I hand write the
referral letter. My MOA arranges the appointment.” A score of 5 claimed, “I use my
EMR‟s referral manager, which is linked on a secure network with consultants located in
private offices and/or hospitals. The consultant can view referral data when an electronic
request is sent. Referral appointments can be made online within the network.” A factor
analysis with Varimax rotation produced two components (Cronbach‟s α = 0.09) with an
eigenvalue greater than 1.00 that explained 70.08% of the variance. This extremely low
Cronbach‟s of 0.09 indicated that this was not a reliable measure, likely due to the large
number of excluded responses (54%) in this item. The first component was identified by
42
the researcher as referral management, and included items 34 and 35. The second
component was identified as referral requests, and consisted of only item 33.
The four item Decision Support measure was originally created by Price et al.
(2011) to assess the extensiveness of the use of decision supports for patient care in
several areas of clinical practice. One example was, “How are patient reminders (for
follow-up and prevention) generated in your office?” A score of 0 (zero) corresponded to,
“Manually: when I see a patient I record a follow-up in the patient‟s chart or I rely on my
memory.” A score of 5 stated, “I use an EMR with a rule-based reminder system that also
leverages information on provincial and other external repositories to adjust rules
(e.g., will confirm if patients have had immunizations from public health).” A factor
analysis with Varimax rotation produced two components (Cronbach‟s α = 0.59) with
eigenvalue greater than 1.00 that explained 72.44% of the variance. There were 64.0% of
responses excluded. The first component was identified by the researcher as reminder
systems, and included items 38 and 39, Cronbach‟s α = 0.68. The second component was
identified as reference materials, and included items 36–37 (Cronbach‟s α = 0.24). These
numbers indicated that both the total measure, as well as the reminder systems
component, were moderately reliable measures. However, the second component,
reference materials, was not a very reliable measure.
The three items Electronic Communication and Connectivity measure were
originally created by Price et al. (2011) to measure the integrity and accessibility of
patient records both within and from outside the clinic. An example was, “How do you
access your records while you are out of the office?” A score of 0 (zero) stated, “I cannot
access information in my records while I am out of the office.” A score of 5 indicated,
43
“As described above (I regularly access my EMR through a secure connection, e.g., by
Remote Desktop, Citrix, or a secure website, but I can also access my EMR from the
hospital.” A factor analysis produced one component with an eigenvalue greater than
1.00 that explained 49.89% of the variance with Cronbach‟s α = 0.48. These numbers
indicated that this was only a moderately reliable measure.
The two item Patient Support measure was originally created by Price et al.
(2011), and measured the level of support provided to patients through the use of
different means of health information (e.g., information handouts). An example was,
“How do you share the patient‟s own information with them?” A score of 0 (zero)
indicated, “I do not provide patients copies of results.” A score of 5 corresponded to,
“Our EMR can send data to our patients‟ Personally Controlled Health Record. This is
used by at least 10% of patients in the practice.” A factor analysis produced one
component (Cronbach‟s α = 0.29) with an eigenvalue greater than 1.00 that explained
59.14% of the variance. As only one component was extracted, the solution could not be
rotated. These low numbers indicated that this was not a very reliable measure.
The four item Administrative Processes measure originally created by Price et al.
(2011) looked at the level of efficiency of administrative processes in the clinic. An
example was, “How do you bill in the practice?” A score of 0 (zero) read, “I write my
billings on paper and send them to a billing service OR I submit on paper.” A score of 5
stated, “I use my EMR and it auto-populates the billing codes based on my notes in the
patient chart. These can be edited and managed within the EMR.” A factor analysis
produced one component (Cronbach‟s α = 0.58) with an eigenvalue greater than 1.00 that
44
explained 46.19% of the variance. These low numbers indicated that this was only a
moderately reliable measure.
The two item Reporting and Population Health Management measure, originally
created by Price et al. (2011), looked at the extent to which the clinic is capable of
running customized reports and managing disease registries. An example item was, “How
do you run reports or create recall lists in your practice?” A score of 0 (zero) said, “We
do not. OR We have paper lists and calendars where we put recalls for mammograms etc.
OR we rely on the provincial programs for recalls.” A score of 5 claimed, “As described
above (we have complex reports in our EMR that we use e.g., diabetics with A1C over
8% who haven‟t been seen in three months, and we create our own reports), but the report
queries also include additional data from regional/provincial systems in some way.” A
factor analysis produced one component (Cronbach‟s α = 0.74) with an eigenvalue
greater than 1.00 that explained 79.45% of the variance. As only one component was
extracted, the solution could not be rotated. These numbers indicated that this was a
reliable measure.
Up until this time, the Meaningful EMR Use scale had not yet been established in
the literature. This research study was the first to report reliability and variance statistics
for each measure. Many of these tests showed low reliability (see Table 4), and this
researcher recommends that further development to be done to improve the measure.
45
Table 4
Reliability and Variance for the measure of Meaningful EMR Use
Sub-Measures of Meaningful EMR Use
Cronbach‟s
α
Component
s Extracted
%
Variance
Explained
Reporting and Population Health
Management
0.74 1 79.45%
Medications 0.64 1 52.86%
Decision Support 0.59 2 72.44%
- Reminder Systems 0.68 - 45.62%
- Reference Materials 0.24 - 26.83%
Administrative Process 0.58 1 46.19%
Laboratory 0.53 1 68.95%
Electronic Communication and
Connectivity
0.48 1 49.89%
Health Information 0.45 1 52.78%
Patient Support 0.29 1 59.14%
Medical Imaging 0.22 1 39.14%
Referrals 0.09 2 73.64%
- Referral Management 0.08 - 40.01%
- Referral Request - - 33.63%
Note. EMR = Electronic Medical Record; Overall α = 0.88.
Demographics questions: About you. There were five questions in the personal
demographics section that assessed role or position in the clinic, tenure or length of time
working at the clinic, age, and gender. These questions provided some context to the
responses and allowed comparisons to be made within the data.
Demographics questions: About your clinic. There were eight questions in the
clinic demographics section that assessed different aspects of the clinic environment. A
few examples were “In which zone is your clinic located,” “Which EMR does your clinic
use,” and “Is your clinic part of a Primary Care Network?” These questions allowed
potential correlations to be drawn between health care zones, between EMR systems, and
Meaningful EMR Use - A Survey of Family Practice Clinics - TAGG_BEKKI_MSC_2015

Más contenido relacionado

Destacado

Tech. initiatives
Tech. initiativesTech. initiatives
Tech. initiativesmarkjerez
 
Referat la fizica 1
Referat la fizica 1Referat la fizica 1
Referat la fizica 1Daniel Tudor
 
Top 8 contracting officer resume samples
Top 8 contracting officer resume samplesTop 8 contracting officer resume samples
Top 8 contracting officer resume samplestonychoper2805
 
Top 8 loans officer resume samples
Top 8 loans officer resume samplesTop 8 loans officer resume samples
Top 8 loans officer resume samplestonychoper2805
 
Top 8 regulatory compliance officer resume samples
Top 8 regulatory compliance officer resume samplesTop 8 regulatory compliance officer resume samples
Top 8 regulatory compliance officer resume samplestonychoper2805
 
UrSchool Project
UrSchool ProjectUrSchool Project
UrSchool ProjectVadim1998
 
Powers and Problems of Integrating Social Media Data with Public Health and S...
Powers and Problems of Integrating Social Media Data with Public Health and S...Powers and Problems of Integrating Social Media Data with Public Health and S...
Powers and Problems of Integrating Social Media Data with Public Health and S...Cody Buntain
 
Gary's Professional Resume - 20141101
Gary's Professional Resume - 20141101Gary's Professional Resume - 20141101
Gary's Professional Resume - 20141101Gary Green
 
chuyên làm phim quảng cáo tốt giá rẻ
chuyên làm phim quảng cáo tốt giá rẻchuyên làm phim quảng cáo tốt giá rẻ
chuyên làm phim quảng cáo tốt giá rẻhouston478
 
Management information
Management informationManagement information
Management informationAdeel Iftikhar
 
bảng giá làm phim quảng cáo chất lượng cao
bảng giá làm phim quảng cáo chất lượng caobảng giá làm phim quảng cáo chất lượng cao
bảng giá làm phim quảng cáo chất lượng caoalejandra385
 
01. Уводзіны
01. Уводзіны01. Уводзіны
01. УводзіныAnastasiyaF
 
Affordability analysis
Affordability analysisAffordability analysis
Affordability analysisPaul Adams
 

Destacado (18)

Tech. initiatives
Tech. initiativesTech. initiatives
Tech. initiatives
 
Referat la fizica 1
Referat la fizica 1Referat la fizica 1
Referat la fizica 1
 
Top 8 contracting officer resume samples
Top 8 contracting officer resume samplesTop 8 contracting officer resume samples
Top 8 contracting officer resume samples
 
Top 8 loans officer resume samples
Top 8 loans officer resume samplesTop 8 loans officer resume samples
Top 8 loans officer resume samples
 
Top 8 regulatory compliance officer resume samples
Top 8 regulatory compliance officer resume samplesTop 8 regulatory compliance officer resume samples
Top 8 regulatory compliance officer resume samples
 
Mohamed Fathy Kassem - Copy
Mohamed Fathy Kassem - CopyMohamed Fathy Kassem - Copy
Mohamed Fathy Kassem - Copy
 
Richella CV NEW
Richella CV NEWRichella CV NEW
Richella CV NEW
 
UrSchool Project
UrSchool ProjectUrSchool Project
UrSchool Project
 
Powers and Problems of Integrating Social Media Data with Public Health and S...
Powers and Problems of Integrating Social Media Data with Public Health and S...Powers and Problems of Integrating Social Media Data with Public Health and S...
Powers and Problems of Integrating Social Media Data with Public Health and S...
 
Zarządzanie kapitałem
Zarządzanie kapitałemZarządzanie kapitałem
Zarządzanie kapitałem
 
Gary's Professional Resume - 20141101
Gary's Professional Resume - 20141101Gary's Professional Resume - 20141101
Gary's Professional Resume - 20141101
 
chuyên làm phim quảng cáo tốt giá rẻ
chuyên làm phim quảng cáo tốt giá rẻchuyên làm phim quảng cáo tốt giá rẻ
chuyên làm phim quảng cáo tốt giá rẻ
 
Management information
Management informationManagement information
Management information
 
Dstu b v.2 7-37-95
Dstu b v.2 7-37-95Dstu b v.2 7-37-95
Dstu b v.2 7-37-95
 
La interfaz
La interfazLa interfaz
La interfaz
 
bảng giá làm phim quảng cáo chất lượng cao
bảng giá làm phim quảng cáo chất lượng caobảng giá làm phim quảng cáo chất lượng cao
bảng giá làm phim quảng cáo chất lượng cao
 
01. Уводзіны
01. Уводзіны01. Уводзіны
01. Уводзіны
 
Affordability analysis
Affordability analysisAffordability analysis
Affordability analysis
 

Similar a Meaningful EMR Use - A Survey of Family Practice Clinics - TAGG_BEKKI_MSC_2015

The Diffusion of Telehealth: System-Level Conditions for Successful Adoption ...
The Diffusion of Telehealth: System-Level Conditions for Successful Adoption ...The Diffusion of Telehealth: System-Level Conditions for Successful Adoption ...
The Diffusion of Telehealth: System-Level Conditions for Successful Adoption ...Danika Tynes, Ph.D.
 
Computational methods of Hepatitis B virus genotyping
Computational methods of Hepatitis B virus genotypingComputational methods of Hepatitis B virus genotyping
Computational methods of Hepatitis B virus genotypingNguyen Nhat Tien
 
Synopsis_V1_9-18-2023.docxddddddddddddddddddddddddddd
Synopsis_V1_9-18-2023.docxdddddddddddddddddddddddddddSynopsis_V1_9-18-2023.docxddddddddddddddddddddddddddd
Synopsis_V1_9-18-2023.docxdddddddddddddddddddddddddddsohailg3e6565
 
The Effect of Economic Inequality of Voter Turnout in Canadian Federal Electi...
The Effect of Economic Inequality of Voter Turnout in Canadian Federal Electi...The Effect of Economic Inequality of Voter Turnout in Canadian Federal Electi...
The Effect of Economic Inequality of Voter Turnout in Canadian Federal Electi...Kathryn Wesley
 
2015_05_12 Dissertation Binder_VTantsyura
2015_05_12 Dissertation Binder_VTantsyura2015_05_12 Dissertation Binder_VTantsyura
2015_05_12 Dissertation Binder_VTantsyuraVadim Tantsyura
 
Safety is Personal: Partnering with Patients and Families for the Safest Care
Safety is Personal: Partnering with Patients and Families for the Safest CareSafety is Personal: Partnering with Patients and Families for the Safest Care
Safety is Personal: Partnering with Patients and Families for the Safest CareEngagingPatients
 
StevenCurtis_Thesis_LivingLabsforSustainability
StevenCurtis_Thesis_LivingLabsforSustainabilityStevenCurtis_Thesis_LivingLabsforSustainability
StevenCurtis_Thesis_LivingLabsforSustainabilitySteven Curtis
 
PEOPLE ATTENDING 12-STEP PROGRAMS AND EXPERIENCES OF SPIRI.docx
PEOPLE ATTENDING 12-STEP PROGRAMS AND EXPERIENCES OF SPIRI.docxPEOPLE ATTENDING 12-STEP PROGRAMS AND EXPERIENCES OF SPIRI.docx
PEOPLE ATTENDING 12-STEP PROGRAMS AND EXPERIENCES OF SPIRI.docxkarlhennesey
 
Assessing the Impact of a Virtual Lab in an Allied Health Program.pdf
Assessing the Impact of a Virtual Lab in an Allied Health Program.pdfAssessing the Impact of a Virtual Lab in an Allied Health Program.pdf
Assessing the Impact of a Virtual Lab in an Allied Health Program.pdfElizabeth Williams
 
Factors associated with early discontinuation of contraceptive implants among...
Factors associated with early discontinuation of contraceptive implants among...Factors associated with early discontinuation of contraceptive implants among...
Factors associated with early discontinuation of contraceptive implants among...DDUNGU UMARU
 
Factors Associated with Early Discontinuation of Contraceptive Implants among...
Factors Associated with Early Discontinuation of Contraceptive Implants among...Factors Associated with Early Discontinuation of Contraceptive Implants among...
Factors Associated with Early Discontinuation of Contraceptive Implants among...DDUNGU UMARU
 

Similar a Meaningful EMR Use - A Survey of Family Practice Clinics - TAGG_BEKKI_MSC_2015 (20)

Jun dai blockchain
Jun dai blockchainJun dai blockchain
Jun dai blockchain
 
PhD_VanCoile
PhD_VanCoilePhD_VanCoile
PhD_VanCoile
 
The Diffusion of Telehealth: System-Level Conditions for Successful Adoption ...
The Diffusion of Telehealth: System-Level Conditions for Successful Adoption ...The Diffusion of Telehealth: System-Level Conditions for Successful Adoption ...
The Diffusion of Telehealth: System-Level Conditions for Successful Adoption ...
 
Avit final thesis doc
Avit final thesis docAvit final thesis doc
Avit final thesis doc
 
Computational methods of Hepatitis B virus genotyping
Computational methods of Hepatitis B virus genotypingComputational methods of Hepatitis B virus genotyping
Computational methods of Hepatitis B virus genotyping
 
BenyaHypertensionDissertation62615
BenyaHypertensionDissertation62615BenyaHypertensionDissertation62615
BenyaHypertensionDissertation62615
 
Synopsis_V1_9-18-2023.docxddddddddddddddddddddddddddd
Synopsis_V1_9-18-2023.docxdddddddddddddddddddddddddddSynopsis_V1_9-18-2023.docxddddddddddddddddddddddddddd
Synopsis_V1_9-18-2023.docxddddddddddddddddddddddddddd
 
AVIT FINAL THESIS
AVIT FINAL THESISAVIT FINAL THESIS
AVIT FINAL THESIS
 
Sanitation safety planning ssp manual
Sanitation safety planning ssp manualSanitation safety planning ssp manual
Sanitation safety planning ssp manual
 
Leininger_umd_0117N_16271
Leininger_umd_0117N_16271Leininger_umd_0117N_16271
Leininger_umd_0117N_16271
 
The Effect of Economic Inequality of Voter Turnout in Canadian Federal Electi...
The Effect of Economic Inequality of Voter Turnout in Canadian Federal Electi...The Effect of Economic Inequality of Voter Turnout in Canadian Federal Electi...
The Effect of Economic Inequality of Voter Turnout in Canadian Federal Electi...
 
2015_05_12 Dissertation Binder_VTantsyura
2015_05_12 Dissertation Binder_VTantsyura2015_05_12 Dissertation Binder_VTantsyura
2015_05_12 Dissertation Binder_VTantsyura
 
Research Project
Research ProjectResearch Project
Research Project
 
Ephrem Tibebu.pdf
Ephrem Tibebu.pdfEphrem Tibebu.pdf
Ephrem Tibebu.pdf
 
Safety is Personal: Partnering with Patients and Families for the Safest Care
Safety is Personal: Partnering with Patients and Families for the Safest CareSafety is Personal: Partnering with Patients and Families for the Safest Care
Safety is Personal: Partnering with Patients and Families for the Safest Care
 
StevenCurtis_Thesis_LivingLabsforSustainability
StevenCurtis_Thesis_LivingLabsforSustainabilityStevenCurtis_Thesis_LivingLabsforSustainability
StevenCurtis_Thesis_LivingLabsforSustainability
 
PEOPLE ATTENDING 12-STEP PROGRAMS AND EXPERIENCES OF SPIRI.docx
PEOPLE ATTENDING 12-STEP PROGRAMS AND EXPERIENCES OF SPIRI.docxPEOPLE ATTENDING 12-STEP PROGRAMS AND EXPERIENCES OF SPIRI.docx
PEOPLE ATTENDING 12-STEP PROGRAMS AND EXPERIENCES OF SPIRI.docx
 
Assessing the Impact of a Virtual Lab in an Allied Health Program.pdf
Assessing the Impact of a Virtual Lab in an Allied Health Program.pdfAssessing the Impact of a Virtual Lab in an Allied Health Program.pdf
Assessing the Impact of a Virtual Lab in an Allied Health Program.pdf
 
Factors associated with early discontinuation of contraceptive implants among...
Factors associated with early discontinuation of contraceptive implants among...Factors associated with early discontinuation of contraceptive implants among...
Factors associated with early discontinuation of contraceptive implants among...
 
Factors Associated with Early Discontinuation of Contraceptive Implants among...
Factors Associated with Early Discontinuation of Contraceptive Implants among...Factors Associated with Early Discontinuation of Contraceptive Implants among...
Factors Associated with Early Discontinuation of Contraceptive Implants among...
 

Meaningful EMR Use - A Survey of Family Practice Clinics - TAGG_BEKKI_MSC_2015

  • 1. MEANINGFUL ELECTRONIC MEDICAL RECORD USE: A SURVEY OF FAMILY PRACTICE CLINICS BEKKI LYNN TAGG BA, University of Lethbridge, 2000 BN, University of Lethbridge, 2008 A Thesis Submitted to the School of Graduate Studies of the University of Lethbridge in Partial Fulfillment of the Requirements for the Degree MASTER OF SCIENCE (HEALTH SCIENCES) Faculty of Health Sciences University of Lethbridge LETHBRIDGE, ALBERTA, CANADA © Bekki Lynn Tagg, 2015
  • 2. MEANINGFUL ELECTRONIC MEDICAL RECORD USE: A SURVEY OF FAMILY PRACTICE CLINICS BEKKI LYNN TAGG Date of Defence: April 8, 2015 Dr. C. Steinke Associate Ph.D. Supervisor Professor Dr. O. Awosoga Assistant Ph.D. Thesis Examination Committee Member Professor Dr. B. Williams Associate Ph.D. Thesis Examination Committee Member Professor Dr. C. Witcher Assistant Ph.D. Chair, Thesis Examination Committee Professor
  • 3. iii Dedication This thesis is dedicated to my life love, Bernardo Perez, and to my dear friends Valerie Moldowin, Nicole Hemsing, Krista Craik, and Christine Kennedy for carrying me through this long process. It is also dedicated to Dr. Rozemin Kizuk, who first gave me the opportunity to learn and explore the possibilities of how EMRs can transform a physician clinic. Finally, to my supervisor - Dr. Claudia Steinke, who never let me give up on myself.
  • 4. iv Abstract This thesis explores the factors related to increased meaningful use of Electronic Medical Records (EMRs) in family physician clinics in Alberta, Canada. Measurements were made using the Innovation Implementation scale (Klein & Sorra, 1996) and the Meaningful EMR Use scale, newly developed by Price, Lau, and Lai (2011). Demographics were collected for profession, age, gender, years of experience, and took into account the participation of the clinic in government improvement programs including Physician Office Systems Program (POSP) and primary care networks (PCNs). Implementation Climate was found to be the most important factor in predicting high levels of EMR use. Historically documented barriers to EMR implementation were neither as significant nor impactful as the literature suggested.
  • 5. v Acknowledgements I would like to thank Dr. Olu Awosoga for his vast statistical knowledge, and his endless patience in educating me throughout this project and Dr. Bernie Williams for his ongoing support, encouragement and feedback. Also, I would like to acknowledge my colleague Samuel Mantey Ofori Dei for freely offering his help whenever it was needed. Next, I say a thank you to Peter Kellet for his willingness to provide consultation in this work, and would also like to acknowledge the timely support of my editor, Shanaya Nelson. Finally, I give a heartfelt thank you to each and every participant who gave of their time to make this research possible. I am endlessly grateful for your support.
  • 6. vi Table of Contents Dedication.......................................................................................................................... iii Abstract.............................................................................................................................. iv Acknowledgements..............................................................................................................v Table of Contents............................................................................................................... vi List of Tables ..................................................................................................................... ix List of Figures......................................................................................................................x Chapter One: Introduction ...................................................................................................1 Background Information..........................................................................................2 Chapter Two: Review of the Literature ...............................................................................4 Benefits of EMR Use...............................................................................................4 Improved efficiency.....................................................................................4 Improved patient care and safety.................................................................5 Financial benefits.........................................................................................5 Support for future health care ......................................................................6 Barriers to EMR Use................................................................................................6 Financial concerns .......................................................................................6 Trust in technology ......................................................................................7 Perception of insufficient technology support .............................................7 Steep learning curve.....................................................................................8 Difficulty with EMR implementation..........................................................8 Comparing Benefits and Barriers.............................................................................9 Critical Success Factors .........................................................................................10 Business case .............................................................................................10 Physician support.......................................................................................10 Local champion..........................................................................................12 Planning phase ...........................................................................................12 Project management skills .........................................................................12 Process reengineering ................................................................................13 Meaningful EMR Use............................................................................................13 Measurement..............................................................................................14 Theoretical Framework..........................................................................................18 Innovation implementation model .............................................................18 Climate for implementation...........................................................18 Innovation-values fit ......................................................................20 Skills, incentives, absence of obstacles and commitment..............21 Implementation effectiveness ........................................................22 Strategic accuracy of innovation....................................................22 Innovation effectiveness ................................................................22 Chapter Three: Research Design .......................................................................................23 Research Objectives...............................................................................................23 Research Hypotheses .............................................................................................23 Research Design.....................................................................................................24 Phase I: pilot study.....................................................................................24 Phase II: Quantitative survey.....................................................................25 Setting ............................................................................................25
  • 7. vii Sample............................................................................................26 Data collection method ..................................................................26 Step 1: Recruit participants................................................27 Step 2: Secure participants and distribute memo to inform.................................................................................27 Step 3: Distribute letter of consent with customized survey link..........................................................................28 Step 4: Participants complete the survey ...........................29 Data collection experience.............................................................29 Challenges and limitations.................................................29 Strengths ............................................................................31 Instrument and measures................................................................31 Klein and Sorra‟s innovation implementation model ........32 Meaningful EMR use.........................................................38 Demographics questions: About you.................................45 Demographics questions: About your clinic......................45 Data analysis ..................................................................................46 Ethics..............................................................................................46 Chapter Four: Discussion of Results..................................................................................48 Demographics: Organizational Level of Analysis.................................................48 Demographics – Individual Level of Analysis ......................................................50 Descriptive Statistics..............................................................................................52 Innovation implementation model .............................................................53 Implementation climate .................................................................53 Innovation-values fit ......................................................................53 Skills ..............................................................................................54 Absence of obstacles......................................................................54 Incentives .......................................................................................55 Commitment ..................................................................................55 Implementation effectiveness ........................................................56 Meaningful EMR use.................................................................................56 Recoding for meaningful EMR use ...............................................56 Medication .....................................................................................58 Laboratory......................................................................................59 Medical imaging ............................................................................59 Referrals.........................................................................................60 Decision support ............................................................................60 Electronic communication and connectivity..................................61 Patient support ...............................................................................61 Administrative process...................................................................61 Reporting and population health management ..............................62 Summary of meaningful EMR use ................................................62 Analysis of Variance..............................................................................................63 POSP funding.............................................................................................63 Primary care network.................................................................................64 Health zone ................................................................................................64
  • 8. viii Profession...................................................................................................66 Age.............................................................................................................66 Gender........................................................................................................67 Correlations............................................................................................................67 Innovation implementation correlations ....................................................67 Meaningful EMR use correlations.............................................................70 Testing the Hypotheses..........................................................................................70 Hypothesis 1...............................................................................................70 Hypothesis 2...............................................................................................74 Hypothesis 3...............................................................................................78 Hypothesis 4...............................................................................................83 Financial concerns .........................................................................83 Trust in technology ........................................................................85 Perception of insufficient technology support ...............................86 Steep learning curve.......................................................................87 Difficulty with EMR implementation............................................89 Factor analysis ...............................................................................90 Chapter Five: Conclusion, Recommendations and Limitations ........................................93 Demographics ........................................................................................................93 Relationships Among the Measures.......................................................................94 Impact of Barriers ..................................................................................................95 Other Findings .......................................................................................................96 Conclusion .............................................................................................................97 Contributions and implications for practice...............................................97 Limitations of the research.........................................................................98 Directions for future research ....................................................................99 References........................................................................................................................101 Appendices.......................................................................................................................106 A: Complete Survey for Meaningful Electronic Medical Record Use................107 B: Letter of Informed Consent.............................................................................125 C: Alberta Health Services Zone Map.................................................................127 D: Call for Participants ........................................................................................128 E: Description of Research Study........................................................................129 F: Demographics Tables ......................................................................................131 G: Innovation Implementation Model .................................................................135 H: Meaningful Electronic Medical Record Use...................................................151
  • 9. ix List of Tables Table 1 eHealth Observatory‟s Meaningful EMR Use Stages ......................................... 16 Table 2 Innovation Implementation Items........................................................................ 32 Table 3 Factor Analysis for Skills .................................................................................... 36 Table 4 Reliability and Variance for the measure of Meaningful EMR Use.................... 45 Table 5 Most Common EMR by Health Zone.................................................................. 48 Table 6 Most Common EMR Programs by Respondent and Clinic................................. 49 Table 7 Summary of Demographic Information............................................................... 51 Table 8 Descriptive Statistics and Frequencies for Commitment..................................... 55 Table 9 Recoded Responses for Meaningful EMR Use Scale.......................................... 57 Table 10 Descriptive Statistics and Frequencies for “Medications” Item ........................ 58 Table 11 Descriptive Statistics for Meaningful EMR Use Categories (Sub-Measures)... 63 Table 12 Analysis of Variance for Health Zones – Innovation Implementation and Meaningful EMR Use........................................................................................ 65 Table 13 Comparison of Means Between Health Zones Used in ANOVA...................... 65 Table 14 Correlations for Innovation Implementation Model Measures.......................... 68 Table 15 Correlation for Implementation Effectiveness and measures for motivation.... 68 Table 16 Correlations Between Meaningful EMR Use Sub-Measures ............................ 69 Table 17 Correlations for Hypothesis 1............................................................................ 71 Table 18 Correlations for Meaningful EMR Use and Implementation Climate Sub- Measures ............................................................................................................ 71 Table 19 Correlations for Implementation Climate and Meaningful EMR Use Sub- Measures ............................................................................................................ 72 Table 20 Correlation Between Implementation Climate Sub-Measures and Meaningful EMR Use Sub-Measures.................................................................................... 73 Table 21 Correlations for Hypothesis 2............................................................................ 75 Table 22 Correlations for Meaningful EMR Use and Innovation Values Fit Sub-Measures ............................................................................................................................ 75 Table 23 Correlations Between Innovation Values Fit and Meaningful EMR Use Sub- Measures ............................................................................................................ 76 Table 24 Correlations Between Sub-Measures of Innovation Values Fit and Sub- Measures of Meaningful EMR Use ................................................................... 77 Table 25 Correlations Between Meaningful EMR Use, Implementation Climate and Commitment ...................................................................................................... 78 Table 26 Number of Respondents Working in POSP-Funded Clinics............................. 84 Table 27 Items Correlated to Financial Concerns............................................................. 85 Table 28 Items Correlated to Trust in Technology........................................................... 86 Table 29 Items Related to Perception of Insufficient Technology Support...................... 87 Table 30 Items Related to Steep Learning Curve ............................................................. 88 Table 31 Difficulty with EMR Implementation................................................................ 89 Table 32 Factor Loadings for Hypothesis 4 Items............................................................ 90
  • 10. x List of Figures Figure 1. Differences in EMR adoption assessments of one case study clinic at two and eight months post EMR adoption measuring several aspects of EMR functioning........................................................................................................ 17 Figure 2. Klein and Sorra‟s Model: Determinants and Consequences of Implementation Effectiveness. ......................................................................... 21 Figure 3. Model 1 with Commitment as a moderator – diagram...................................... 80 Figure 4. Model 1 data output with commitment as a moderator – measurements.......... 80 Figure 5. Model 4 with a Commitment as a mediator – diagram ..................................... 81 Figure 6. Model 4 data output with Commitment as a mediator – measurements ........... 82
  • 11. 1 Chapter One: Introduction This purpose of this research was to assess the level of meaningful electronic medical record (EMR) usage of several family practice clinics throughout the province of Alberta. The researcher chose to explore this area of study due to her professional experience working in a family practice clinic and her efforts to increase the level of meaningful EMR use within the clinic. In addition, the researcher was motivated by the fact that Canada historically lags when it comes to EMR adoption, reporting 27.7% adoption rates (Canadian Medical Association, 2010) in comparison to those in the 90% range in other parts of the world (Jha, Doolan, Grandt, Scott, & Bates, 2008). Even when an EMR system has been implemented, it does not necessarily mean that it is being used in a meaningful, thorough, or high-level way (i.e., to its full capacity). There were three key reasons why this was an important area to research: First, the current literature was limited and there were very few existing studies examining meaningful EMR use in family practice clinics. Second, this was an important safety issue to the general public. For example, if a family physician owned an EMR that had the capability to protect a patient from a serious medication interaction, there would be an expectation that the technology would be used. Unfortunately, that was often not the case. Last, in the Province of Alberta, taxpayer money had gone to support the adoption and use of EMRs through a program called the Physician Office Systems Program (POSP). Between 2001 and 2014, POSP provided funding, information technology services and change management services to help physicians automate their practices. With so many resources being allocated to this adoption process, this researcher feels there should also be accompanying efforts (and evaluation of efforts) to ensure high levels of meaningful
  • 12. 2 EMR usage. The research applied a quantitative study to explore current levels and contributing factors to having high levels of meaningful EMR usage within family practice clinic in the Province of Alberta, Canada. Background Information The first conceptualization of a computerized medical record was in the 1960s by an American physician named Lawrence L. Weed; his goal was to improve patient care by automating and enhancing accessibility to their information (Pinkerton, 2006). This work went on to form the PROMIS project at the University of Vermont, where they aspired to develop the first EMR. The Mayo clinic also began emerging with ideas during this time. More and more companies and academic institutions developed systems in the coming decades, including Harvard‟s COSTAR system, the Technicon system, the HELP, system, the Duke‟s „The Medical Record‟, and the Regenstrief record in Indiana (Pinkerton, 2006). Although the concept for an EMR originated in North America, Canada and the United States have remained the two countries with the lowest clinical EMR usage at 20– 28% (Jha et al., 2008). In fact, according to MacKinnon and Wasserman (2009), the health care industry was “decades behind other industries with respect to information technology (IT) adoption and utilization” (p. 50). It has been only recently, however, that incentives like POSP have been offered to physicians in order to entice EMR adoption. In contrast, countries such as in Australia, Germany, Netherlands, New Zealand and the United Kingdom, have reached EMR adoption levels of over 90% (Jha et al., 2008). In New Zealand, the adoption tactics have been much more strategic than those in North America. The New Zealand government started a three-stage plan in 1992 that ended 17
  • 13. 3 years later with 100% EMR adoption rate, 75% claiming to utilize functionality in a meaningful way (Jha et al., 2008). This was accomplished mainly through the development of a national health identifier database, privacy and information-sharing agreements, one-time grants to physicians to purchase hardware, and mandatory electronic billing. As of 2009, there was one privately owned company, HealthLink, which was the sole provider for all electronic health care services (Protti, Dip, & Johansen, 2008a, 2008b).
  • 14. 4 Chapter Two: Review of the Literature Benefits of EMR Use The benefits of EMR usage are plentiful. Some are as rudimentary as the benefits of a computer. Others are broader and look to improve the health care system at large. These benefits include improved efficiency and patient care, financial benefits, and support for future health care. Improved efficiency. One way of showing the administrative benefits of EMR use is to shed light on the drawbacks of paper charts: inconsistent abbreviations, illegible handwriting, and difficulty in searching for specific information in a timely manner. In contrast, with an EMR, information is available and legible to all. Multiple people can access a chart simultaneously. Forms and requisitions can be set up to pull demographics and other data from the chart instantaneously. This eliminates the need for duplicate data entry, and sifting through several sheets in a paper chart. Referral letters and billing can be done at the time of the appointment, instead of being done after hours or in between patients. The cost of paper goes down as forms and referrals can be e-faxed. Templates can be created to reduce the number of steps to chart and bill for common procedures or visit types (Eichenwald Maki & Petterson, 2008; Gartee, 2007; Lai, Lau, & Shaw, 2009; Miller & Sim, 2004). The availability of EMR-integrated messaging systems also improves timeliness and accuracy of inter-office communication, and can take the place of post-it notes around the office. Tasks are easily transferred from one clinic employee to another, thereby reducing “dropped balls” (Miller & Sim, 2004, p. 119).
  • 15. 5 Improved patient care and safety. The usage of EMRs supports clinical decision-making, improves coordination and quality of care, and increases patient safety (Gartee, 2007). The existence of built-in medical libraries improves the physician‟s ability to access these resources within the EMR, reducing the need to go to an external source. Clinical decision supports such as allergy alerts, drug incompatibilities, and prompts to follow protocols reduce errors and improve patient safety. This increased safety impacts not only the patient, but the health care system at large. The use of EMRs also provides a landscape conducive to the proactive management of all patients, especially those with chronic diseases like diabetes, hypertension and heart failure. Proactive management includes screening reminders and vaccination recommendations, while tracking test-order status and improving coordination of care across providers (Eichenwald Maki & Petterson, 2008; Fraser et al., 2005; Gartee, 2007, 2011; Lai et al., 2009; Miller & Sim, 2004). Financial benefits. Improved efficiency provides indirect financial benefits of running a more efficient office. However, there are more direct financial benefits from EMRs that serve both the health care system and the physician. An EMR is able to improve efficiency of care for patients by reducing duplicate testing. This ability is especially important to taxpayers in the Canadian health care system, in which every test is covered by public funds. For the most part, Canadian physicians use fee-for service as their funding model. This means that for each type of visit and service that a physician provides, there is a specific fee code attached. The physician reports the visit type and service that they provide, bill for the service, and receive payment from the provincial college of physicians and surgeons. The 2010 National Physician Survey reported that for
  • 16. 6 those physicians reporting a primary remuneration method, 41.9% used fee-for-service. Of the 32.3% reporting a blended method, 46.36% of that blend was fee-for service (Canadian Medical Association, 2010). With the integration of EMR and electronic billing services, there is an improved process of data capture within the clinic visit that can ensure that the physician bills for all of the services provided (Miller & Sim, 2004). Support for future health care. An EMR helps those who provide health care to think past the present moment, and plan for the future. When data are entered, it is entered in such a way that is retrievable in a meaningful way down the road. Diagnoses, medications, laboratory results, and many other bits of information are recorded as discrete pieces of data in an organized database. This opens the door for clinical practice reporting, program reporting, and research in a way that would be extremely cumbersome to the point of being nearly impossible with paper charts (Lai et al., 2009). It also paves the way for the possibility of interoperable health information systems. At this point in the computer age, our health information should transfer from one end of the country to the other with the ease and security. Barriers to EMR Use There are several reasons why Canada lags behind in EMR implementation. The literature shows barriers including financial concerns, trust in technology, perception of insufficient IT support, steep learning curve, complex technology, and difficulty with EMR implementation. Financial concerns. Cost has been one of the first issues identified by physicians as the most common reason for not adopting in the early days of EMRs in the late 1990s and early 2000s (Valdes, Kibbe, Tolleson, Kunik, & Petersen, 2004). These costs
  • 17. 7 involved four main categories. The first was initial start-up costs, including all hardware as well as the loss of productivity during the changeover period. The second was staff training and EMR customization costs. The third category was ongoing costs to maintain the system, including monthly fees to the vendor. The final category was the matter of return on investment. This potential barrier continues to be a particularly troublesome one, as the family practice clinics see the direct impact of the outgoing costs, but it is the healthcare system that reaps the rewards of proactive care. The return on investment is therefore seemingly intangible and uncertain for family physicians (Boonstra & Broekhuis, 2010). Trust in technology. Unfortunately, in the early years, some issues arose relating to EMR vendor reliability. Schmitt and Wofford (2002) declared there has been volatility in the health care IT industry, and that it is only recently that EMR vendors have started to fulfill what they have been promising. In a study of computer-naïve primary care centres in Greece in 2007, frequent system “breakdowns” were reported (Samoutis et al., 2007). A review of the literature by Boonstra and Broekhuis (2010) revealed that there was much evidence to support the notion that physicians were concerned about the stability, safety, and access to their patients‟ data in the event of viruses, computer crashes, or power outages. However, Dawes and Chan (2010) insisted that EMRs were a safe way to collect and store patient data. Their review of the literature found no reported incidences of “catastrophic data loss” (Dawes & Chan, 2010, p. 16). Perception of insufficient technology support. Simon et al. (2007) found that two thirds of physicians identified a lack of technical support as a major barrier to their clinics adopting EMR systems. The literature showed that physicians feel like the IT
  • 18. 8 support is inadequate, and that there was slow turn-around time by vendors for solving technical issues once an EMR had been implemented (Boonstra & Broekhuis, 2010; Ludwick & Doucette, 2009b; Samoutis et al., 2007). Steep learning curve. As EMR systems are attempting to simulate the complex problem solving that occurs in a physician‟s mind during a patient encounter, they are likewise, complex. To some physicians and support staff with less familiarity with technology, the learning curve is very steep. This is seen as quite the burden to physicians (Boonstra & Broekhuis, 2010). In a study in Greece, physicians reported “poor usability” and “non-user friendly interface features” in the initial implementation phase, which surprised the researchers, because they had selected the EMR taking ease of navigation into account (Samoutis et al., 2007). The authors concluded that this finding was due to the lack of base level skill of some physicians and support staff, and that more attention to workflow development was needed. Difficulty with EMR implementation. The enormity of the project of implementing an EMR is the most daunting barrier of all. Implementing an EMR changes everything about the way the office runs. There are processes for how a patient is booked, how they are checked in, how they are processed at the time of their appointment, and how the appointment is conducted. Even after the patient is gone, there are workflows for completing billing. As Lyons and Klasko (2011b) attested, “The introduction of an EMR into the practice precipitates the need to re-think nearly every process in the office – even some processes that appear, upon first glance, to be unrelated to the task of recording medical information” (p. 38). The proper functioning and usability of the EMR tomorrow depends on the quality of the information entered in today.
  • 19. 9 Research has shown that EMR implementations are costly, time consuming, and failure rates are high. A recent case study in Canada following three hospitals as they implemented EMR solutions in a hospital setting saw a success rate of only 33% (Lapointe & Rivard, 2005). This means that of the three hospitals that attempted the implementation of an EMR system, two of them eventually announced the implementation a failure, stopped using the software entirely, and reverted back to their original workflows. This is a situation not unique to health care. Even in the management world, failure rates as high as 50% are reported for large-scale company-wide IT implementations that are business-world equivalents of EMRs (Bradley, 2009). Even if an implementation initially succeeds, there is still the phenomenon of Information System (IS) Avoidance, which Kane and Labianca (2011) defined as “an individual‟s preference to avoid working with an information system despite the need and opportunity to do so” (p. 505). As Kane and Labianca further described, there are a range of resistance behaviours that range from active (physical destruction or vandalism) to passive (lack of cooperation or apathy) that thwart the long-term success of an EMR implementation. Comparing Benefits and Barriers Many literary sources have documented numerous benefits that prove to offset the cost of the EMR, including reduction of clerical labour, transcription costs, order entry, documentation time, and storage and supply costs (Renner, 1996; Schmitt & Wofford, 2002). An EMR system also increases ease of access to and availability of patient information, standardization of documentation, and inter-staff communication. EMR use also allows for better data and patient panel analysis and reporting, including billing
  • 20. 10 maximization (Miller & Sim, 2004; Schmitt & Wofford, 2002). When discussing this issue, Walker (2005) concluded, “We have enough estimates. They suggest, as persuasively as such estimates can, that well-implemented EMRs have the potential to improve health care at an acceptable cost” (p. 1120). Critical Success Factors Since significant resources are invested into the adoption of EMRs, there has been much research into critical success factors investigating this topic. Individual factors found in the literature are a having a business case, physician support, an internal project champion, a planning phase, strong project management skills and process reengineering. Business case. Just like any other business venture, there must be a strategic and economic justification for implementing an EMR, as well as a way to measure the return on the investment (MacKinnon & Wasserman, 2009). Wang et al. (2003) statistically hypothesized one such business case using an actual patient panel from a primary care ambulatory setting in Massachusetts. Wang et al. used variations that included “light EMR users” (p. 400), “full EMR users” (p. 400), “most pessimistic assumptions” (p. 397), and “most favourable assumptions” (p. 399), and concluded that the potential net benefit over a 5-year period showed a range of $2,300–330,900 USD, with an average of $86,400 USD per provider. Their research suggested that there is a solid 5-year business case for every family practice clinic to adopt an EMR, even for the most minimal users, under the most modest of circumstances (Wang et al., 2003). Physician support. Technology implementation projects require the strong support of the physicians involved. This is, however, not an easy feat to accomplish. In a clinic, the physicians are in the unique position of having top management authority and
  • 21. 11 also being involved in the day-to-day use of the software. As Mishra, Anderson, Angst, and Agarwal (2012) described it, physicians have historically had unprecedented autonomy and independence when it came to conducting their work routines. With the introduction of EMRs, physicians can perceive this intrusion in one of two ways: they can see it as either reinforcing or a deteriorating their perceived care provider identity. Mishra et al. found that if the local community of physicians saw the adoption of an EMR as something positive that would reinforce the provider identity, then the EMR would be assimilated well into physician practice. Conversely, if the local community of physicians saw the adoption of an EMR as something that would deteriorate the perceived identity, the EMR assimilation would not go well. Another study regarding physician attitudes and EMR adoption used social network theory as its framework. The authors divided up health care personnel into three groups: physicians; paraprofessionals (nurses, physician assistants, technicians, and those who are in direct or indirect care-giving roles); and administrative personnel (Venkatesh, Zhang, & Sykes, 2011). They looked at in-group ties (e.g., physician to physician) and out-group ties (e.g., physician to paraprofessional) and studied the effect these ties had on EMR use. Venkatesh et al. (2011) found that with every profession except physicians, both in-group and out-group ties led to a positive effect on EMR use. However, with physicians, in-group ties led to a negative effect on EMR use, and out-group ties led to no effect on use. According to Venkatesh et al. (2011), only physicians who are on the social periphery of the network will be less influenced by their peers, and are more likely to explore the use of an EMR system.
  • 22. 12 Although a very complicated phenomenon, without the local physician support throughout the process of adoption and implementation, there is a great risk of the project failing (MacKinnon & Wasserman, 2009). Ultimately, it is up to the implementation team to negotiate the relationship with the physician throughout the implementation process in order to have a successful outcome. Local champion. Several pieces of literature identify the importance of a local project champion or “super-user” (Duperier, 2011, p. 29), who may or may not be a physician (Dawes & Chan, 2010; Duperier, 2011; Ludwick & Doucette, 2009a; MacKinnon & Wasserman, 2009). Gagnon et al. (2010) was more specific with the roles and characteristics this champion would ideally possess. They asserted that champions act as a bridge between the software developers and the clinical users. Champions participate in the design and decision making, ensuring that their “vision” is always kept as the goal. They lead and train the team, while providing technical support along the way. This point person can act as the direct liaison with the project manager, as the natural family practice office environment can have diffuse authority, leading to confusion of who to turn to for problem-solving (Lyons & Klasko, 2011a). Planning phase. A deliberate planning phase is often neglected in smaller non- management organizations, such as medical practices. This phase, however, is absolutely essential to ensure that the business case is translated into clear goals and objectives with concrete processes and timelines (MacKinnon & Wasserman, 2009). Project management skills. Project managers are as essential as champions in the transition process. They act as a liaison between the EMR vendor and the clinic, orchestrating the initial rollout procedure, and addressing post-implementation concerns.
  • 23. 13 Often, smaller healthcare organizations do not have personnel who possess project management skills, and so must fill this need by looking to independent contractors or vendor consultants (MacKinnon & Wasserman, 2009). Process reengineering. During an EMR implementation, there are massive changes in clinic workflow processes as well as business processes, including accounting and other reporting structures. It is critical that a point person carefully thinks about all of these processes, creates new workflows, and then implements proper training for all of the employees that will be using the new system (MacKinnon & Wasserman, 2009). Venkatesh et al. (2011) cited this as a roadblock seeing as it is typical of the health care system to inflict new software on its professionals with little or no training or process support. This causes delayed full adoption and delayed realization of benefits. Meaningful EMR Use The concept of “meaningful use” of an EMR originated from a report put out by the U.S. Department of Health and Human Services (2010). It outlined a program for financial compensation for EMR usage called the Health Information Technology for Economic and Clinical Health Act (2009). In order to access this staged funding, and to avoid penalties, physicians needed to meet three stages of meaningful use by 2015. Stage 1 criteria involved “electronically capturing health information in a structured format” (U.S. Department of Health and Human Services, 2010, p. 44321). Stage 2 criteria involved “expand[ing] upon stage 1 criteria to encourage the use of health IT for continuous quality improvement at the point of care and the exchange of information in the most structured format possible” (U. S. Department of Health and Human Services, 2010, p. 44321). Stage 3 criteria required the following:
  • 24. 14 Focus on promoting improvements in quality, safety, and efficiency leading to improved health outcomes, focusing on decision support for national high priority conditions, patient access to self-management tools, access to comprehensive patient data through robust, patient centered health information exchange and improving population health. (U. S. Department of Health and Human Services, 2010, p. 44322) Canada has also created a program to utilize funding geared towards enhancing EMR solutions, called Electronic Medical Records and Integration (Canada Health Infoway, 2014). This program used Clinical Value Levels to outline EMR capabilities. Clinical Value Level 1 includes using the EMR to “enter patient demographics; record encounters, problem lists, allergies, immunizations; record and print prescriptions; generate alerts and reminders; and receive laboratory tests” (Zucker, 2011, para. 4). Clinical Value Level 2 focused on interoperability of electronic prescribing with established drug information systems in place in many provinces and territories. In the past few years, Alberta has surged ahead of other provinces in Canada and greatly increased the number of family practice clinics operating an EMR. One private, unpublished study by POSP reported a 79.4% EMR adoption rate among general family physicians (D. Sheplawy, personal communication, January 29, 2013). However, this study simply asked the question of whether or not the physician‟s office owned and operated EMR software. It did not ask any questions regarding how much it was being used, what and how data were being captured, nor did it assess the meaningfulness of the use. The use of an EMR is a vast spectrum of greys that must be defined, if it is going to be studied. Measurement. The standard scale for measuring clinical meaningfulness of EMR usage is Healthcare Information and Management Systems Society (HIMSS) analytics. This scale was first developed to measure EMR use in hospitals in the United States, but
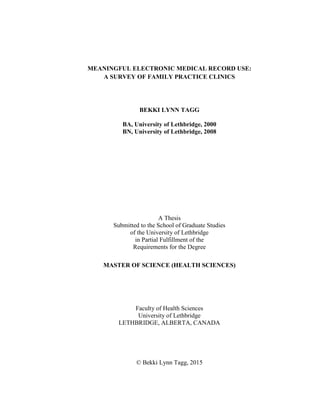
  • 25. 15 has also been applied in hospitals in Canada (HIMSS Analytics™, 2015a). There are seven stages of use, with the higher the number being a more advanced level of use. The questionnaires to produce these results are not available to the public, but the can be viewed on the HIMSS Analytics™ (2015b) webpage (www.himssanalytics.org/stagesGraph.asp). There are few existing studies that have examined the actual level of EMR usage in family practice clinics, but researchers‟ estimates suggest EMRs are being utilized at only a fraction of their potential capacity. Despite Canada‟s good intentions to increase the number of physicians using EMR systems, Dermer and Morgan (2010) claimed that only 14% of those physicians are using their EMRs to capture data in a meaningful way. One would expect to also see research documenting EMR implementation failure rates in family practice offices, but repeated searches by this researcher did not yield any results. The researcher‟s experience working in a family practice clinic, and in speaking to others in the same position, leads her to arrive at the conclusion that when EMR implementations go wrong in a family practice clinic, physicians and clinic managers are simply not in a financial position to declare an adoption a “failure” and walk away from it. Instead, they simply must bear with the situation because they have invested too much money to go back (Cramer, 2010, p. 30). These clinics will achieve only a low “stage” of EMR use. Researchers at the eHealth Observatory at the University of Victoria in British Columbia adapted the HIMMS analytics scale used in hospitals in the United States and Canada in order to be used in family practice clinics (Price, Lau, & Lai, 2011). This scale measures meaningful EMR use in stages from 0–5 (see Table 1). Throughout this paper,
  • 26. 16 the terms meaningful use, stage, and level of EMR use will be used as interchangeable concepts. Table 1 eHealth Observatory’s Meaningful EMR Use Stages Stage Cumulative Capabilities 0 Traditional paper-based practice. 1 Electronic reference material, but still paper charting. 2 Partial use of computers at point of care for recording patient information. 3 Computer has replaced paper chart. 4 Advanced clinical decision support in use, including practice level reporting. 5 Full EMR interconnected with regional/community hospitals, other practices, labs and pharmacies for collaborative care. Price et al. (2011) organized their scale into 10 functional categories: Health Information, Laboratory Management, Diagnostic Imaging, Prescription Management, Referrals, Decision Support, Electronic Communication & Connectivity, Patient Support, Administrative Processes, and Reporting and Population Health Management. The only research found applying this same staging tool was a case study reported by Price et al. (2011) that was performed in a full-service family practice clinic in rural British Columbia documenting their stage of EMR use at two months after adopting an EMR, and then a follow-up at eight months post-adoption (see Figure 1). The data showed that from month two to month eight there was an EMR stage increase from 2.17 to 2.87. However, not all categories had equal improvement. The greatest improvement was in practice reporting and reflection.
  • 27. 17 Figure 1. Differences in EMR adoption assessments of one case study clinic at two and eight months post EMR adoption measuring several aspects of EMR functioning. Note. From “Measuring EMR adoption: A framework and case study” by M. Price, F. Lau, and J. Lai, 2011, Electronic Health Care, 10(1), p. e26. Copyright 2011 by Longwoods. It is important to note that in order to attain a Level 5 there needs to be certain provincial infrastructure in place. For example, if there is no provincial repository for prescription information and no system for e-prescribing, there is a ceiling effect that keeps a clinic at a Level 4 until such a time that those larger provincial systems are available. It was only after this researcher had undertaken her study using the above- described measurement tool when the HIMSS Analytics™ (2015b) website released a set of results for a questionnaire based on an ambulatory or clinic-based EMR. Like the other HIMSS Analytics™ measurement tools, the actual questionnaire itself is not available for the public, but the results can be viewed on the HIMSS Analytics™ website (www.himssanalytics.org/emram/index.aspx).
  • 28. 18 Theoretical Framework The main theoretical framework for this study is based on the work of Klein and Sorra (1996) and their Innovation Implementation Model. Innovation implementation model. Katherine Klein and Johann Sorra coined the term of Innovation Implementation in their seminal work “The Challenge of Innovation Implementation” published in 1996. Since their model focused on “innovations that require the active and coordinated use of multiple organizational members to benefit the organization” (Klein & Sorra, 1996, p. 1057), this model is appropriate to use when assessing EMR implementations (see Figure 2). There were some basic definitions Klein and Sorra (1996) used in their model that were slightly different than the typically understood meanings. Klein and Sorra defined Innovation Adoption as “a decision, typically made by senior organizational managers, that employees within the organization will use the innovation in their work” (p. 1055). In contrast, they defined Innovation Implementation as “the transition period during which targeted organizational members ideally become increasingly skillful, consistent, and committed in their use of an innovation” (Klein & Sorra, 1996, p. 1057). Implementation Failure is said to occur when “employees use the innovation less frequently, less consistently, or less assiduously than required for the potential benefits of the innovation to be realized” (Klein & Sorra, 1996, p. 1055). More and more, they claimed, it is the implementation of the innovation that is to blame for failures, not the innovation itself. Climate for implementation. When describing the climate in an organization during the implementation of a specific innovation, Klein and Sorra (1996) referred to “a
  • 29. 19 targeted employees‟ shared summary perceptions of the extent to which their use of a specific innovation [would be] rewarded, supported, and expected within their organization” (p. 1060). In order to gain a positive climate for implementation, Klein and Sorra scoured existing literature and found several techniques, policies and practices that may influence how an innovation is used. Techniques included adequate training, user support, time for users to experiment with the innovation, and praise from supervisors for innovation use. Policies included constraints on budgetary expenses during implementations, job reassignment, or even job elimination for employees who did not learn to use the new innovation (Klein & Sorra, 1996). Klein and Sorra (1996) applied a three-pronged approach to foster a strong implementation climate by “(a) ensuring employee skill in innovation use, (b) providing incentives for innovation use and disincentives for innovation avoidance, and (c) removing obstacles to innovation use” (p. 1060). Klein, Conn, and Sorra (2001) validated the concept of climate for implementation in their study when it came to management support, financial resource availability, policies and practices, and overall climate. The validation study conducted by Holahan, Aronson, Jurkat, and Schoorman (2004) found that climate for implementation is a key predictor for implementation effectiveness, especially when measured as a quality of innovation use and consistency of use. They also found that an organization‟s receptivity towards change was an important antecedent of climate (Holahan et al., 2004). Osei-Bryson, Dong, and Ngwenyama (2008) discovered an unexpected finding utilizing a data analysis method called the multivariate adaptive regression splines technique, which is “a technique used for discovering, evaluating, and describing the causal links between factors in any theoretical model”
  • 30. 20 (p. 510). Osei-Bryson et al. discovered that managers have the ability to manipulate both the Implementation Climate and the Innovation-Values Fit in order to achieve innovation implementation. The proposed causal links in Klein and Sorra‟s (1996) innovation implementation model is discussed below (see Figure 2). Ensuring that a climate for implementation exists in family practice clinics refers to employee perceptions of the practices, procedures, and behaviours that get rewarded, supported, and expected with regard to the use of EMRs. An example of this is when members of clinic staff are consistently informed about new updates to the technology, software, and changes to the workflow (i.e., mean emphasis). These actions help maintain their interest about why they should care about the system by making it feel like “their” system (i.e., goal emphasis). Task Support empowers them by giving them the tools to keep them up to date with training, and Reward Emphasis serves as a reward system and cause employees to be extrinsically motivated to use the system better. Innovation-values fit. Klein and Sorra (1996) also hypothesized that “employees‟ commitment to the use of an innovation is a function of the perceived fit of the innovation to employees‟ values” (pp. 1062–1063). They also state that “innovation- values fit describes the extent to which targeted users perceive that use of the innovation will foster (or conversely, inhibit) the fulfillment of their values” (Klein & Sorra, 1996, p. 1063). As mentioned above, Osei-Bryson et al. (2008) found evidence that managers have the ability to manipulate Innovation-Values Fit in order to improve the implementation of innovations. An unexpected finding was that there was the influence of innovation-values fit on implementation effectiveness. These researchers stated that high Innovation-Values Fit helped users to obtain better skills, perceive less obstacles,
  • 31. 21 and feel more motivated while using the system. One explanation for this was that if users felt that the innovation would help them solve their work-related problems, they would internalize the benefits of the system. They would, therefore, be more open to learning about and mastering the system, thus becoming more intrinsically motivated. Dong, Neufeld, and Higgins (2008) replicated these findings in their study. Figure 2. Klein and Sorra‟s Model: Determinants and Consequences of Implementation Effectiveness. Note. From “The Challenge of Innovation Implementation,” by K. J. Klein & J. S. Sorra, 1996, Academy of Management Journal, 21, p. 1056. Copyright 1996 by Klein & Sorra. Reprinted with permission. Skills, incentives, absence of obstacles and commitment. If the family practice clinic can establish an Implementation Climate and ensure an effective Innovation-Values Fit, the presence of these things can help to facilitate enhanced Skills (e.g., a higher-order understanding of the EMR, and how some parts of the EMR system link with other parts of the system); facilitate the Absence of Obstacles (e.g., identifying and removing organizational or technical barriers for using the EMR system); ensure Incentives (e.g., determining if employees are discouraged or motivated to use the EMR system); and facilitate employee Commitment (e.g., seeks to understand if employees attach
  • 32. 22 personal meaning to the EMR system, and if they enjoy mastering it and discussing it with other colleagues). Implementation effectiveness. The combination of the above stated measures can lead to Implementation Effectiveness. In this state, employees choose to use the system given the opportunity, and feel it is a valuable addition to the work practices of the organization. Strategic accuracy of innovation. In their original article, Klein and Sorra (1996) did not mention “strategic accuracy of innovation” (p. 1056) outside of the diagram of the actual model. In a correspondence with K. Klein (personal communication, November 28, 2012), the researcher was told that this measure indicated whether the innovation was actually appropriate for the organization. However, Klein stated that this measure has not been empirically tested, as there is currently no “formal” measure for doing so. It is for this reason that this researcher decided to exclude this from her conceptual framework. Innovation effectiveness. The final measure of Klein and Sorra‟s (1996) model titled Innovation Effectiveness (p. 1056) is intended to be measured by a scale assessing the level of use for the innovation under study. Therefore, in this case, this researcher chose to apply Price et al.‟s (2011) measure of Meaningful EMR Use into this portion of the model. The measure of Meaningful EMR Use looked at the extent to which clinics optimize the capabilities of their EMR system.
  • 33. 23 Chapter Three: Research Design Research Objectives The primary research objective for this study was to assess meaningful EMR use in family practice clinics across the Province of Alberta. In conducting this project, this researcher did the following:  Applied the Klein and Sorra (1996) model for innovation implementation to understand the importance of developing a climate for implementation with EMRs in family practice clinics.  Explored the Implementation Climate and the level of Meaningful EMR Use that existed within family practice clinics in the province of Alberta.  Examined the importance of innovation values fit in achieving meaningful EMR use.  Provided family practice clinics with a measure with which they could gauge the extent of EMR use. Research Hypotheses The following hypotheses guided this research study:  Hypothesis 1: In the family practice clinics under study, there is a positive relationship between Implementation Climate and Meaningful EMR Use.  Hypothesis 2: In the family practice clinics under study, there is a positive relationship between Innovation-Values Fit and Meaningful EMR Use.  Hypothesis 3: The stronger the implementation climate for a given innovation (i.e., EMRs), the greater employees‟ use of that innovation (i.e., meaningful EMR use), provided there are high levels of commitment.
  • 34. 24  Hypothesis 4: Some of the barriers to EMR use identified in the literature will also be found in the present study (e.g., lack of training and support). Research Design The research consisted of a pilot study followed by a quantitative study. The full survey for Meaningful EMR Use can be found in Appendix A along with the Letter of Informed Consent (see Appendix B). Phase I: pilot study. The researcher first conducted a pilot study to assess the overall data collection process including the online survey instrument. The researcher was interested in assessing the time it would take to complete the survey, the flow of questions, wording, and to ensure face and content validity. The pilot study consisted of a convenience sample of five participants (n = 5) from one single physician family practice clinic, which was the primary place of employment of the researcher. The sample included one family practice physician, one receptionist, one registered nurse, and two medical office assistants. To avoid conflict of interest, this pilot study data was not included in the final analysis. The setting, sample, instrument and measures, and methods for data collection and data analysis were similar to what is described below in Phase II, only differing in the means for recruitment and the sample size. The researcher chose this clinic because in November of 2010 this clinic switched EMR systems, moving from the EMR Clinicare to the EMR Telus Med-Access. In addition, the clinic voiced support for the study and agreed to participate. The pilot study participants were asked to complete the online survey and then provide feedback on their experience with the survey. Some of the feedback received pointed to a few missing commas, misspelled words. It was also reported that the survey
  • 35. 25 was quite long. In addition, Question 10 originally reading, “Is your clinic a Family Care Clinic (FCC),” was confusing to the respondents. They mistakenly identified their primary care network (PCN) clinic as a family care clinic (FCC). Question 10 was then changed to, “Is your clinic a Family Care Clinic (FCC)? (Definition: An FCC is one of the 24 facilities announced for creation throughout Alberta by [former] Premier Alison Redford in June 2013. A clinic cannot be both a PCN facility and an FCC facility).” The researcher did not conduct statistical analysis of the pilot study data due to the small sample size. Phase II: Quantitative survey. The changes suggested by the participants in the pilot study were made. Next, a quantitative survey was conducted. Setting. The setting for this study involved family practice clinics within the industry of health care in the Province of Alberta. According to a representative at POSP, at the time the study was conducted, there were approximately 845 family practice clinics and 2,895 family practice physicians in Alberta (D. Sheplawy, personal communication, March 24, 2013). Within this number, approximately 2,300 of these physicians used an EMR system (D. Sheplawy, personal communication, January 29, 2013). Family practice clinics serve as a first point of contact for the public entering the health care system. Family doctors are held as the most responsible person to create and maintain a patient‟s health care record over the years. Patients go to their family doctor for episodic care such as infections, intermittent care such as prenatal care, and chronic care such as diabetes and hypertension management. They also manage patients who have complex multiple conditions, and those who are on multiple continuous prescriptions. The responsibility for regular screening for things like breast, colon, and
  • 36. 26 cervical cancer, as well as several other diseases and conditions also falls on the shoulders of the family physician. Some clinics in this research had only the reception staff and one physician, while others had a number of multidisciplinary staff members (e.g., dieticians, physiotherapists, registered nurses, etc.). In addition, some clinics were members of the PCN and some were funded through POSP while others were not. Regardless of these factors, participants had only to fulfill the criteria of working in a family practice clinic in Alberta that had some sort of EMR system currently in place. Sample. At the organizational level of analysis, there were approximately 845 (N = 845) family practice clinics in Alberta and 2,895 family practice physicians. Assuming one assistant per physician, the researcher aimed to recruit 338 (n = 338) participants in order to have a 95% CI, or n = 247 to have a 90% CI. Due to unexpected recruitment difficulties, the researcher was only able to recruit 139 participants (41% success rate) during the 8-month period that she attempted to collect data. Inclusion criteria involved clinics located within any one of the five zones within Alberta Health Services (refer to Appendix C: Alberta Health Services Zone Map) who currently had an EMR system in place (e.g., Telus Wolf, Practice Solutions, Telus Med- Access, etc.). The researcher attempted to acquire data from PCN and non-PCN clinics as well as POSP and non-POSP clinics. Data collection method. Study participants were recruited through convenience sampling. The researcher chose to apply a quantitative method to this study through the use of an online survey. The following steps were applied for data collection:
  • 37. 27 Step 1: Recruit participants. A faxed letter to inform (i.e., Call for Participants) was the primary means for recruiting participants (refer to Appendix D). This faxed letter was sent to all physician clinics in the Province of Alberta; a list that was acquired from the College of Physicians and Surgeons website. Of the 845 family practice clinics listed on the College of Physicians and Surgeons of Alberta (n.d.) website, 802 clinics had fax numbers, and 43 did not. The researcher sent faxes to each of the 802 clinics with fax numbers, and sent paper copies to the other 43 clinics. One month later, the letter was faxed again to those clinics who had not yet responded. Realizing that this population was quite difficult to access, the researcher decided to employ other strategies to acquire participants. The researcher networked with her professional contacts across the province. A call for participants was put in both the Primary Care Initiative and Alberta Medical Association‟s monthly electronic newsletter. There was a notice to POSP employees, a post placed on a professional networking site, Yammer (2015), and a message sent out to the Alberta Screening and Prevention Improvement Facilitators Network group (AS@p). Finally, some cold calls were done to clinics in specific health care zones in which limited interest was shown initially. Through various efforts, 47 clinics responded with interest to participate in the survey. Of those 47 clinics, 44 ultimately did complete the survey, which provided a clinic participation rate of 93.6%. In looking at the response rate of 44 clinics out of the total 845 clinics in the province, the response rate is 5.2%. Step 2: Secure participants and distribute memo to inform. During the recruitment process (i.e., in the Call for Participants letter; see Appendix D), interested subjects were asked to contact the researcher directly for further information. Once participants emailed the researcher to express their interest, the researcher then emailed them the Description
  • 38. 28 of Research Study (see Appendix E). The most crucial part to the smooth progression of the data collection process was that the participants followed the instructions on the Call for Participants. The participants were asked to include the name of their clinic and the city or town name so that the researcher could generate a clinic code, which was used to keep all clinic specific data together. If a participant emailed their interest without including these details, the researcher responded with an email requesting this information. The intent in following this procedure was that the researcher could produce customized reports for participating clinics and provide a more thorough analysis at the level of the organization. This was a preferable method because it would avoid the potential for entry errors that would compromise the integrity of the data set. If a participant had concerns about providing this information, it was stressed that only the researcher would have the master list of which clinics belonged with which clinic codes, and that this information would remain private and in a secured location known only to the researcher and her supervisor. Step 3: Distribute letter of consent with customized survey link. Once participants were confirmed, the researcher then followed up with an email that contained the Letter of Informed Consent (see Appendix B), and another email containing a customized link to the online survey. In the body of this email, the researcher asked the participant to complete the survey within a two-week time frame. The participant was encouraged to tell others who would also qualify for the research (family physician with an EMR). If the participant knew of other people in another clinic who would like to participate, the individual was asked to email the researcher with the name of the new clinic and the city or town to ensure the new clinic had a code in order to complete the survey.
  • 39. 29 The call for participants was almost always responded to by the clinic manager. Acting as a point person, the manager emailed the researcher to express interest in having their clinic participate. The manager then inquired amongst staff members of their clinic as to who wanted to participate, and then provided a list of email addresses to the researcher. The researcher registered the participants in the database using SurveyMonkey® (2015). She then emailed each of the participants individually with a unique link to the online survey, as well as the document Description of Research Study found in Appendix E. If a participant had not responded to their unique link within a 2- week time period, a reminder email was sent. Step 4: Participants complete the survey. The online survey was completed by the participants using SurveyMonkey® (2015), which is a web survey development cloud- based company. When participants clicked on the survey link provided to them and completed the survey, the data were automatically compiled into the online database. The survey took approximately 25 minutes to complete (refer to Appendix D for survey questions). Of the 194 participants emailed from within the 44 (n = 44) participating clinics, 139 (n = 139) completed the survey, providing a response rate of 72% (attrition rate of 28%). The researcher chose to analyze the data at two levels of analysis: the clinic or organizational level (n = 44) as well as the individual level (n = 139). Data collection experience. Upon reflecting on the process of recruitment and data collection, several challenges, limitations, and strengths were discovered that merit discussion. These items are discussed in the following section. Challenges and limitations. In general, the researcher experienced many difficulties in accessing this population. The researcher had to be quite persistent with
  • 40. 30 those clinics and individuals who had agreed to participate in order for them to follow through to completion. Having a unique link sent to each participant was found to be a detriment to participation. There were times that a participant wanted to “send the link” to their colleague. Instead, the researcher had to get the email address of the colleague and go through the SurveyMonkey® (2015) registration process in order to have the new individual participate. As a result, some participants expressed hesitancy to complete the survey because their responses were going to be temporarily connected to their email addresses. The reason for this process was clearly explained to the participants in the “Description of Research Study” document (see Appendix E), but nevertheless this remained a factor for some participants. The researcher found that in speaking with health care leaders at a program planning level there was great interest in and support for the study, and many expressed a desire to participate; however, because they did not work at a clinic level, they did not fit the criteria, and could not participate. These people would try to recruit down to specific clinics they worked with, but this method didn‟t yield any new participants. This spoke to the difficulty of getting those at a clinic level to participate in practice assessment, even when they were invited by their direct leaders. It was also challenging to recruit several employees from one clinic. Most times, a clinic had less than five people participating, and many times only the clinic manager completed the survey. This was an unexpected phenomenon. The researcher did emphasize that there would be a benefit to the clinic if there were many participants,
  • 41. 31 since participating clinics would receive a customized report with a summary of findings. However, this did not sufficiently motivate the target group. The length of the survey deterred many from participating. There were several participants who didn‟t finish the entire survey in their first session. These people usually did not return on their own to finish it, and reminder emails ad to be sent requesting the participants to complete the survey. Strengths. Many of the people contacted throughout the process were pleased that research was being done in this area, and expressed a desire to view the results once the study was complete. Although the unique links and registration process made it difficult to recruit participants, knowing a participant‟s clinic opened up interesting possibilities for analysis that would not otherwise exist. The registration process also allowed for a very accurate calculation of participation rates. The length of the survey, though identified as one of the challenges to recruitment, allowed for a comprehensive view of the study topic. Instrument and measures. The survey instrument used in this study included well-established measures borrowed from the literature, and a recently developed measure borrowed from industry. The well-established (scholarly) measure was the Klein and Sorra (1996) 50-item measure for assessing innovation implementation (i.e. Innovation Implementation Model). The industry measure was developed by Price et al. (2011), and was a 30-item EMR adoption survey measure (Meaningful EMR Use). In addition, some demographic questions were included that assessed attributes of participants‟ clinics (including number of general practice physicians and number of non- physician health care employees in the clinic), and personal demographics such as age
  • 42. 32 and gender. By asking these questions, the researcher hoped to explore the relationship between innovation implementation and meaningful EMR use as it related to employee composition, age, and gender. The survey instrument contained a total of 80 questions and 20 demographic questions with an estimated completion time of 25 minutes. Klein and Sorra’s innovation implementation model. The content validity of the Innovation Implementation Model and its measures came from its long-established use in several studies across several sectors. Construct validity was also shown by the established reliabilities between α = 0.78 to 0.92 reported in the literature. The first 50 items came directly from Klein and Sorra‟s (1996) Innovation Implementation questionnaire, and were categorized according to the following measures: Implementation Climate, Innovation-Values Fit, Skills, Absence of Obstacles, Incentives, Commitment, and Implementation Effectiveness. Factor analyses were conducted for all of these measures, and are included in the Appendix G with a sample presented in Table 2. Table 2 Innovation Implementation Items Variable Questionnaire Item Description Implementation Climate 17 items; 14a–14q  Mean Emphasis 14a–14c  Goal Emphasis 14d–14f  Task Support 14g–14l  Reward Emphasis 14m–14q Innovation-Values Fit 13 items; 15a–15m  Quality 15a–15f  Locatibility 15g–15j  Flexibility and Coordination 15k–15m Skills 6 items; 16a–16f Absence of Obstacles 3 items; 17a–17c Incentives 2 items; 18a–18b
  • 43. 33 Variable Questionnaire Item Description Commitment 4 items; 19a–19d Implementation Effectiveness 5 items; 20a–20e Implementation Climate assessed “employees shared summary perceptions of the extent to which their use of a specific innovation is [would be] rewarded, supported, and expected within their organization” (Klein & Sorra, 1996, p. 1060). This 17-item measure (Cronbach‟s α = 0.90) was based on the work of Kopelman, Brief, and Guzzo (1990) and Dong et al. (2008), and included the sub-measures of Mean Emphasis, Goal Emphasis, Task Support, and Reward Emphasis. Items were assessed in a five-point Likert scale ranging from 1 (Strongly Disagree) to 5 (Strongly Agree). Higher scores were indicative of higher levels of implementation climate.  Mean emphasis: These three items (14a, 14b, 14c) focused on the extent to which employees are made aware of methods and procedures. An example item was “Employees were told about the changes in the work procedures due to the implementation of the system.”  Goal emphasis: These three items (14d, 14e, 14f) focused on goal emphasis, which is the extent to which employees are made aware of outcomes and standards. An example was “Employees were told the types of outcomes that they needed to accomplish in using the system.”  Task support: These six items (14g, 14h, 14i, 14j, 14k, 14l) focused on how much employees felt they were being supported and supplied with necessary resources to do their jobs, including equipment, services, and training. An
  • 44. 34 example item was: “Employees were given sufficient time to learn the new system before they had to use it.”  Reward emphasis: These five items (14m, 14n, 14o, 14p, 14q) sought to understand employees‟ perceptions on the connection between job performance and organizational rewards. An example item was: “Employees were told the potential risk if they did not use the new system.” A factor analysis with Varimax rotation converged in six iterations and yielded four factors with an eigenvalue greater than 1.00 that explained 74.3% of the variance (Cronbach‟s α = 0.91). Attempting to categorize the components, the researcher discovered that the yielded groupings were inconsistent and ambiguous and some items were loading on multiple components. These items (items g, l, and m) were removed. From here a second factor analysis was run using Varimax rotation, which converged in five iterations and explained 72.63% of the variance. Although the reliability was slightly lower (Cronbach‟s α = 0.89), there was much more clarity to these categorizations. The researcher identified these categories as employee awareness (items 14a, 14b, 14c, 14d, 14e, 14f), which assessed the degree to which employees are aware of the methods, procedures, and expectations when using the system (six items; Cronbach‟s α = 0.93). The next component that emerged focused on external rewards (14n, 14o, 14p, 14q), which looked at employees‟ perception of the evaluation of their performance and recognition of effort (four items; Cronbach‟s α = 0.89). Finally, there was a component featuring training and support (items 14h, 14i, 14j, 14k), which spoke of the resources available to employees in order to further their knowledge and skill in operating the EMR
  • 45. 35 (four items; Cronbach‟s α = 0.80). A complete set of factor analyses are found in Appendix G. Innovation-Values Fit assessed “the extent to which targeted users perceive that the use of the innovation will foster (or conversely, inhibit) the fulfillment of their values” (Klein & Sorra, 1996, p. 1063). This measure contained 13 items (Cronbach‟s α = 0.92), which were divided into the following three sub-dimensions: Quality, Locatibility, and Flexibility and Coordination. Dong et al. (2008) developed this 13-item construct based on research by Goodhue and Thompson (1995), and Valle, Martin, Romero, and Dolan (2000). The sub-measures are explained as follows:  Quality: This sub-measure contained six items and assessed the extent to which information was current, up to date, and useful.  Locatibility: This four-item sub-measure assessed how easy it was to locate the desired information. Some wording was modified in this item to better suit the context of family practice clinics.  Flexibility and Coordination: This final sub-measure consisted of three items and assessed the extent that the system enhanced the work process. This researcher changed the wording from “departments” to “departments or working groups” to make it more appropriate for family practice clinics. A factor analysis with Varimax rotation produced two components with an eigenvalue greater than 1.00 that explained 62.4% of the variance. The rotation converged in three iterations, Cronbach‟s α = 0.92. The researcher attempted to group components in a more distinct way by forcing number of components to be in line with the literature (i.e., three components). However, the explanation of variance did not
  • 46. 36 improve, and some components continued to load onto multiple components. Refer to Appendix G for detailed factor analysis matrix. The six item Skills measure (Cronbach‟s α = 0.90), was developed by Dong et al. (2008). These authors partially based this item on training material from an enterprise system vendor, and sought to discover if a user had a higher-order understanding of the EMR, and how some parts of the EMR system linked with other parts of the system. An example item was, “I am very knowledgeable about how the system works.” A factor analysis produced one component (Cronbach‟s α = 0.84) with an eigenvalue greater than 1.00 that explained 56.25% of the variance. As only one component was extracted, the solution could not be rotated. An example of the factor analysis for this item is shown in Table 3. A complete set of factor analyses are provided in Appendix G. Table 3 Factor Analysis for Skills Items: Skills Component 16d. I know how data in my work group links to data in other work groups. 0.83 16e. I know which work groups receive the information I input into the system. 0.77 16b. I understand all of the special features of the system. 0.76 16a. I am very knowledgeable about how the system works. 0.75 16f. I can interpret the data shown in the system without problems. 0.73 16c. I can enter into the system whenever I need to. 0.65 Note. Extraction Method: Principal Component Analysis; 1 component extracted; Cronbach‟s α = 0.84; Eigenvalue = 3.38; % Variance = 56.25%. The three-item Absence of Obstacles scale (Cronbach‟s α = 0.83) was created by Dong et al. (2008). This scale was based on Klein and Sorra‟s (1996) definition to assess if the use of a computerized system was being supported or blocked. All items were
  • 47. 37 reverse-scored as stated in the literature (e.g., “Due to the lack of technical support, I have found the system difficult to use”). A factor analysis produced one component with an eigenvalue greater than 1.00 that explained 75.05% of the variance. Again, because only one component was extracted, the solution could not be rotated (α = 0.83). The two item Incentives scale (Cronbach‟s α = 0.78) was created by Dong et al. (2008), and was based on the work Klein and Sorra (1996). This measure determined if employees were discouraged or motivated to use the EMR system. An example items was, “I am motivated to use the system.” A factor analysis produced one component (α = 0.70), with an eigenvalue greater than 1.00 that explained 78.64% of the variance. Again, because only one component was extracted, the solution could not be rotated. The four item Commitment scale (Cronbach‟s α = 0.84) was created by Dong et al. (2008) by adapting the measure of Meyer and Allen (1991). This item sought to understand if employees had begun to attach personal meaning to the EMR system, and if they enjoyed mastering it and discussing it with other colleagues. An example item was, “Using the system is personally meaningful to me.” A factor analysis produced one component (Cronbach‟s α = 0.84), with an eigenvalue greater than 1.00 that explained 68.00% of the variance. Again, because only one component was extracted, the solution could not be rotated. The five item Implementation Effectiveness scale was created by Dong et al. (2008) by adapting Klein et al. (2001). This measure explored if employees would choose to use the system given the opportunity, and if they felt it was a valuable addition to the work practices of the organization. Klein et al. (2001) originally developed three sub- measures for this scale as avoidance, endorsement, and quality of use. The corresponding
  • 48. 38 Cronbach‟s α were 0.68, 0.85, and 0.75, respectively, and 0.89 for the measure as a whole. However, in Dong et al.‟s (2008) work there was no division into sub-measures. This researcher slightly modified the wording of one item to make it more relevant to family practice clinics - the word “plant” was replaced with “clinic.” All five items in this scale were reverse-scored as shown in the literature. An example item was, “If I had my way, this clinic would go back to the old way and forget the system.” A factor analysis produced one component measure (α = 0.88) with an eigenvalue greater than 1.00 that explained 70.47% of the variance. Again, because only one component was extracted, the solution could not be rotated. Meaningful EMR use. There were 30 items with 10 dimensions that assessed EMR usage from a scale adapted from Price et al. (2011). The researcher modified some items to make them less wordy and to remove any reference to programs and tools used exclusively in the province of British Columbia, where the scale was created. The responses were placed on a continuum from 0 (zero) to 5, with zero representing minimal use and 5 representing high-stage and meaningful use. The original scale (eHealth Observatory, 2011) has 10 items in which there are blanks within the 0 - 5 range. According to the principal author, Morgan Price, “The gaps are intentional - we were not able to find realistic examples of that feature at that level” (M. Price, personal communication, November 13, 2012). This researcher adapted nine of these items to have full-scale range, leaving only one item without a fifth-range option. Up until Price et al.‟s study, no validations had been performed on this scale and no assessments done beyond simple reporting (M. Price, personal communication, November 13, 2012), there were no established Cronbach‟s α values to report. Since this scale was not yet tested, this
  • 49. 39 researcher attempted to gain some content validity by consulting with those professionals working in physician offices to ensure that the tool appeared to measure what it set out to measure, and that the levels of use were realistic. Determining the reliabilities for the items and offering some initial quantitative content validity is a contribution to the literature made through this study by this author. The Cronbach‟s α for the full 30-item measure was α = 0.88. The 10 dimensions of the measure were as follows:  Health Information: (three items; 21–23)  Medications (four items; 24–27)  Laboratory (two items; 28–29)  Medical Imaging: (three items; 30–32)  Referrals: (three items; 33–35)  Decision Support: (four items; 36–39)  Electronic Communication and Connectivity (three items, 40–42)  Patient Support: (two items; 43–44)  Administrative Processes: (four items; 45–48)  Reporting and Population Health Management (two items; 49–50) The three item Health Information measure was originally created by Price et al. (2011) to assess the level at which general patient information was being kept in the clinic. An example was “Where do you keep a patient‟s medical summary?” Response 0 (zero) read “I maintain a separate face sheet in the paper chart that I manually update.” A response of 5 indicated, “as described above, (I use my EMR, which stores all my patient information in a structured form, e.g., Coded problem lists, drop-downs, pick lists, etc.), but the EMR also syncs summary data with a provincial electronic health record.” A
  • 50. 40 factor analysis produced one component (α = 0.45) with an eigenvalue greater than 1.00 that explained 52.78% of the variance. As only one component was extracted, the solution could not be rotated. These numbers indicate that this is only a moderately reliable measure. The four item Medications measure was originally created by Price et al. (2011) to assess the level at which medication information was being created and supported in the clinic. An example item was “How do you write new drug prescriptions?” A response of 0 (zero) stated “I write them on my RX pad and record them in the patient‟s paper chart,” whereas a response of 5 was “I write them for all patients using my EMR which has an advanced RX module and is linked to a province wide ePrescription system that is linked to pharmacies.” A factor analysis produced one component Cronbach‟s α = 0.64 with an eigenvalue greater than 1.00 that explained 52.86% of the variance. Since only one component was extracted, the solution could not be rotated. The two item Laboratory measure was originally created by Price et al. (2011) to assess the processes for ordering and receiving lab tests in the clinic. An example was, “How do you receive, review, and process lab results?” A response of 0 (zero) stated, “Lab reports of tests I ordered (or were copied to me) are received in paper form by mail and/or fax and filed in the paper chart.” However, a response of 5 corresponded to “All lab results I ordered (or were copied to me) are downloaded into my EMR, which also has a viewer to integrate and display all available lab data on a patient from multiple lab databases and hospitals.” A factor analysis produced one component (Cronbach‟s α = 0.52) with an eigenvalue greater than 1.00 that explained 68.95% of the variance. As only
  • 51. 41 one component was extracted, the solution could not be rotated. These numbers indicate that this is only a moderately reliable measure. The three item Medical Imaging measure was originally created by Price et al. (2011) to assess the processes for ordering and receiving medical imaging tests in the clinic. An example item was: “How do you order diagnostic tests?” (i.e., X-rays, U/S, MRI, PFT, stress tests, etc.). A response of 0 (zero) read, “I complete a paper requisition specific to each diagnostic center,” whereas a response of 5 stated “I use an advanced diagnostic test requisition manager in my EMR that is securely linked to diagnostic test sites so that I can order, record and reconcile tests electronically. No paper requisitions are generated.” A factor analysis produced one component (Cronbach‟s α = 0.22) with an eigenvalue greater than 1.00 that explained 39.14% of the variance. These low numbers indicate that this is not a reliable measure. The three item Referrals measure was originally created by Price et al. (2011) to assess the processes for ordering, receiving, and managing referrals in the clinic. An example was, “How do you make a referral?” A score of 0 (zero) stated, “I hand write the referral letter. My MOA arranges the appointment.” A score of 5 claimed, “I use my EMR‟s referral manager, which is linked on a secure network with consultants located in private offices and/or hospitals. The consultant can view referral data when an electronic request is sent. Referral appointments can be made online within the network.” A factor analysis with Varimax rotation produced two components (Cronbach‟s α = 0.09) with an eigenvalue greater than 1.00 that explained 70.08% of the variance. This extremely low Cronbach‟s of 0.09 indicated that this was not a reliable measure, likely due to the large number of excluded responses (54%) in this item. The first component was identified by
  • 52. 42 the researcher as referral management, and included items 34 and 35. The second component was identified as referral requests, and consisted of only item 33. The four item Decision Support measure was originally created by Price et al. (2011) to assess the extensiveness of the use of decision supports for patient care in several areas of clinical practice. One example was, “How are patient reminders (for follow-up and prevention) generated in your office?” A score of 0 (zero) corresponded to, “Manually: when I see a patient I record a follow-up in the patient‟s chart or I rely on my memory.” A score of 5 stated, “I use an EMR with a rule-based reminder system that also leverages information on provincial and other external repositories to adjust rules (e.g., will confirm if patients have had immunizations from public health).” A factor analysis with Varimax rotation produced two components (Cronbach‟s α = 0.59) with eigenvalue greater than 1.00 that explained 72.44% of the variance. There were 64.0% of responses excluded. The first component was identified by the researcher as reminder systems, and included items 38 and 39, Cronbach‟s α = 0.68. The second component was identified as reference materials, and included items 36–37 (Cronbach‟s α = 0.24). These numbers indicated that both the total measure, as well as the reminder systems component, were moderately reliable measures. However, the second component, reference materials, was not a very reliable measure. The three items Electronic Communication and Connectivity measure were originally created by Price et al. (2011) to measure the integrity and accessibility of patient records both within and from outside the clinic. An example was, “How do you access your records while you are out of the office?” A score of 0 (zero) stated, “I cannot access information in my records while I am out of the office.” A score of 5 indicated,
  • 53. 43 “As described above (I regularly access my EMR through a secure connection, e.g., by Remote Desktop, Citrix, or a secure website, but I can also access my EMR from the hospital.” A factor analysis produced one component with an eigenvalue greater than 1.00 that explained 49.89% of the variance with Cronbach‟s α = 0.48. These numbers indicated that this was only a moderately reliable measure. The two item Patient Support measure was originally created by Price et al. (2011), and measured the level of support provided to patients through the use of different means of health information (e.g., information handouts). An example was, “How do you share the patient‟s own information with them?” A score of 0 (zero) indicated, “I do not provide patients copies of results.” A score of 5 corresponded to, “Our EMR can send data to our patients‟ Personally Controlled Health Record. This is used by at least 10% of patients in the practice.” A factor analysis produced one component (Cronbach‟s α = 0.29) with an eigenvalue greater than 1.00 that explained 59.14% of the variance. As only one component was extracted, the solution could not be rotated. These low numbers indicated that this was not a very reliable measure. The four item Administrative Processes measure originally created by Price et al. (2011) looked at the level of efficiency of administrative processes in the clinic. An example was, “How do you bill in the practice?” A score of 0 (zero) read, “I write my billings on paper and send them to a billing service OR I submit on paper.” A score of 5 stated, “I use my EMR and it auto-populates the billing codes based on my notes in the patient chart. These can be edited and managed within the EMR.” A factor analysis produced one component (Cronbach‟s α = 0.58) with an eigenvalue greater than 1.00 that
  • 54. 44 explained 46.19% of the variance. These low numbers indicated that this was only a moderately reliable measure. The two item Reporting and Population Health Management measure, originally created by Price et al. (2011), looked at the extent to which the clinic is capable of running customized reports and managing disease registries. An example item was, “How do you run reports or create recall lists in your practice?” A score of 0 (zero) said, “We do not. OR We have paper lists and calendars where we put recalls for mammograms etc. OR we rely on the provincial programs for recalls.” A score of 5 claimed, “As described above (we have complex reports in our EMR that we use e.g., diabetics with A1C over 8% who haven‟t been seen in three months, and we create our own reports), but the report queries also include additional data from regional/provincial systems in some way.” A factor analysis produced one component (Cronbach‟s α = 0.74) with an eigenvalue greater than 1.00 that explained 79.45% of the variance. As only one component was extracted, the solution could not be rotated. These numbers indicated that this was a reliable measure. Up until this time, the Meaningful EMR Use scale had not yet been established in the literature. This research study was the first to report reliability and variance statistics for each measure. Many of these tests showed low reliability (see Table 4), and this researcher recommends that further development to be done to improve the measure.
  • 55. 45 Table 4 Reliability and Variance for the measure of Meaningful EMR Use Sub-Measures of Meaningful EMR Use Cronbach‟s α Component s Extracted % Variance Explained Reporting and Population Health Management 0.74 1 79.45% Medications 0.64 1 52.86% Decision Support 0.59 2 72.44% - Reminder Systems 0.68 - 45.62% - Reference Materials 0.24 - 26.83% Administrative Process 0.58 1 46.19% Laboratory 0.53 1 68.95% Electronic Communication and Connectivity 0.48 1 49.89% Health Information 0.45 1 52.78% Patient Support 0.29 1 59.14% Medical Imaging 0.22 1 39.14% Referrals 0.09 2 73.64% - Referral Management 0.08 - 40.01% - Referral Request - - 33.63% Note. EMR = Electronic Medical Record; Overall α = 0.88. Demographics questions: About you. There were five questions in the personal demographics section that assessed role or position in the clinic, tenure or length of time working at the clinic, age, and gender. These questions provided some context to the responses and allowed comparisons to be made within the data. Demographics questions: About your clinic. There were eight questions in the clinic demographics section that assessed different aspects of the clinic environment. A few examples were “In which zone is your clinic located,” “Which EMR does your clinic use,” and “Is your clinic part of a Primary Care Network?” These questions allowed potential correlations to be drawn between health care zones, between EMR systems, and