SlideShare una empresa de Scribd logo
1 de 11
Descargar para leer sin conexión
PROPERTY BAROMETER
FNB House Price Index
The FNB House Price Index’s year-on-year growth
slowed in January, after prior months of acceleration
In January 2018, the FNB House Price Index showed a slowing in year-on-
year growth compared with the revised December 2017 rate. This comes
after some prior months of accelerating year-on-year growth.
This keeps the index year-on-year growth rate in lower single digit territory
at 4.7%. However, we remain of the expectation that mildly improved
national sentiment early in 2018, along with the expectation of stable
interest rates this year and improved economic growth, could see stronger
average house price growth in 2018 compared with 2017’s average rate.
KEY POINTS
• The FNB House Price Index for January 2017 rose by 4.7% year-on-year.
This is a mild slowing on the revised 5.1% rate recorded for December 2017,
after some prior months of growth acceleration.
• Examining house price growth on a month-on-month seasonally-adjusted
basis, we see that, after a broad sideways movement in this growth rate
during the 2nd
half of 2017, there was a noticeable slowing from December to
January, from 0.28% in December to 0.12% in January..
• In real terms, when adjusting for CPI (Consumer Price Index) inflation, the
rate of house price growth was slightly positive to the tune of +0.4% year-on-
year in December 2017 (January 2018 CPI data not yet available), after a
revised +0.5% in November.
• The incidence of house price deflation on resales of homes has diminished
in recent months to a lowly 8.6% of total home resales in December, from
11.5% at the start of 2017.
1 February 2018
MARKET ANALYTICS AND
SCENARIO FORECASTING UNIT
JOHN LOOS:
HOUSEHOLD AND PROPERTY
SECTOR STRATEGIST
087-328 0151
john.loos@fnb.co.za
THULANI LUVUNO:
STATISTICIAN
087-730 2254
thulani.luvuno@fnb.co.za
The information in this publication is
derived from sources which are regarded as
accurate and reliable, is of a general nature
only, does not constitute advice and may
not be applicable to all circumstances.
Detailed advice should be obtained in
individual cases. No responsibility for any
error, omission or loss sustained by any
person acting or refraining from acting as a
result of this publication is accepted by
Firstrand Group Limited and / or the
authors of the material.
First National Bank – a division of FirstRand Bank
Limited. An Authorised Financial Services
provider. Reg No. 1929/001225/06
JANUARY FNB HOUSE PRICE INDEX FINDINGS
JANUARY AVERAGE HOUSE PRICE GROWTH
The FNB House Price Index for January 2018
showed a renewed deceleration, from a revised
5.1% in the previous month to 4.7% year-on-
year. This mild deceleration comes after a
gradual acceleration in year-on-year house price
growth through much of 2017.
In real terms, when adjusting for CPI (Consumer
Price Index) inflation, the rate of house price
growth was in mild positive territory, having
recorded a +0.4% year-on-year rise in December
2017 (January CPI data not yet available), slightly
slower than the 0.5% rate in November.
This slight slowing in revised real price growth
from November to December was due to an unchanged 5.1% revised nominal house price growth rate in December
(compared to November), while CPI inflation accelerated slightly from 4.6% year-on-year in November to 4.7% in
December.
The average price of homes transacted in January was R1,116,444.
MONTH-ON-MONTH HOUSE PRICE GROWTH SLOWED IN JANUARY
Examining house price growth on a month-on-
month seasonally-adjusted basis (a better
recent momentum indicator than the year-on-
year calculation) suggests that, while certain
leading business cycle indicators point to near
term economic improvement, we may not quite
be there yet.
The Housing Market can often be a good leading
indicator of economic conditions. Our revised
month-on-month house price growth rate
showed a broad sideways movement in growth
during the 2nd
half of 2017, but the January rate
slowed noticeably from 0.28% in December to
0.12%.
The previous 4 noticeable “dips” in the Manufacturing Purchasing Managers’ Index (PMI), also a useful leading
indicator of broader economy’s direction, have broadly correlated with the timing of the seasonally adjusted
month-on-month dips in house price growth. It thus now remains to be seen whether this latest slowing in month-
on-month house price growth will go further, given that the Manufacturing PMI has been very week in recent
months. Therefore, although sentiment in the country appears to be improved early in 2018, and we are more
upbeat regarding economic prospects for 2018, as yet the housing market is showing no strong indication of
strengthening.
FNB HOUSE PRICE GROWTH IN FOREIGN CURRENCY TERMS
WHAT HOUSE PRICE GROWTH RATES ARE ASPIRANT FOREIGN BUYERS OF DOMESTIC PROPERTY SEEING?
The recent Rand strengthening, especially
following the change of leadership at the ruling
party’s December 2017 elective conference,
begins to show up in the January FNB House
Price Index when denominated in certain major
foreign currencies.
The Euro-denominated FNB House Price Index
saw a year-on-year growth acceleration from
-2.19% deflation in December to +1.03% in
January, while the UK Pound-denominated
Index accelerated further from +2.4% year-on-
year in December to 3.8% in January. But the
major global currency news last year was a
significant US Dollar weakening, the result being seen in a strong +15.89% year-on-year growth rate in the US Dollar-
denominated FNB House Price Index.
Recent Rand strength has thus started to lift the prices of domestic property for aspirant foreign buyers from certain
key economies, especially those who operate in Dollars, given the added impact of Dollar weakness.
LONGER TERM REAL HOUSE PRICE PERFORMANCE
REAL HOUSE PRICE LEVELS
Examining the longer term real house price
trends (house prices adjusted for CPI inflation),
despite recent months of slight positive real
house price growth, we see that the level as at
December 2017 had lost -4.1% since a post-
2008/9 recession high in December 2015.
Looking a bit further back to the all-time real
house price peak at the end of 2007 (at the end
of the pre-2008 housing boom period), on a
cumulative basis real house prices were -19.2%
down on that high as at December 2017.
However, looking back further, despite a
mediocre performance in recent years, the
average real price currently remains a massive 63.8% above the end-2000 level, 17 years ago, and a time back just
before boom-time price inflation started to accelerate rapidly. We therefore still regard current real price levels as
high by historic standards.
In nominal terms, when not adjusting for CPI inflation, the average house price in January 2018 was 323.3% above
the end-2000 level. By comparison, consumer goods and services prices, as measured by the CPI, were only 158.2%
higher over virtually the same period (up to December 2017 due to January CPI data not yet available).
THE EXTENT OF HOUSE PRICE DEFLATION IN THE MARKET
HOW PREVALENT IS HOME RE-SALES PRICE DEFLATION?
We also analyse house prices in order to view the magnitude of house price resales deflation vs inflation in the
housing market. At any given time, there is always a certain amount of resales deflation within the overall market.
By this we mean homes being resold at prices below that which they were previously purchased for.
In such times like the present when the market is weak and average house price inflation is low, it would be realistic
perhaps to expect a higher percentage of homes being resold at deflated prices, and vice versa in stronger market
times.
The causes of price deflation when reselling can vary:
• Genuine market price deflation can be the cause in weak economic or rising interest rate times, such as in
2008/9, or a specific area can fall from favour and even go into decay.
• A home may have originally been purchased at an “incorrectly” high price which was above the true market
value at the time. Establishing the true market price is tough in a market where each home’s characteristics
differs in some way from the next.
• Financial stress of the owner can lead to a deterioration in the property due to lack of maintenance and
upkeep., or can cause a very hasty sale at below “market value”.
We use deeds data for properties purchased and sold by individuals (“Natural persons”) for these estimates.
The incidence of re-sales price deflation remains
moderate, and the overall incidence of such
price deflation expressed as a percentage of
total sales has declined in recent months.
From 10.7% of total sales as at September 2017,
the estimated level of resale price deflation
declined to 8.6% by December (having started
2017 at a higher 11.5%)
Therefore, the incidence of resale price deflation
lessened broadly speaking through 2017, which
perhaps reflects that slight acceleration through
2017 in the year-on-year growth rate in the FNB
House Price Index.
The December level of 8.6% remains very low compared to the 23.4% “peak-of-crisis” level of September 2009.
We delve a bit deeper, however, into the various “bands” of resale price deflation/inflation.
In order to do this, we smooth the individual
price inflation/deflation “bands” that we have
created, by using 6-month moving averages.
Firstly, what we see is that the percentage of
homes being resold for “10% or more” above
purchase price has begun to decline slightly,
from a post-2008/9 recession high of 78.1% for
the 6 months to June 2016 to 77.1% for the 6
months to December 2017.
Homes resold at 5-10% above purchase price
have also seen a very small decrease as a
percentage of total in 2017, from a high of 6.6%
for the 6 months to February 2017 to 6.3% for
the 6 months to December 2017.
There has by contrast, been a noticeable increase in the percentage of homes resold at 0-5% above original
purchase price, from 5.6% of total sales for the 6 months to January 2017, to 6.7% for the 6 months to December
2017.
This translates into a small decline in both
categories of resales price deflation over 2017.
From 8.5% of total sales for the 6 months to
January 2017, homes resold between 0% and
95% of previous purchase price declined to 8%
of total sales for the 6 months to December
2017, while those reselling at 0%-5% below
previous purchase price declined from 2.1% of
total sales for the 6 months to January 2017 to
1.9% for the 6 months to December.
Therefore, in 2007, we did not see any signs of
increase in the incidence of resales price
deflation, despite low average house price
growth.
To the contrary, some mild improvement (diminishing in the incidence of resales deflation) actually took place.
CONCLUSION
A mild slowing in year-on-year house price growth at the start of 2018, we believe, is not yet reflective of certain
positive economic developments which appear to be taking place. Economic growth had already emerged from last
summer’s recession in the winter quarters of 2017, and the Leading Business Cycle Indicators of both the SARB and
OECD have been pointing to possibly improved economic growth in the near term.
In addition, the change in leadership in the ruling party in December appears to have been seen in a positive light
by many, assisting in a significant improvement in investor sentiment and indeed the Rand of late.
We would anticipate that a significantly improved national mood, along with signs of strong economic growth to
come, which would in turn support better employment and Household Disposable Income growth, should lead to
some strengthening in residential demand and mildly stronger average house price growth this year.
The stronger Rand, should it be sustained, also has implications for inflation (lowering imported goods prices), and
is supportive of our FNB expectation of either sideways movement in interest rates through 2018, or even a possible
interest rate cut.
The FNB forecast for interest rates is for an unchanged Repo and Prime Rate through 2018, Prime expected to
remain at 10.25%.
For economic growth, after an estimated 0.9% in 2017, the forecast is for a slightly higher 1.5% in 2018.
These forecasts, coupled with a more positive sentiment in the country, which we believe will feed into Consumer
Confidence levels too, are expected to strengthen the housing market mildly in 2018, producing average house
price growth in the 5-6% range for the year as a whole, compared to a revised 3.8% for 2017 as a whole.
KEY RATIOS DERIVED FROM THE FNB HOUSE PRICE INDEX
HOUSE PRICE BOND INSTALMENT TREND
In such a credit dependent market, it is
important to understand what the rate of
change in the monthly bond instalment is, given
changes in both house prices and mortgage
lending rates.
Using a Prime Rate series, along with Mortgage
Originator Ooba’s time series for Mortgage
Loans’ Average Differential from Prime, we
calculate an “average mortgage lending rate and
apply it to our average house price series to
obtain an average monthly bond instalment
estimate on a new 100% bond.
The stalling in interest rate hiking since early-
2016, and then a subsequent lone interest rate cut in July 2017, has led to a slow year-on-year rate of increase in
the average priced home instalment value of late, to the tune of 1.9% in January 2018, having slowed all the way
from a high of 17.5% year-on-year in April 2016.
In real terms, adjusting for CPI inflation, the December 2017 bond instalment rate of change was in decline to the
tune of -2.3% (January CPI data not yet available).
The rate of increase in this new bond instalment on the average priced house is also likely to have been slower than
the average wage or disposable income inflation rate, thus likely translating into improvement in national average
bonded home affordability.
PRICE-RENT RATIO
The Price-Rent Ratio is one important ratio in determining how costly the home buying option is relative to the
competing option, i.e rental.
Analysts often become concerned when the
Price-Rent Ratio is very high, as it can begin to
make the rental option very appealing,
contributing at some stage into a drop in home
buying and a fall in house prices.
House price booms, or strong market periods at
least, typically take this ratio higher.
To this effect, we use the FNB House Price Index
and the CPI for Actual rentals to monitor this
ratio. We show it in index form (because the CPI
is an index), with January 2008=100.
Through 2016 and 2017, some gradual progress in lowering this Price-Rent Ratio has been made.
From a multi-year high of 88.1 reached in February 2016, we have seen a gradual decline in the index to 84.86 by
December 2017, a -3.7% decline. This reflects a period in which average house price growth has mildly
underperformed rental inflation (as per StatsSA CPI Rental estimates). The Price-Rent Ratio Index is now -15.14%
down on January 2008, which reflects a significant cumulative correction to date since the end of the pre-2008
housing market bubble.
The other important ratio, i.e. the Instalment on a 100% bond on the average-priced house/Rent Ratio Index, is
significantly lower than the Price-Rent Ratio Index (when using January 2008 as the base month), at a level of 71.88
as at December 2017. This is due to the added downward pressure from interest rates having been kept far lower
than 2008 levels, Prime rate having peaked at 15.5% in mid-2008, and today being at only 10.25%. Low interest
rates in recent years have thus assisted in keeping the home buying option significantly more attractive relative to
the rental option compared to what was the case in 2008, despite some mild rate hiking between 2014 and 2016.
REAL ALTERNATIVE PRIME RATE AND POTENTIAL FOR A SPECULATORS’ MARKET
In order to create a “speculator’s paradise” in residential property, it is important to have price growth at a
percentage significantly faster than the percentage of the annual interest rate charged on a mortgage loan.
Such an environment could give rise to widespread use of cheap credit to buy and sell properties in a relatively
short space of time and make big capital gains. 2004-5 was such a speculator’s paradise.
To monitor this, we calculate a simple
“Alternative Real Prime Rate”, which adjusts
Prime Rate to real terms using average house
price inflation instead of the usual CPI inflation
rate approach.
For a healthy market with low levels of
speculation, we believe that this real rate should
remain positive. Indeed, that was still very much
the case in January 2018, where the Real
Alternative Prime Rate was still a strongly
positive 6.56%.
We thus believe the SARB’s monetary policy
stance to be appropriate from a residential
market health point of view.
WHAT FNB’S ALTERNATIVE HOUSE PRICE INDEX MEASURES SAY
Given that house price statistics and indices are never an exact science, we often like to test our main house price
index against our alternative house price index methodologies. Of late, 4 of the 5 of the monthly FNB National
House Price Indices point to single-digit house price growth below 5%, and 4 out of 5 saw slower year-on-year
growth in January compared with December 2017.
Whereas we term our main house price index a
“stratified mean”, where sub-segments of the
index are averages with their weights fixed in the
overall index, our FNB Stratified Median House
Price Index is the average of the sub-segments’
median prices. The Stratified Median House
Price Index showed slightly slower (than the
“official” index) house price growth of 3.3% in
January, while our FNB Repeat Sales House Price
Index showed 1.4% growth.
The other 2 indices, i.e. the “Simple” (i.e.
unweighted) Mean and “Simple” Median indices
showed 6.1% and 5.5% year-on-year growth
respectively, The “Simple” Mean Index is thus
the only one showing higher than 5% price
growth, while the “Simple” Median Index is the
only one to have seen slight acceleration in year-
on-year growth from the prior month.
ADDENDUM - NOTES:
Note on The FNB Average House Price Index: Although also working on the average price principle (as opposed
to median or repeat sales), the FNB House Price Index differs from a simple average house price index in that
it could probably be termed a “fixed weight” average house price index.
One of the practical problems we have found with house price indices is that relative short term activity shifts
up and down the price ladder can lead to an average or median price index rising or declining where there was
not necessarily “genuine” capital growth on homes. For example, if “Full Title 3 Bedroom volumes remain
unchanged from one month to the next, but Sectional Title 1 Bedroom and Less (the cheapest segment on
average) transaction volumes hypothetically double, the overall national average price could conceivably
decline due to this relative activity shift.
This challenge of activity shifts between segments is faced by all constructors of house price indices. In an
attempt to reduce this effect, we decided to fix the weightings of the FNB House Price Index’s sub-segments
in the overall national index. This, at best, can only be a partial solution, as activity shifts can still take place
between smaller segments within the sub-segments. However, it does improve the situation.
With our 2013 re-weighting exercise, we have begun to segment not only according to room number, but also
to segment according to building size within the normal segments by room number, in order to further reduce
the impact of activity shifts on average price estimates.
The FNB House Price Index’s main segments are now as follows:
• The weightings of the sub-segments are determined by their relative transaction volumes over the past 5
years, and will now change very slowly over time by applying a 5-year moving average to each new price data
point. The sub-segments are:
- Sectional Title:
• Less than 2 bedroom – Large
• Less than 2 bedroom – Medium
• Less than 2 bedroom – Small
• 2 Bedroom – Large
• 2 bedroom – Medium
• 2 bedroom – Small
• 3 Bedroom and More - Large
• 3 Bedroom and More - Medium
• 3 Bedroom and More - Small
- Full Title:
• 2 Bedrooms and Less - Large
• 2 Bedrooms and Less - Medium
• 2 Bedrooms and Less - Small
• 3 Bedroom - Large
• 3 Bedroom - Medium
• 3 Bedroom - Small
• 4 Bedrooms and More - Large
• 4 Bedrooms and More - Medium
• 4 Bedrooms and More – Small
The size cut-offs for “small”, medium” and “large” differ per room number sub-segment. “Large” would refer
to the largest one-third of homes within a particular room number segment over the past 5 year period,
“Medium” to the middle one-third, and “Small” to the smallest one-third of homes within that segment.
• The Index is constructed using transaction price data from homes financed by FNB.
• The minimum size cut-off for full title stands is 200 square metres, and the maximum size is 4000 square
metres
• The maximum price cut-off is R10m, and the lower price cut-off is R20,000 (largely to eliminate major
outliers and glaring inputting errors).
• The index is very lightly smoothed using a Hodrick-Prescott smoothing function with a Lambda of 5.
A WORD OF CAUTION: Caution should be exercised when using the FNB House Price Index for any type of
home “valuation” exercise. A simplistic approach sometimes used to acquiring a rough valuation for a
residential property, which may last have been transacted a number of years ago, is to take its previous
transaction value and date, and to apply the cumulative inflation rate of the House Price Index to that price to
ascertain what its value should be at the present time.
This approach can be hazardous for 3 reasons:
• Firstly, the area in which that home is located may not have seen its average price inflation being the
same as the national average (with the FNB House Price Index merely being a national average)
• Secondly, the home being “valued” may have changed in characteristics or condition since it was last
transacted, causing its own value growth to be out of line with the market.
• Thirdly, if the home owner had bought the home previously at a value that was not market related
(and getting the price “right” will always be an inexact science because each home is different from
the next), when applying an average price index to update that valuation to the present day, one
would be starting from an incorrect price base (at time of transaction), thus sustaining the “error”.

Más contenido relacionado

La actualidad más candente

Research Brief: Federal Reserve // March 2017
Research Brief: Federal Reserve // March 2017Research Brief: Federal Reserve // March 2017
Research Brief: Federal Reserve // March 2017Nicole Wesley-Smith
 
The Provinces Reset Their Budget Paths
The Provinces Reset Their Budget PathsThe Provinces Reset Their Budget Paths
The Provinces Reset Their Budget PathsEmily Jackson
 
Market Report: MSA Market Detail - Single Family - 3rd Quarter 2017
Market Report: MSA Market Detail - Single Family - 3rd Quarter 2017Market Report: MSA Market Detail - Single Family - 3rd Quarter 2017
Market Report: MSA Market Detail - Single Family - 3rd Quarter 2017Al Graham
 
Selling your House Winter 2017
Selling your House Winter 2017Selling your House Winter 2017
Selling your House Winter 2017JESSICA EVE MORGAN
 
Selling Your House Winter 2017
Selling Your House Winter 2017Selling Your House Winter 2017
Selling Your House Winter 2017JESSICA EVE MORGAN
 
FNB Estate Agents Survey_Buy-to-Let
FNB Estate Agents Survey_Buy-to-LetFNB Estate Agents Survey_Buy-to-Let
FNB Estate Agents Survey_Buy-to-LetBerty Van Staaden
 
U.S. House Prices Rose 1.9 Percent in First Quarter 2013
U.S. House Prices Rose 1.9 Percent in First Quarter 2013U.S. House Prices Rose 1.9 Percent in First Quarter 2013
U.S. House Prices Rose 1.9 Percent in First Quarter 2013Wealth Partners
 
Market Takes a Breather - The Real Estate Report July/August
Market Takes a Breather -  The Real Estate Report July/AugustMarket Takes a Breather -  The Real Estate Report July/August
Market Takes a Breather - The Real Estate Report July/AugustAMSI, San Francisco
 

La actualidad más candente (17)

Research Brief: Federal Reserve // March 2017
Research Brief: Federal Reserve // March 2017Research Brief: Federal Reserve // March 2017
Research Brief: Federal Reserve // March 2017
 
FNB_Western Cape
FNB_Western CapeFNB_Western Cape
FNB_Western Cape
 
The Provinces Reset Their Budget Paths
The Provinces Reset Their Budget PathsThe Provinces Reset Their Budget Paths
The Provinces Reset Their Budget Paths
 
July 2013 Barrington Area Market Report
July 2013 Barrington Area Market ReportJuly 2013 Barrington Area Market Report
July 2013 Barrington Area Market Report
 
Market Summary Southgate Sarasota August 2016
Market Summary Southgate Sarasota August 2016Market Summary Southgate Sarasota August 2016
Market Summary Southgate Sarasota August 2016
 
Money printing
Money printingMoney printing
Money printing
 
Market Report: MSA Market Detail - Single Family - 3rd Quarter 2017
Market Report: MSA Market Detail - Single Family - 3rd Quarter 2017Market Report: MSA Market Detail - Single Family - 3rd Quarter 2017
Market Report: MSA Market Detail - Single Family - 3rd Quarter 2017
 
Selling your house - winter 2016
Selling your house - winter 2016Selling your house - winter 2016
Selling your house - winter 2016
 
Selling your House Winter 2017
Selling your House Winter 2017Selling your House Winter 2017
Selling your House Winter 2017
 
Selling Your House Winter 2017
Selling Your House Winter 2017Selling Your House Winter 2017
Selling Your House Winter 2017
 
Selling Your House Winter 2017
Selling Your House Winter 2017Selling Your House Winter 2017
Selling Your House Winter 2017
 
Market Summary Laurel Oak July 2016
Market Summary Laurel Oak July 2016Market Summary Laurel Oak July 2016
Market Summary Laurel Oak July 2016
 
June 2013 Barrington Market Report
June 2013 Barrington Market ReportJune 2013 Barrington Market Report
June 2013 Barrington Market Report
 
FNB Estate Agents Survey_Buy-to-Let
FNB Estate Agents Survey_Buy-to-LetFNB Estate Agents Survey_Buy-to-Let
FNB Estate Agents Survey_Buy-to-Let
 
U.S. House Prices Rose 1.9 Percent in First Quarter 2013
U.S. House Prices Rose 1.9 Percent in First Quarter 2013U.S. House Prices Rose 1.9 Percent in First Quarter 2013
U.S. House Prices Rose 1.9 Percent in First Quarter 2013
 
Market Takes a Breather - The Real Estate Report July/August
Market Takes a Breather -  The Real Estate Report July/AugustMarket Takes a Breather -  The Real Estate Report July/August
Market Takes a Breather - The Real Estate Report July/August
 
Q3_2016_QER_short_version_clients-MikeSchwartz
Q3_2016_QER_short_version_clients-MikeSchwartzQ3_2016_QER_short_version_clients-MikeSchwartz
Q3_2016_QER_short_version_clients-MikeSchwartz
 

Similar a FNB_House Price Index_January 2018

FNB House Price Index_Sept 2017
FNB House Price Index_Sept 2017FNB House Price Index_Sept 2017
FNB House Price Index_Sept 2017Berty Van Staaden
 
FNB Residential Property Monthly March
FNB Residential Property Monthly MarchFNB Residential Property Monthly March
FNB Residential Property Monthly MarchBerty Van Staaden
 
FNB_House Price Index_Nov 2017
FNB_House Price Index_Nov 2017FNB_House Price Index_Nov 2017
FNB_House Price Index_Nov 2017Berty Van Staaden
 
FNB_Residential Maintenance and Upgrades
FNB_Residential Maintenance and UpgradesFNB_Residential Maintenance and Upgrades
FNB_Residential Maintenance and UpgradesBerty Van Staaden
 
FNB_AREA VALUE BAND HOUSE PRICE INDEX
FNB_AREA VALUE BAND HOUSE PRICE INDEXFNB_AREA VALUE BAND HOUSE PRICE INDEX
FNB_AREA VALUE BAND HOUSE PRICE INDEXBerty Van Staaden
 
FNB_Emigration-Related Home Selling
FNB_Emigration-Related Home SellingFNB_Emigration-Related Home Selling
FNB_Emigration-Related Home SellingBerty Van Staaden
 
Td Economics Resale Housing Report October 2011
Td Economics Resale Housing Report October 2011Td Economics Resale Housing Report October 2011
Td Economics Resale Housing Report October 2011Matt Collinge
 
FNB_Provincial and Major Metro House Price Indices
FNB_Provincial and Major Metro House Price IndicesFNB_Provincial and Major Metro House Price Indices
FNB_Provincial and Major Metro House Price IndicesBerty Van Staaden
 
Home Price Monitor: June 2011
Home Price Monitor: June 2011Home Price Monitor: June 2011
Home Price Monitor: June 2011REALTORS
 
Home Price Monitor: July 2011
Home Price Monitor: July 2011Home Price Monitor: July 2011
Home Price Monitor: July 2011REALTORS
 
Home Price Monitor: September 2011
Home Price Monitor: September 2011Home Price Monitor: September 2011
Home Price Monitor: September 2011REALTORS
 
Real Estate Trends January 2009
Real Estate Trends January 2009Real Estate Trends January 2009
Real Estate Trends January 2009gpappa
 
Home Price Monitor: May 2011
Home Price Monitor: May 2011Home Price Monitor: May 2011
Home Price Monitor: May 2011REALTORS
 
Things to Consider When Selling Your House - Fall 2022 Edition
Things to Consider When Selling Your House - Fall 2022 EditionThings to Consider When Selling Your House - Fall 2022 Edition
Things to Consider When Selling Your House - Fall 2022 EditionTom Blefko
 
FNB_Residential Demand Conditions_1st Time Home Buying
FNB_Residential Demand Conditions_1st Time Home BuyingFNB_Residential Demand Conditions_1st Time Home Buying
FNB_Residential Demand Conditions_1st Time Home BuyingBerty Van Staaden
 

Similar a FNB_House Price Index_January 2018 (20)

FNB House Price Index_Sept 2017
FNB House Price Index_Sept 2017FNB House Price Index_Sept 2017
FNB House Price Index_Sept 2017
 
FNB Residential Property Monthly March
FNB Residential Property Monthly MarchFNB Residential Property Monthly March
FNB Residential Property Monthly March
 
FNB_House Price Index
FNB_House Price IndexFNB_House Price Index
FNB_House Price Index
 
FNB_House Price Index_Nov 2017
FNB_House Price Index_Nov 2017FNB_House Price Index_Nov 2017
FNB_House Price Index_Nov 2017
 
FNB_Estate Agent Survey
FNB_Estate Agent SurveyFNB_Estate Agent Survey
FNB_Estate Agent Survey
 
FNB_Secondary Home Buying
FNB_Secondary Home BuyingFNB_Secondary Home Buying
FNB_Secondary Home Buying
 
FNB_Residential Maintenance and Upgrades
FNB_Residential Maintenance and UpgradesFNB_Residential Maintenance and Upgrades
FNB_Residential Maintenance and Upgrades
 
FNB_AREA VALUE BAND HOUSE PRICE INDEX
FNB_AREA VALUE BAND HOUSE PRICE INDEXFNB_AREA VALUE BAND HOUSE PRICE INDEX
FNB_AREA VALUE BAND HOUSE PRICE INDEX
 
FNB_Emigration-Related Home Selling
FNB_Emigration-Related Home SellingFNB_Emigration-Related Home Selling
FNB_Emigration-Related Home Selling
 
Td Economics Resale Housing Report October 2011
Td Economics Resale Housing Report October 2011Td Economics Resale Housing Report October 2011
Td Economics Resale Housing Report October 2011
 
FNB_Provincial and Major Metro House Price Indices
FNB_Provincial and Major Metro House Price IndicesFNB_Provincial and Major Metro House Price Indices
FNB_Provincial and Major Metro House Price Indices
 
Home Price Monitor: June 2011
Home Price Monitor: June 2011Home Price Monitor: June 2011
Home Price Monitor: June 2011
 
Home Price Monitor: July 2011
Home Price Monitor: July 2011Home Price Monitor: July 2011
Home Price Monitor: July 2011
 
Home Price Monitor: September 2011
Home Price Monitor: September 2011Home Price Monitor: September 2011
Home Price Monitor: September 2011
 
Real Estate Trends January 2009
Real Estate Trends January 2009Real Estate Trends January 2009
Real Estate Trends January 2009
 
Newsletter dec 2010t
Newsletter dec 2010tNewsletter dec 2010t
Newsletter dec 2010t
 
Home Price Monitor: May 2011
Home Price Monitor: May 2011Home Price Monitor: May 2011
Home Price Monitor: May 2011
 
Luxury Market Report NorthAmerica DEC'23
Luxury Market Report NorthAmerica DEC'23Luxury Market Report NorthAmerica DEC'23
Luxury Market Report NorthAmerica DEC'23
 
Things to Consider When Selling Your House - Fall 2022 Edition
Things to Consider When Selling Your House - Fall 2022 EditionThings to Consider When Selling Your House - Fall 2022 Edition
Things to Consider When Selling Your House - Fall 2022 Edition
 
FNB_Residential Demand Conditions_1st Time Home Buying
FNB_Residential Demand Conditions_1st Time Home BuyingFNB_Residential Demand Conditions_1st Time Home Buying
FNB_Residential Demand Conditions_1st Time Home Buying
 

Más de Berty Van Staaden

FNB_Property Barometer - September
FNB_Property Barometer - SeptemberFNB_Property Barometer - September
FNB_Property Barometer - SeptemberBerty Van Staaden
 
Lightstone House Price Index_August 2019
Lightstone House Price Index_August 2019Lightstone House Price Index_August 2019
Lightstone House Price Index_August 2019Berty Van Staaden
 
FNB_Gauteng House Price Index
FNB_Gauteng House Price IndexFNB_Gauteng House Price Index
FNB_Gauteng House Price IndexBerty Van Staaden
 
FNB Property Insights SARB Leading Indicator_August 2019
FNB Property Insights SARB Leading Indicator_August 2019FNB Property Insights SARB Leading Indicator_August 2019
FNB Property Insights SARB Leading Indicator_August 2019Berty Van Staaden
 
PayProp Rental Index Q2 2019
PayProp Rental Index Q2 2019PayProp Rental Index Q2 2019
PayProp Rental Index Q2 2019Berty Van Staaden
 
FNB Residential Building Stats_Q2 2019
FNB Residential Building Stats_Q2 2019FNB Residential Building Stats_Q2 2019
FNB Residential Building Stats_Q2 2019Berty Van Staaden
 
FNB Property Insights August 2019
FNB Property Insights August 2019FNB Property Insights August 2019
FNB Property Insights August 2019Berty Van Staaden
 
FNB Property Barometer (CPTt)_Aug 2019
FNB Property Barometer (CPTt)_Aug 2019FNB Property Barometer (CPTt)_Aug 2019
FNB Property Barometer (CPTt)_Aug 2019Berty Van Staaden
 
FNB_Property Insights_Retail Property's Consumer Challenges
FNB_Property Insights_Retail Property's Consumer ChallengesFNB_Property Insights_Retail Property's Consumer Challenges
FNB_Property Insights_Retail Property's Consumer ChallengesBerty Van Staaden
 
Lightstone_Residential Property Indices_July 2019
Lightstone_Residential Property Indices_July 2019Lightstone_Residential Property Indices_July 2019
Lightstone_Residential Property Indices_July 2019Berty Van Staaden
 
FNB Market Activity Ratings_July 2019
FNB Market Activity Ratings_July 2019FNB Market Activity Ratings_July 2019
FNB Market Activity Ratings_July 2019Berty Van Staaden
 
FNB May Building Statistics (Jul 2019)
FNB May Building Statistics (Jul 2019)FNB May Building Statistics (Jul 2019)
FNB May Building Statistics (Jul 2019)Berty Van Staaden
 
FNB Estate Agents Survey_Net Foreign Effect
FNB Estate Agents Survey_Net Foreign EffectFNB Estate Agents Survey_Net Foreign Effect
FNB Estate Agents Survey_Net Foreign EffectBerty Van Staaden
 
Lightstone_Residential Property Indices May 2019
Lightstone_Residential Property Indices May 2019Lightstone_Residential Property Indices May 2019
Lightstone_Residential Property Indices May 2019Berty Van Staaden
 
PayProp Rental Index Q 1 2019
PayProp Rental Index Q 1 2019PayProp Rental Index Q 1 2019
PayProp Rental Index Q 1 2019Berty Van Staaden
 
FNB Residential Property Barometer_February 2019
FNB Residential Property Barometer_February 2019FNB Residential Property Barometer_February 2019
FNB Residential Property Barometer_February 2019Berty Van Staaden
 
Lightstone Property Forecast for 2019
Lightstone Property Forecast for 2019Lightstone Property Forecast for 2019
Lightstone Property Forecast for 2019Berty Van Staaden
 
Lightstone_Residential Property Indices_January 2019
Lightstone_Residential Property Indices_January 2019Lightstone_Residential Property Indices_January 2019
Lightstone_Residential Property Indices_January 2019Berty Van Staaden
 

Más de Berty Van Staaden (20)

FNB_Property Barometer - September
FNB_Property Barometer - SeptemberFNB_Property Barometer - September
FNB_Property Barometer - September
 
Lightstone House Price Index_August 2019
Lightstone House Price Index_August 2019Lightstone House Price Index_August 2019
Lightstone House Price Index_August 2019
 
FNB_Gauteng House Price Index
FNB_Gauteng House Price IndexFNB_Gauteng House Price Index
FNB_Gauteng House Price Index
 
FNB Property Insights SARB Leading Indicator_August 2019
FNB Property Insights SARB Leading Indicator_August 2019FNB Property Insights SARB Leading Indicator_August 2019
FNB Property Insights SARB Leading Indicator_August 2019
 
PayProp Rental Index Q2 2019
PayProp Rental Index Q2 2019PayProp Rental Index Q2 2019
PayProp Rental Index Q2 2019
 
FNB Residential Building Stats_Q2 2019
FNB Residential Building Stats_Q2 2019FNB Residential Building Stats_Q2 2019
FNB Residential Building Stats_Q2 2019
 
FNB Property Insights August 2019
FNB Property Insights August 2019FNB Property Insights August 2019
FNB Property Insights August 2019
 
FNB Property Barometer (CPTt)_Aug 2019
FNB Property Barometer (CPTt)_Aug 2019FNB Property Barometer (CPTt)_Aug 2019
FNB Property Barometer (CPTt)_Aug 2019
 
FNB_Property Insights_Retail Property's Consumer Challenges
FNB_Property Insights_Retail Property's Consumer ChallengesFNB_Property Insights_Retail Property's Consumer Challenges
FNB_Property Insights_Retail Property's Consumer Challenges
 
Lightstone_Residential Property Indices_July 2019
Lightstone_Residential Property Indices_July 2019Lightstone_Residential Property Indices_July 2019
Lightstone_Residential Property Indices_July 2019
 
FNB_Rental Market
FNB_Rental MarketFNB_Rental Market
FNB_Rental Market
 
FNB Market Activity Ratings_July 2019
FNB Market Activity Ratings_July 2019FNB Market Activity Ratings_July 2019
FNB Market Activity Ratings_July 2019
 
FNB May Building Statistics (Jul 2019)
FNB May Building Statistics (Jul 2019)FNB May Building Statistics (Jul 2019)
FNB May Building Statistics (Jul 2019)
 
FNB Estate Agents Survey_Net Foreign Effect
FNB Estate Agents Survey_Net Foreign EffectFNB Estate Agents Survey_Net Foreign Effect
FNB Estate Agents Survey_Net Foreign Effect
 
Lightstone_Residential Property Indices May 2019
Lightstone_Residential Property Indices May 2019Lightstone_Residential Property Indices May 2019
Lightstone_Residential Property Indices May 2019
 
PayProp Rental Index Q 1 2019
PayProp Rental Index Q 1 2019PayProp Rental Index Q 1 2019
PayProp Rental Index Q 1 2019
 
FNB Residential Property Barometer_February 2019
FNB Residential Property Barometer_February 2019FNB Residential Property Barometer_February 2019
FNB Residential Property Barometer_February 2019
 
Lightstone Property Forecast for 2019
Lightstone Property Forecast for 2019Lightstone Property Forecast for 2019
Lightstone Property Forecast for 2019
 
Lightstone_Residential Property Indices_January 2019
Lightstone_Residential Property Indices_January 2019Lightstone_Residential Property Indices_January 2019
Lightstone_Residential Property Indices_January 2019
 
TPN_Vacancy Survey_Q3 2018
TPN_Vacancy Survey_Q3 2018TPN_Vacancy Survey_Q3 2018
TPN_Vacancy Survey_Q3 2018
 

Último

Acibadem Konaklari Uskudar - Listin Turkey
Acibadem Konaklari Uskudar - Listin TurkeyAcibadem Konaklari Uskudar - Listin Turkey
Acibadem Konaklari Uskudar - Listin TurkeyListing Turkey
 
TENANT SCREENING REPORT SERVICES​ How Tenant Screening Reports Work
TENANT SCREENING REPORT SERVICES​ How Tenant Screening Reports WorkTENANT SCREENING REPORT SERVICES​ How Tenant Screening Reports Work
TENANT SCREENING REPORT SERVICES​ How Tenant Screening Reports WorkTurbo Tenant
 
Bptp The Amaario Launch Luxury Project Sector 37D Gurgaon Dwarka Expressway...
Bptp The Amaario Launch  Luxury Project  Sector 37D Gurgaon Dwarka Expressway...Bptp The Amaario Launch  Luxury Project  Sector 37D Gurgaon Dwarka Expressway...
Bptp The Amaario Launch Luxury Project Sector 37D Gurgaon Dwarka Expressway...ApartmentWala1
 
9990771857 Call Girls Dwarka Sector 9 Delhi (Call Girls ) Delhi
9990771857 Call Girls Dwarka Sector 9 Delhi (Call Girls ) Delhi9990771857 Call Girls Dwarka Sector 9 Delhi (Call Girls ) Delhi
9990771857 Call Girls Dwarka Sector 9 Delhi (Call Girls ) Delhidelhimodel235
 
Call Girls In Seelampur Delhi ↬8447779280}Seelampur Escorts Service In Delhi...
Call Girls In Seelampur  Delhi ↬8447779280}Seelampur Escorts Service In Delhi...Call Girls In Seelampur  Delhi ↬8447779280}Seelampur Escorts Service In Delhi...
Call Girls In Seelampur Delhi ↬8447779280}Seelampur Escorts Service In Delhi...asmaqueen5
 
Best Deal Virtual Space in Satya The Hive Tata Zudio 750 Sqft 1.89 Cr All inc...
Best Deal Virtual Space in Satya The Hive Tata Zudio 750 Sqft 1.89 Cr All inc...Best Deal Virtual Space in Satya The Hive Tata Zudio 750 Sqft 1.89 Cr All inc...
Best Deal Virtual Space in Satya The Hive Tata Zudio 750 Sqft 1.89 Cr All inc...ApartmentWala1
 
9990771857 Call Girls in Dwarka Sector 2 Delhi (Call Girls) Delhi
9990771857 Call Girls in Dwarka Sector 2 Delhi (Call Girls) Delhi9990771857 Call Girls in Dwarka Sector 2 Delhi (Call Girls) Delhi
9990771857 Call Girls in Dwarka Sector 2 Delhi (Call Girls) Delhidelhimodel235
 
2k Shot Call girls Karol Bagh Delhi 9205541914
2k Shot Call girls Karol Bagh Delhi 92055419142k Shot Call girls Karol Bagh Delhi 9205541914
2k Shot Call girls Karol Bagh Delhi 9205541914Delhi Call girls
 
The Gale at Godrej Park World Hinjewadi Pune Brochure.pdf
The Gale at Godrej Park World Hinjewadi Pune Brochure.pdfThe Gale at Godrej Park World Hinjewadi Pune Brochure.pdf
The Gale at Godrej Park World Hinjewadi Pune Brochure.pdfPrachiRudram
 
Kolte Patil Kharadi Pune E Brochure.pdf
Kolte Patil Kharadi Pune E  Brochure.pdfKolte Patil Kharadi Pune E  Brochure.pdf
Kolte Patil Kharadi Pune E Brochure.pdfabbu831446
 
Enjoy Night ≽ 8448380779 ≼ Call Girls In Iffco Chowk (Gurgaon)
Enjoy Night ≽ 8448380779 ≼ Call Girls In Iffco Chowk (Gurgaon)Enjoy Night ≽ 8448380779 ≼ Call Girls In Iffco Chowk (Gurgaon)
Enjoy Night ≽ 8448380779 ≼ Call Girls In Iffco Chowk (Gurgaon)Delhi Call girls
 
9990771857 Call Girls in Dwarka Sector 137 Noida (Call Girls) Delhi
9990771857 Call Girls in Dwarka Sector 137 Noida (Call Girls) Delhi9990771857 Call Girls in Dwarka Sector 137 Noida (Call Girls) Delhi
9990771857 Call Girls in Dwarka Sector 137 Noida (Call Girls) Delhidelhimodel235
 
Majestique Viman Nagar Pune Brochure.pdf
Majestique Viman Nagar Pune Brochure.pdfMajestique Viman Nagar Pune Brochure.pdf
Majestique Viman Nagar Pune Brochure.pdfBabyrudram
 
9990771857 Call Girls Dwarka Sector 8 Delhi (Call Girls ) Delhi
9990771857 Call Girls  Dwarka Sector 8 Delhi (Call Girls ) Delhi9990771857 Call Girls  Dwarka Sector 8 Delhi (Call Girls ) Delhi
9990771857 Call Girls Dwarka Sector 8 Delhi (Call Girls ) Delhidelhimodel235
 
MEQ Mainstreet Equity Corp Q2 2024 Investor Presentation
MEQ Mainstreet Equity Corp Q2 2024 Investor PresentationMEQ Mainstreet Equity Corp Q2 2024 Investor Presentation
MEQ Mainstreet Equity Corp Q2 2024 Investor PresentationMEQ - Mainstreet Equity Corp.
 
Call Girls In Krishna Nagar Delhi (Escort)↫8447779280↬@SHOT 1500- NIGHT 5500→...
Call Girls In Krishna Nagar Delhi (Escort)↫8447779280↬@SHOT 1500- NIGHT 5500→...Call Girls In Krishna Nagar Delhi (Escort)↫8447779280↬@SHOT 1500- NIGHT 5500→...
Call Girls In Krishna Nagar Delhi (Escort)↫8447779280↬@SHOT 1500- NIGHT 5500→...asmaqueen5
 
9990771857 Call Girls in Dwarka Sector 7 Delhi (Call Girls) Delhi
9990771857 Call Girls in Dwarka Sector 7 Delhi (Call Girls) Delhi9990771857 Call Girls in Dwarka Sector 7 Delhi (Call Girls) Delhi
9990771857 Call Girls in Dwarka Sector 7 Delhi (Call Girls) Delhidelhimodel235
 
Enjoy Night ≽ 8448380779 ≼ Call Girls In Huda City Centre (Gurgaon)
Enjoy Night ≽ 8448380779 ≼ Call Girls In Huda City Centre (Gurgaon)Enjoy Night ≽ 8448380779 ≼ Call Girls In Huda City Centre (Gurgaon)
Enjoy Night ≽ 8448380779 ≼ Call Girls In Huda City Centre (Gurgaon)Delhi Call girls
 
SVN Live 5.6.24 Weekly Property Broadcast
SVN Live 5.6.24 Weekly Property BroadcastSVN Live 5.6.24 Weekly Property Broadcast
SVN Live 5.6.24 Weekly Property BroadcastSVN International Corp.
 
Premium Villa Projects in Sarjapur Road Bengaluru
Premium Villa Projects in Sarjapur Road BengaluruPremium Villa Projects in Sarjapur Road Bengaluru
Premium Villa Projects in Sarjapur Road BengaluruShivaSeo3
 

Último (20)

Acibadem Konaklari Uskudar - Listin Turkey
Acibadem Konaklari Uskudar - Listin TurkeyAcibadem Konaklari Uskudar - Listin Turkey
Acibadem Konaklari Uskudar - Listin Turkey
 
TENANT SCREENING REPORT SERVICES​ How Tenant Screening Reports Work
TENANT SCREENING REPORT SERVICES​ How Tenant Screening Reports WorkTENANT SCREENING REPORT SERVICES​ How Tenant Screening Reports Work
TENANT SCREENING REPORT SERVICES​ How Tenant Screening Reports Work
 
Bptp The Amaario Launch Luxury Project Sector 37D Gurgaon Dwarka Expressway...
Bptp The Amaario Launch  Luxury Project  Sector 37D Gurgaon Dwarka Expressway...Bptp The Amaario Launch  Luxury Project  Sector 37D Gurgaon Dwarka Expressway...
Bptp The Amaario Launch Luxury Project Sector 37D Gurgaon Dwarka Expressway...
 
9990771857 Call Girls Dwarka Sector 9 Delhi (Call Girls ) Delhi
9990771857 Call Girls Dwarka Sector 9 Delhi (Call Girls ) Delhi9990771857 Call Girls Dwarka Sector 9 Delhi (Call Girls ) Delhi
9990771857 Call Girls Dwarka Sector 9 Delhi (Call Girls ) Delhi
 
Call Girls In Seelampur Delhi ↬8447779280}Seelampur Escorts Service In Delhi...
Call Girls In Seelampur  Delhi ↬8447779280}Seelampur Escorts Service In Delhi...Call Girls In Seelampur  Delhi ↬8447779280}Seelampur Escorts Service In Delhi...
Call Girls In Seelampur Delhi ↬8447779280}Seelampur Escorts Service In Delhi...
 
Best Deal Virtual Space in Satya The Hive Tata Zudio 750 Sqft 1.89 Cr All inc...
Best Deal Virtual Space in Satya The Hive Tata Zudio 750 Sqft 1.89 Cr All inc...Best Deal Virtual Space in Satya The Hive Tata Zudio 750 Sqft 1.89 Cr All inc...
Best Deal Virtual Space in Satya The Hive Tata Zudio 750 Sqft 1.89 Cr All inc...
 
9990771857 Call Girls in Dwarka Sector 2 Delhi (Call Girls) Delhi
9990771857 Call Girls in Dwarka Sector 2 Delhi (Call Girls) Delhi9990771857 Call Girls in Dwarka Sector 2 Delhi (Call Girls) Delhi
9990771857 Call Girls in Dwarka Sector 2 Delhi (Call Girls) Delhi
 
2k Shot Call girls Karol Bagh Delhi 9205541914
2k Shot Call girls Karol Bagh Delhi 92055419142k Shot Call girls Karol Bagh Delhi 9205541914
2k Shot Call girls Karol Bagh Delhi 9205541914
 
The Gale at Godrej Park World Hinjewadi Pune Brochure.pdf
The Gale at Godrej Park World Hinjewadi Pune Brochure.pdfThe Gale at Godrej Park World Hinjewadi Pune Brochure.pdf
The Gale at Godrej Park World Hinjewadi Pune Brochure.pdf
 
Kolte Patil Kharadi Pune E Brochure.pdf
Kolte Patil Kharadi Pune E  Brochure.pdfKolte Patil Kharadi Pune E  Brochure.pdf
Kolte Patil Kharadi Pune E Brochure.pdf
 
Enjoy Night ≽ 8448380779 ≼ Call Girls In Iffco Chowk (Gurgaon)
Enjoy Night ≽ 8448380779 ≼ Call Girls In Iffco Chowk (Gurgaon)Enjoy Night ≽ 8448380779 ≼ Call Girls In Iffco Chowk (Gurgaon)
Enjoy Night ≽ 8448380779 ≼ Call Girls In Iffco Chowk (Gurgaon)
 
9990771857 Call Girls in Dwarka Sector 137 Noida (Call Girls) Delhi
9990771857 Call Girls in Dwarka Sector 137 Noida (Call Girls) Delhi9990771857 Call Girls in Dwarka Sector 137 Noida (Call Girls) Delhi
9990771857 Call Girls in Dwarka Sector 137 Noida (Call Girls) Delhi
 
Majestique Viman Nagar Pune Brochure.pdf
Majestique Viman Nagar Pune Brochure.pdfMajestique Viman Nagar Pune Brochure.pdf
Majestique Viman Nagar Pune Brochure.pdf
 
9990771857 Call Girls Dwarka Sector 8 Delhi (Call Girls ) Delhi
9990771857 Call Girls  Dwarka Sector 8 Delhi (Call Girls ) Delhi9990771857 Call Girls  Dwarka Sector 8 Delhi (Call Girls ) Delhi
9990771857 Call Girls Dwarka Sector 8 Delhi (Call Girls ) Delhi
 
MEQ Mainstreet Equity Corp Q2 2024 Investor Presentation
MEQ Mainstreet Equity Corp Q2 2024 Investor PresentationMEQ Mainstreet Equity Corp Q2 2024 Investor Presentation
MEQ Mainstreet Equity Corp Q2 2024 Investor Presentation
 
Call Girls In Krishna Nagar Delhi (Escort)↫8447779280↬@SHOT 1500- NIGHT 5500→...
Call Girls In Krishna Nagar Delhi (Escort)↫8447779280↬@SHOT 1500- NIGHT 5500→...Call Girls In Krishna Nagar Delhi (Escort)↫8447779280↬@SHOT 1500- NIGHT 5500→...
Call Girls In Krishna Nagar Delhi (Escort)↫8447779280↬@SHOT 1500- NIGHT 5500→...
 
9990771857 Call Girls in Dwarka Sector 7 Delhi (Call Girls) Delhi
9990771857 Call Girls in Dwarka Sector 7 Delhi (Call Girls) Delhi9990771857 Call Girls in Dwarka Sector 7 Delhi (Call Girls) Delhi
9990771857 Call Girls in Dwarka Sector 7 Delhi (Call Girls) Delhi
 
Enjoy Night ≽ 8448380779 ≼ Call Girls In Huda City Centre (Gurgaon)
Enjoy Night ≽ 8448380779 ≼ Call Girls In Huda City Centre (Gurgaon)Enjoy Night ≽ 8448380779 ≼ Call Girls In Huda City Centre (Gurgaon)
Enjoy Night ≽ 8448380779 ≼ Call Girls In Huda City Centre (Gurgaon)
 
SVN Live 5.6.24 Weekly Property Broadcast
SVN Live 5.6.24 Weekly Property BroadcastSVN Live 5.6.24 Weekly Property Broadcast
SVN Live 5.6.24 Weekly Property Broadcast
 
Premium Villa Projects in Sarjapur Road Bengaluru
Premium Villa Projects in Sarjapur Road BengaluruPremium Villa Projects in Sarjapur Road Bengaluru
Premium Villa Projects in Sarjapur Road Bengaluru
 

FNB_House Price Index_January 2018

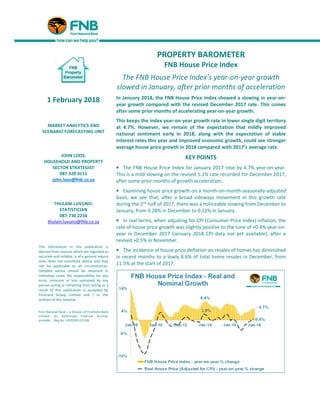
  • 1. PROPERTY BAROMETER FNB House Price Index The FNB House Price Index’s year-on-year growth slowed in January, after prior months of acceleration In January 2018, the FNB House Price Index showed a slowing in year-on- year growth compared with the revised December 2017 rate. This comes after some prior months of accelerating year-on-year growth. This keeps the index year-on-year growth rate in lower single digit territory at 4.7%. However, we remain of the expectation that mildly improved national sentiment early in 2018, along with the expectation of stable interest rates this year and improved economic growth, could see stronger average house price growth in 2018 compared with 2017’s average rate. KEY POINTS • The FNB House Price Index for January 2017 rose by 4.7% year-on-year. This is a mild slowing on the revised 5.1% rate recorded for December 2017, after some prior months of growth acceleration. • Examining house price growth on a month-on-month seasonally-adjusted basis, we see that, after a broad sideways movement in this growth rate during the 2nd half of 2017, there was a noticeable slowing from December to January, from 0.28% in December to 0.12% in January.. • In real terms, when adjusting for CPI (Consumer Price Index) inflation, the rate of house price growth was slightly positive to the tune of +0.4% year-on- year in December 2017 (January 2018 CPI data not yet available), after a revised +0.5% in November. • The incidence of house price deflation on resales of homes has diminished in recent months to a lowly 8.6% of total home resales in December, from 11.5% at the start of 2017. 1 February 2018 MARKET ANALYTICS AND SCENARIO FORECASTING UNIT JOHN LOOS: HOUSEHOLD AND PROPERTY SECTOR STRATEGIST 087-328 0151 john.loos@fnb.co.za THULANI LUVUNO: STATISTICIAN 087-730 2254 thulani.luvuno@fnb.co.za The information in this publication is derived from sources which are regarded as accurate and reliable, is of a general nature only, does not constitute advice and may not be applicable to all circumstances. Detailed advice should be obtained in individual cases. No responsibility for any error, omission or loss sustained by any person acting or refraining from acting as a result of this publication is accepted by Firstrand Group Limited and / or the authors of the material. First National Bank – a division of FirstRand Bank Limited. An Authorised Financial Services provider. Reg No. 1929/001225/06
  • 2. JANUARY FNB HOUSE PRICE INDEX FINDINGS JANUARY AVERAGE HOUSE PRICE GROWTH The FNB House Price Index for January 2018 showed a renewed deceleration, from a revised 5.1% in the previous month to 4.7% year-on- year. This mild deceleration comes after a gradual acceleration in year-on-year house price growth through much of 2017. In real terms, when adjusting for CPI (Consumer Price Index) inflation, the rate of house price growth was in mild positive territory, having recorded a +0.4% year-on-year rise in December 2017 (January CPI data not yet available), slightly slower than the 0.5% rate in November. This slight slowing in revised real price growth from November to December was due to an unchanged 5.1% revised nominal house price growth rate in December (compared to November), while CPI inflation accelerated slightly from 4.6% year-on-year in November to 4.7% in December. The average price of homes transacted in January was R1,116,444. MONTH-ON-MONTH HOUSE PRICE GROWTH SLOWED IN JANUARY Examining house price growth on a month-on- month seasonally-adjusted basis (a better recent momentum indicator than the year-on- year calculation) suggests that, while certain leading business cycle indicators point to near term economic improvement, we may not quite be there yet. The Housing Market can often be a good leading indicator of economic conditions. Our revised month-on-month house price growth rate showed a broad sideways movement in growth during the 2nd half of 2017, but the January rate slowed noticeably from 0.28% in December to 0.12%. The previous 4 noticeable “dips” in the Manufacturing Purchasing Managers’ Index (PMI), also a useful leading indicator of broader economy’s direction, have broadly correlated with the timing of the seasonally adjusted month-on-month dips in house price growth. It thus now remains to be seen whether this latest slowing in month- on-month house price growth will go further, given that the Manufacturing PMI has been very week in recent months. Therefore, although sentiment in the country appears to be improved early in 2018, and we are more upbeat regarding economic prospects for 2018, as yet the housing market is showing no strong indication of strengthening.
  • 3. FNB HOUSE PRICE GROWTH IN FOREIGN CURRENCY TERMS WHAT HOUSE PRICE GROWTH RATES ARE ASPIRANT FOREIGN BUYERS OF DOMESTIC PROPERTY SEEING? The recent Rand strengthening, especially following the change of leadership at the ruling party’s December 2017 elective conference, begins to show up in the January FNB House Price Index when denominated in certain major foreign currencies. The Euro-denominated FNB House Price Index saw a year-on-year growth acceleration from -2.19% deflation in December to +1.03% in January, while the UK Pound-denominated Index accelerated further from +2.4% year-on- year in December to 3.8% in January. But the major global currency news last year was a significant US Dollar weakening, the result being seen in a strong +15.89% year-on-year growth rate in the US Dollar- denominated FNB House Price Index. Recent Rand strength has thus started to lift the prices of domestic property for aspirant foreign buyers from certain key economies, especially those who operate in Dollars, given the added impact of Dollar weakness. LONGER TERM REAL HOUSE PRICE PERFORMANCE REAL HOUSE PRICE LEVELS Examining the longer term real house price trends (house prices adjusted for CPI inflation), despite recent months of slight positive real house price growth, we see that the level as at December 2017 had lost -4.1% since a post- 2008/9 recession high in December 2015. Looking a bit further back to the all-time real house price peak at the end of 2007 (at the end of the pre-2008 housing boom period), on a cumulative basis real house prices were -19.2% down on that high as at December 2017. However, looking back further, despite a mediocre performance in recent years, the average real price currently remains a massive 63.8% above the end-2000 level, 17 years ago, and a time back just before boom-time price inflation started to accelerate rapidly. We therefore still regard current real price levels as high by historic standards. In nominal terms, when not adjusting for CPI inflation, the average house price in January 2018 was 323.3% above the end-2000 level. By comparison, consumer goods and services prices, as measured by the CPI, were only 158.2% higher over virtually the same period (up to December 2017 due to January CPI data not yet available).
  • 4. THE EXTENT OF HOUSE PRICE DEFLATION IN THE MARKET HOW PREVALENT IS HOME RE-SALES PRICE DEFLATION? We also analyse house prices in order to view the magnitude of house price resales deflation vs inflation in the housing market. At any given time, there is always a certain amount of resales deflation within the overall market. By this we mean homes being resold at prices below that which they were previously purchased for. In such times like the present when the market is weak and average house price inflation is low, it would be realistic perhaps to expect a higher percentage of homes being resold at deflated prices, and vice versa in stronger market times. The causes of price deflation when reselling can vary: • Genuine market price deflation can be the cause in weak economic or rising interest rate times, such as in 2008/9, or a specific area can fall from favour and even go into decay. • A home may have originally been purchased at an “incorrectly” high price which was above the true market value at the time. Establishing the true market price is tough in a market where each home’s characteristics differs in some way from the next. • Financial stress of the owner can lead to a deterioration in the property due to lack of maintenance and upkeep., or can cause a very hasty sale at below “market value”. We use deeds data for properties purchased and sold by individuals (“Natural persons”) for these estimates. The incidence of re-sales price deflation remains moderate, and the overall incidence of such price deflation expressed as a percentage of total sales has declined in recent months. From 10.7% of total sales as at September 2017, the estimated level of resale price deflation declined to 8.6% by December (having started 2017 at a higher 11.5%) Therefore, the incidence of resale price deflation lessened broadly speaking through 2017, which perhaps reflects that slight acceleration through 2017 in the year-on-year growth rate in the FNB House Price Index. The December level of 8.6% remains very low compared to the 23.4% “peak-of-crisis” level of September 2009. We delve a bit deeper, however, into the various “bands” of resale price deflation/inflation.
  • 5. In order to do this, we smooth the individual price inflation/deflation “bands” that we have created, by using 6-month moving averages. Firstly, what we see is that the percentage of homes being resold for “10% or more” above purchase price has begun to decline slightly, from a post-2008/9 recession high of 78.1% for the 6 months to June 2016 to 77.1% for the 6 months to December 2017. Homes resold at 5-10% above purchase price have also seen a very small decrease as a percentage of total in 2017, from a high of 6.6% for the 6 months to February 2017 to 6.3% for the 6 months to December 2017. There has by contrast, been a noticeable increase in the percentage of homes resold at 0-5% above original purchase price, from 5.6% of total sales for the 6 months to January 2017, to 6.7% for the 6 months to December 2017. This translates into a small decline in both categories of resales price deflation over 2017. From 8.5% of total sales for the 6 months to January 2017, homes resold between 0% and 95% of previous purchase price declined to 8% of total sales for the 6 months to December 2017, while those reselling at 0%-5% below previous purchase price declined from 2.1% of total sales for the 6 months to January 2017 to 1.9% for the 6 months to December. Therefore, in 2007, we did not see any signs of increase in the incidence of resales price deflation, despite low average house price growth. To the contrary, some mild improvement (diminishing in the incidence of resales deflation) actually took place. CONCLUSION A mild slowing in year-on-year house price growth at the start of 2018, we believe, is not yet reflective of certain positive economic developments which appear to be taking place. Economic growth had already emerged from last summer’s recession in the winter quarters of 2017, and the Leading Business Cycle Indicators of both the SARB and OECD have been pointing to possibly improved economic growth in the near term. In addition, the change in leadership in the ruling party in December appears to have been seen in a positive light by many, assisting in a significant improvement in investor sentiment and indeed the Rand of late. We would anticipate that a significantly improved national mood, along with signs of strong economic growth to come, which would in turn support better employment and Household Disposable Income growth, should lead to some strengthening in residential demand and mildly stronger average house price growth this year. The stronger Rand, should it be sustained, also has implications for inflation (lowering imported goods prices), and is supportive of our FNB expectation of either sideways movement in interest rates through 2018, or even a possible interest rate cut.
  • 6. The FNB forecast for interest rates is for an unchanged Repo and Prime Rate through 2018, Prime expected to remain at 10.25%. For economic growth, after an estimated 0.9% in 2017, the forecast is for a slightly higher 1.5% in 2018. These forecasts, coupled with a more positive sentiment in the country, which we believe will feed into Consumer Confidence levels too, are expected to strengthen the housing market mildly in 2018, producing average house price growth in the 5-6% range for the year as a whole, compared to a revised 3.8% for 2017 as a whole. KEY RATIOS DERIVED FROM THE FNB HOUSE PRICE INDEX HOUSE PRICE BOND INSTALMENT TREND In such a credit dependent market, it is important to understand what the rate of change in the monthly bond instalment is, given changes in both house prices and mortgage lending rates. Using a Prime Rate series, along with Mortgage Originator Ooba’s time series for Mortgage Loans’ Average Differential from Prime, we calculate an “average mortgage lending rate and apply it to our average house price series to obtain an average monthly bond instalment estimate on a new 100% bond. The stalling in interest rate hiking since early- 2016, and then a subsequent lone interest rate cut in July 2017, has led to a slow year-on-year rate of increase in the average priced home instalment value of late, to the tune of 1.9% in January 2018, having slowed all the way from a high of 17.5% year-on-year in April 2016. In real terms, adjusting for CPI inflation, the December 2017 bond instalment rate of change was in decline to the tune of -2.3% (January CPI data not yet available). The rate of increase in this new bond instalment on the average priced house is also likely to have been slower than the average wage or disposable income inflation rate, thus likely translating into improvement in national average bonded home affordability. PRICE-RENT RATIO The Price-Rent Ratio is one important ratio in determining how costly the home buying option is relative to the competing option, i.e rental. Analysts often become concerned when the Price-Rent Ratio is very high, as it can begin to make the rental option very appealing, contributing at some stage into a drop in home buying and a fall in house prices. House price booms, or strong market periods at least, typically take this ratio higher. To this effect, we use the FNB House Price Index and the CPI for Actual rentals to monitor this ratio. We show it in index form (because the CPI is an index), with January 2008=100.
  • 7. Through 2016 and 2017, some gradual progress in lowering this Price-Rent Ratio has been made. From a multi-year high of 88.1 reached in February 2016, we have seen a gradual decline in the index to 84.86 by December 2017, a -3.7% decline. This reflects a period in which average house price growth has mildly underperformed rental inflation (as per StatsSA CPI Rental estimates). The Price-Rent Ratio Index is now -15.14% down on January 2008, which reflects a significant cumulative correction to date since the end of the pre-2008 housing market bubble. The other important ratio, i.e. the Instalment on a 100% bond on the average-priced house/Rent Ratio Index, is significantly lower than the Price-Rent Ratio Index (when using January 2008 as the base month), at a level of 71.88 as at December 2017. This is due to the added downward pressure from interest rates having been kept far lower than 2008 levels, Prime rate having peaked at 15.5% in mid-2008, and today being at only 10.25%. Low interest rates in recent years have thus assisted in keeping the home buying option significantly more attractive relative to the rental option compared to what was the case in 2008, despite some mild rate hiking between 2014 and 2016. REAL ALTERNATIVE PRIME RATE AND POTENTIAL FOR A SPECULATORS’ MARKET In order to create a “speculator’s paradise” in residential property, it is important to have price growth at a percentage significantly faster than the percentage of the annual interest rate charged on a mortgage loan. Such an environment could give rise to widespread use of cheap credit to buy and sell properties in a relatively short space of time and make big capital gains. 2004-5 was such a speculator’s paradise. To monitor this, we calculate a simple “Alternative Real Prime Rate”, which adjusts Prime Rate to real terms using average house price inflation instead of the usual CPI inflation rate approach. For a healthy market with low levels of speculation, we believe that this real rate should remain positive. Indeed, that was still very much the case in January 2018, where the Real Alternative Prime Rate was still a strongly positive 6.56%. We thus believe the SARB’s monetary policy stance to be appropriate from a residential market health point of view.
  • 8. WHAT FNB’S ALTERNATIVE HOUSE PRICE INDEX MEASURES SAY Given that house price statistics and indices are never an exact science, we often like to test our main house price index against our alternative house price index methodologies. Of late, 4 of the 5 of the monthly FNB National House Price Indices point to single-digit house price growth below 5%, and 4 out of 5 saw slower year-on-year growth in January compared with December 2017. Whereas we term our main house price index a “stratified mean”, where sub-segments of the index are averages with their weights fixed in the overall index, our FNB Stratified Median House Price Index is the average of the sub-segments’ median prices. The Stratified Median House Price Index showed slightly slower (than the “official” index) house price growth of 3.3% in January, while our FNB Repeat Sales House Price Index showed 1.4% growth. The other 2 indices, i.e. the “Simple” (i.e. unweighted) Mean and “Simple” Median indices showed 6.1% and 5.5% year-on-year growth respectively, The “Simple” Mean Index is thus the only one showing higher than 5% price growth, while the “Simple” Median Index is the only one to have seen slight acceleration in year- on-year growth from the prior month.
  • 9.
  • 10. ADDENDUM - NOTES: Note on The FNB Average House Price Index: Although also working on the average price principle (as opposed to median or repeat sales), the FNB House Price Index differs from a simple average house price index in that it could probably be termed a “fixed weight” average house price index. One of the practical problems we have found with house price indices is that relative short term activity shifts up and down the price ladder can lead to an average or median price index rising or declining where there was not necessarily “genuine” capital growth on homes. For example, if “Full Title 3 Bedroom volumes remain unchanged from one month to the next, but Sectional Title 1 Bedroom and Less (the cheapest segment on average) transaction volumes hypothetically double, the overall national average price could conceivably decline due to this relative activity shift. This challenge of activity shifts between segments is faced by all constructors of house price indices. In an attempt to reduce this effect, we decided to fix the weightings of the FNB House Price Index’s sub-segments in the overall national index. This, at best, can only be a partial solution, as activity shifts can still take place between smaller segments within the sub-segments. However, it does improve the situation. With our 2013 re-weighting exercise, we have begun to segment not only according to room number, but also to segment according to building size within the normal segments by room number, in order to further reduce the impact of activity shifts on average price estimates. The FNB House Price Index’s main segments are now as follows: • The weightings of the sub-segments are determined by their relative transaction volumes over the past 5 years, and will now change very slowly over time by applying a 5-year moving average to each new price data point. The sub-segments are: - Sectional Title: • Less than 2 bedroom – Large • Less than 2 bedroom – Medium • Less than 2 bedroom – Small • 2 Bedroom – Large • 2 bedroom – Medium • 2 bedroom – Small • 3 Bedroom and More - Large • 3 Bedroom and More - Medium • 3 Bedroom and More - Small - Full Title: • 2 Bedrooms and Less - Large • 2 Bedrooms and Less - Medium • 2 Bedrooms and Less - Small • 3 Bedroom - Large • 3 Bedroom - Medium • 3 Bedroom - Small • 4 Bedrooms and More - Large • 4 Bedrooms and More - Medium • 4 Bedrooms and More – Small
  • 11. The size cut-offs for “small”, medium” and “large” differ per room number sub-segment. “Large” would refer to the largest one-third of homes within a particular room number segment over the past 5 year period, “Medium” to the middle one-third, and “Small” to the smallest one-third of homes within that segment. • The Index is constructed using transaction price data from homes financed by FNB. • The minimum size cut-off for full title stands is 200 square metres, and the maximum size is 4000 square metres • The maximum price cut-off is R10m, and the lower price cut-off is R20,000 (largely to eliminate major outliers and glaring inputting errors). • The index is very lightly smoothed using a Hodrick-Prescott smoothing function with a Lambda of 5. A WORD OF CAUTION: Caution should be exercised when using the FNB House Price Index for any type of home “valuation” exercise. A simplistic approach sometimes used to acquiring a rough valuation for a residential property, which may last have been transacted a number of years ago, is to take its previous transaction value and date, and to apply the cumulative inflation rate of the House Price Index to that price to ascertain what its value should be at the present time. This approach can be hazardous for 3 reasons: • Firstly, the area in which that home is located may not have seen its average price inflation being the same as the national average (with the FNB House Price Index merely being a national average) • Secondly, the home being “valued” may have changed in characteristics or condition since it was last transacted, causing its own value growth to be out of line with the market. • Thirdly, if the home owner had bought the home previously at a value that was not market related (and getting the price “right” will always be an inexact science because each home is different from the next), when applying an average price index to update that valuation to the present day, one would be starting from an incorrect price base (at time of transaction), thus sustaining the “error”.