SlideShare una empresa de Scribd logo
1 de 17
Descargar para leer sin conexión
MIT-Center for Transportation & Logistics
                                                         Empowering Fact-Based Decisions Across Your Supply Chain


 “Drive supply chain innovation and accelerate its adoption into practice.”
   –   Founded in 1973 as an interdisciplinary unit in the MIT School of Engineering
   –   Conduct research in transportation, logistics and supply chain management
   –   Engage over 60 faculty and research staff from 11 MIT departments & schools
   –   Work with more than 50 companies across the world through the Global SCALE Network


• Master of Engineering in                                                        • SC2020
  Logistics (MLOG)                                                                • MIT FreightLab
• MIT-Zaragoza Program in                                                         • Security & Resilience
  Logistics (ZLOG)                                                                • Transportation Mgmt.
• ESD SM in Logistics                                                             • Emerging Markets
• ESD Ph.D. in Logistics                                                          • Energy/Carbon
• Executive Courses                                                               • Demand Mgmt.
                                                                                  • SC Risk Mgmt.
       • Three-tier partnership model
                                                                                  • Scenario Planning
                                                                                  • Strategy Alignment
       • Exchange community
                                                                                  • Education Partners
       • Collaborations
                                                                                  • MIT AgeLab
       • Communications


                                                 1                            © Copyright 2009 Chainalytics, LLC.
Key Question
                                                   Empowering Fact-Based Decisions Across Your Supply Chain


  What factors influence transportation rates and how much?
                                                                     Primary Business Sector
                                                                         (percent of membership)
• Various methods are available . . .
   – Anecdotal                                                             Foods         Consumer
                                                                            19%          Products
   – Survey                                                                                14%
                                                                                                   Durable
   – Econometric Modeling                                                                          Goods
                                                                   Beverages                        14%
                                                                     16%
                                                                                                       Other
                                                                                                        6%
                                                                        Industrial Whlsl/     Retail
                                                                           11%     Distrib     12%
                                                                                    8%
• Econometric Modeling – requires lots of data
   –   Annual data set contains >11M shipments for $11B in spend
   –   62 different companies varying in TL spend from $12M to $500M+
   –   Covers USA, Canada and in and out of Mexico
   –   Equivalent to ~ 2.5% of the total North American intercity truckload market

                                            2                           © Copyright 2009. Chainalytics, LLC.
Econometric Modeling
                                                Empowering Fact-Based Decisions Across Your Supply Chain


• Objective:
   – Develop an equation to predict the cost per load for TL freight, given
     characteristics of the freight

• Technique:
   – Find the ‘best-fit’ line between all of the observations using Weighted Least
     Squares (WLS) Regression
   – Develop a “base model”
   – Test various policies, practices, and processes to capture impact


• Complications:
   –   We never know which characteristics are important
   –   We can never capture ALL of the factors that influence cost
   –   The relationships can be very complex
   –   The data always have problems – some that are not easily fixed

                                         3                           © Copyright 2009. Chainalytics, LLC.
Testing Out Policy Impacts
                                                                                           Empowering Fact-Based Decisions Across Your Supply Chain


         Is there a benefit to being “carrier friendly”?
                      How do I even measure this?
                      What if we try to capture the accessorial policy.
                                                                              Value Ranges                                                                   Cost Impact


                                                                                                 Third Quartile
                                                         First Quartile


                                                                                                                                    Range 1-3Q


                                                                                                                                                 Responses
                                                                                                                      Maximum
                                           Minimum


                                                                                  Median
Accessorial                  Units                                                                                                                           LHD      LHR
Power Unit Detention         $/hour    $     23      $       50               $     52       $       60           $     80      $          10    48          $ 4      $ (17)
Drop Trailer Detention       $/day     $     25      $       25               $     35       $       50           $    136      $          25    29          $ 16     $ 73
Driver Assisted Loading      $/event   $    -        $       60               $     75       $       80           $    100      $          20     9          $ 23       X
Driver Assisted Unloading    $/event   $     60      $       75               $     75       $       93           $    125      $          18    16          $ 22       X
Driver Loading Wait Time     $/event   $     45      $       49               $     50       $       55           $     70      $           6     4            X        X
Driver Unloading Wait Time   $/event   $    -        $      -                 $     30       $       50           $     70      $          50    11            X        X
Vehicle Ordered, Not Used    $/event   $    100      $      150               $    238       $      250           $    300      $         100    40          $ (10)   $ 64
Layover                      $/event   $    150      $      250               $    275       $      400           $    500      $         150    30          $ 14     $ (3)
Redelivery                   $/event   $     20      $       75               $    113       $      125           $    225      $          50    16          $ (9)    $ (56)
1st Stop Off Charge          $/stop    $     35      $       60               $     75       $       90           $    100      $          30    36          $ 12     $ 57
2nd Stop Off Charge          $/stop    $     35      $       75               $    100       $      125           $    175      $          50    38          $ 22     $ 52
3rd Stop Off Charge          $/stop    $     35      $      100               $    125       $      156           $    300      $          56    36          $ 27     $ 61
4th Stop Off Charge          $/stop    $     55      $      113               $    150       $      213           $    300      $         100    23          $ 40     $ 24
5th Stop Off Charge          $/stop    $     55      $      100               $    125       $      175           $    300      $          75    13            X        X
6th Stop Off Charge          $/stop    $     55      $       95               $    138       $      181           $    300      $          86    12            X        X
7th Stop Off Charge          $/stop    $     55      $       95               $    138       $      181           $    300      $          86    12            X        X
Storage Fee                  $/event   $     25      $       35               $     40       $       50           $    100      $          15    10          $ 18     $ 134

                                                                          4                                                     © Copyright 2009. Chainalytics, LLC.
Testing Out Policy Impacts
                                                                                    Empowering Fact-Based Decisions Across Your Supply Chain


      • Individually, there is some limited rate impact
                       – Hard to separate out each individual policy/charge
                       – Potential for firms to have the same “footprint”
      • Looking at the collective effect
                       – Shippers with charges consistently worse than the median = less friendly
                       – Do these shippers tend to pay more or less in terms of line haul rates?

                       Firms by Percentage of Accessorials &
                                 Policies > Median

                  16                                                            Shippers with more than half of their
Number of Firms


                  12                                                          accessorials “worse” than median values
                   8                                                                paid ~3-5% more per load.
                   4
                   0
                         0%     20%      40%     60%     80%     100%
                         Percent of reported policies above the median


                                                                          5                              © Copyright 2009. Chainalytics, LLC.
Agenda
                                      Empowering Fact-Based Decisions Across Your Supply Chain


• How should shippers procure transportation?

• What impact do policies and practices have on rates?

• How should a shipper handle fuel volatility?


                                6                          © Copyright 2009. Chainalytics, LLC.
Predicting Fuel Prices
                                                                                                 Empowering Fact-Based Decisions Across Your Supply Chain


• Delphi Study with ~30 Transportation professionals in April 2008
• What will the price of diesel be at the end of the next 4 quarters?

                                                                 Fuel Price Delphi - Round 2 (4/2/08)
                    $4.50
                                     Maximum Forecast                                                     Median Forecast

                    $4.25


                    $4.00
  Cost per Gallon


                    $3.75


                    $3.50

                                                                    Minimum Forecast
                    $3.25


                    $3.00
                            Apr-08                      Jul-08                          Oct-08                         Jan-09                         Apr-09

                                                                     1st Quartile       max      min    3rd Quartile             Source: Chainalytics 2009


                                                                                    7                                     © Copyright 2009. Chainalytics, LLC.
US Department of Energy
                                                Empowering Fact-Based Decisions Across Your Supply Chain


Energy Information Administration’s Outlook for 2009 (published
                                   June 2008)

• According to EIA’s June 2008 Short-Term Energy Outlook, national
  average retail diesel fuel prices will peak in the third quarter of 2008
  at $4.75 before falling to $4.11 per gallon by the fourth quarter of
  2009 . . . However, the recent volatility seen in crude oil and
  petroleum product prices, if continued, may significantly alter these
  price projections.”

            Source: http://www.eia.doe.gov/bookshelf/brochures/diesel/


                                         8                           © Copyright 2009. Chainalytics, LLC.
Fuel Price Estimates
                                                                                                                       Empowering Fact-Based Decisions Across Your Supply Chain


                                                                            National Diesel Prices - 2004 - 2009


$5.00


$4.50                                                                                      4/08 Shipper Estimates
                                                                                           6/08 US DOE Estimates
$4.00


$3.50


$3.00


$2.50


$2.00


$1.50
     04


                                           05


                                                                                 06


                                                                                                                       07


                                                                                                                                                             08


                                                                                                                                                                                                   09
             04


                                                   05


                                                                                         06


                                                                                                                               07


                                                                                                                                                                     08
                        4


                                                              5


                                                                                                    6


                                                                                                                                          7


                                                                                                                                                                                8
                                 05


                                                                       06


                                                                                                             07


                                                                                                                                                   08


                                                                                                                                                                                         09
                      -0


                                                            -0


                                                                                                  -0


                                                                                                                                        -0


                                                                                                                                                                              -0
  r-


                                       r-


                                                                             r-


                                                                                                                   r-


                                                                                                                                                         r-


                                                                                                                                                                                               r-
           l-


                                                 l-


                                                                                       l-


                                                                                                                             l-


                                                                                                                                                                   l-
                             n-


                                                                   n-


                                                                                                         n-


                                                                                                                                               n-


                                                                                                                                                                                     n-
                  ct


                                                        ct


                                                                                              ct


                                                                                                                                    ct


                                                                                                                                                                          ct
          Ju


                                                Ju


                                                                                      Ju


                                                                                                                            Ju


                                                                                                                                                                  Ju
Ap


                                      Ap


                                                                            Ap


                                                                                                                  Ap


                                                                                                                                                        Ap


                                                                                                                                                                                              Ap
                            Ja


                                                                  Ja


                                                                                                        Ja


                                                                                                                                              Ja


                                                                                                                                                                                    Ja
                  O


                                                        O


                                                                                              O


                                                                                                                                    O


                                                                                                                                                                          O
                                                                                                   9                                                         © Copyright 2009. Chainalytics, LLC.
We never learn . . .
                       Empowering Fact-Based Decisions Across Your Supply Chain


Source: Scenarios: An Explorer’s Guide, Shell International 2003.


       10                                         © Copyright 2009. Chainalytics, LLC.
Fuel Impacts
                                                                                                        Empowering Fact-Based Decisions Across Your Supply Chain


                                                          Change in Fuel Costs, Linehaul Costs, ALOH, and FSC Paid

                              200%


                              180%
Percent Change from 10/1/07


                              160%


                              140%


                              120%


                              100%


                              80%
                                10/2/07   11/2/07   12/2/07   1/2/08   2/2/08   3/2/08        4/2/08    5/2/08    6/2/08        7/2/08    8/2/08     9/2/08
                                                                                         Week of Year

                                                                       ALOH      ACPM           DryFSCPaid       Fuel ($/gal)


                                      Comparing each to the value as of 1 Oct 2007 – note that
                                      the FSC paid increased faster than the actual cost of fuel.

                                                                                         11                                        © Copyright 2009. Chainalytics, LLC.
Fuel Impacts
                                                                                                 Empowering Fact-Based Decisions Across Your Supply Chain


                                                   Linehaul CPM versus Cost of Fuel over Modeling Time Period

                                                                                                                                          14 JUL 08
                         $1.530


                         $1.520
                                        1 OCT 07
                         $1.510
Linehaul Cost per Mile


                         $1.500
                                                                     29 SEP 08
                         $1.490


                         $1.480
                                                                                                                  Underlying Line Haul
                         $1.470
                                                                                                                  Rates were modified!
                         $1.460                                                                                  No longer linked to fuel.
                         $1.450
                               $3.00   $3.20       $3.40     $3.60      $3.80           $4.00          $4.20   $4.40      $4.60        $4.80       $5.00
                                                                                Fuel Cost per Gallon                      Source: Chainalytics 2009


         Each point represents the average line haul cost per mile plotted against
         the cost of fuel for that week – from Oct 2008 to Sep 2009.

                                                                                   12                                  © Copyright 2009. Chainalytics, LLC.
Fuel Impacts
                                                                                                Empowering Fact-Based Decisions Across Your Supply Chain


                                                            Fuel versus Linehaul Costs

                         $1.70
                                                                                             Oct
                                                                                            2008

                         $1.65
Linehaul Cost ($/mile)


                         $1.60         Oct
                                      2006                                                                                                         July
                                                                                                                                                  2008
                                                     Nov
                         $1.55                       2007                       Mar
                                                                                2008


                         $1.50


                         $1.45
                              $2.25          $2.75               $3.25                          $3.75                 $4.25                     $4.75
                                                                         Cost of Fuel ($/gal)

                                                            Longhaul Dry Van        Longhaul Refrigerated Van


                                                                               13                                    © Copyright 2009. Chainalytics, LLC.
Fuel Surcharge Programs
                                                                                              Empowering Fact-Based Decisions Across Your Supply Chain


                                 Parameters for TL FSC programs:                             Effective Fuel Surcharge Programs:
Base or Peg Rate – Threshold cost of fuel per gallon                             LHD: $1.238 Base with $0.058 Escalator and $0.01 Surcharge
Escalator – Increase in fuel costs that triggers surcharge                       LHR: $1.240 Base with $0.054 Escalator and $0.01 Surcharge
Surcharge – Amount paid to carrier in dollars per mile                           LHI: $1.258 Base with $0.066 Escalator and $0.01 Surcharge


                                                             Impact of FSC Programs

                               $0.80
FSC Paid to Carrier ($/mile)


                               $0.70
                               $0.60
                               $0.50
                               $0.40
                               $0.30
                               $0.20
                               $0.10
                                $-
                               $(0.10)
                                     $2.00   $2.25   $2.50     $2.75    $3.00        $3.25       $3.50      $3.75        $4.00        $4.25        $4.50

                                                                       Cost of Fuel ($/gallon)

                                                             Min       25th           Median             75th            Max

                                                                                14                                  © Copyright 2009. Chainalytics, LLC.
Fuel Impact on Benchmark
                                                             Empowering Fact-Based Decisions Across Your Supply Chain


• How does a shipper’s FSC program influence line haul rates?
  – Two Schools of Thought: Compensating or Independent


                 Line Haul = $1.20          FSC = $0.34            Line Haul = $1.20              FSC = $0.34
 Shipper A:

                 Line Haul = $1.26             FSC = $0.28         Line Haul = $1.20          FSC = $0.28
 Shipper B:

              Shipper A = Shipper B   Total Cost = $1.54     e sent as ping requests to other nodes.
                                                                             $1.48


              Case 1: LH and FSC Compensate                   Case 2: LH and FSC are Independent


• Previous Analysis
  – Prior to this model, FSC programs mainly varied with respect to the Escalator.
  – In Model 1 of 2008 we found that shippers with a $0.06 Escalator paid had
    higher line haul rates (~$0.125 per mile) than shippers with a $0.05 Escalator.
  – This year – there was greater variability across all dimensions. Direct
    comparisons of programs proved inconclusive.

                                                      15                          © Copyright 2009. Chainalytics, LLC.
Conclusions
                                             Empowering Fact-Based Decisions Across Your Supply Chain


• The more shippers expose in the Fuel Surcharge bucket the
  better off they are, in total rate paid
  – Keep the peg or base low
  – Keep the escalator in line with estimated fuel efficiency


• The overall impact of your FSC program is only about 1%-2%
  of the total rate paid

• Predicting the future price of fuel is futile
  – Create a fair FSC and stick to it


                                        16                        © Copyright 2009. Chainalytics, LLC.
Empowering Fact-Based Decisions Across Your Supply Chain


Best Practices in Transportation
         Procurement


              Gary Girotti
              Vice President
             Chainalytics LLC

          Dr. Chris Caplice
            Executive Director
  MIT Center for Transportation & Logistics


              March 3, 2009


                             17                             © Copyright 2009. Chainalytics, LLC.

Más contenido relacionado

Destacado

Bill Stankiewicz Copy Of Fausti Catalog Ita Ing Russo
Bill Stankiewicz Copy Of Fausti Catalog Ita Ing RussoBill Stankiewicz Copy Of Fausti Catalog Ita Ing Russo
Bill Stankiewicz Copy Of Fausti Catalog Ita Ing RussoBillStankiewicz
 
Bill Stankiewicz copy of Anixter Presentation
Bill Stankiewicz copy of  Anixter PresentationBill Stankiewicz copy of  Anixter Presentation
Bill Stankiewicz copy of Anixter PresentationBillStankiewicz
 
Bill Stankiewicz Copy Of Future Of Global Construction To 2014
Bill Stankiewicz Copy Of Future Of Global Construction To 2014Bill Stankiewicz Copy Of Future Of Global Construction To 2014
Bill Stankiewicz Copy Of Future Of Global Construction To 2014BillStankiewicz
 
2009 Bob Costello Presentation
2009 Bob Costello Presentation2009 Bob Costello Presentation
2009 Bob Costello PresentationBillStankiewicz
 

Destacado (6)

Bill Stankiewicz Bosch
Bill Stankiewicz BoschBill Stankiewicz Bosch
Bill Stankiewicz Bosch
 
Bill Stankiewicz Copy Of Fausti Catalog Ita Ing Russo
Bill Stankiewicz Copy Of Fausti Catalog Ita Ing RussoBill Stankiewicz Copy Of Fausti Catalog Ita Ing Russo
Bill Stankiewicz Copy Of Fausti Catalog Ita Ing Russo
 
Bill Stankiewicz copy of Anixter Presentation
Bill Stankiewicz copy of  Anixter PresentationBill Stankiewicz copy of  Anixter Presentation
Bill Stankiewicz copy of Anixter Presentation
 
March2011,Breeze
March2011,BreezeMarch2011,Breeze
March2011,Breeze
 
Bill Stankiewicz Copy Of Future Of Global Construction To 2014
Bill Stankiewicz Copy Of Future Of Global Construction To 2014Bill Stankiewicz Copy Of Future Of Global Construction To 2014
Bill Stankiewicz Copy Of Future Of Global Construction To 2014
 
2009 Bob Costello Presentation
2009 Bob Costello Presentation2009 Bob Costello Presentation
2009 Bob Costello Presentation
 

Más de BillStankiewicz

Hwc logistics ad january 31, 2013
Hwc logistics ad january 31, 2013Hwc logistics ad january 31, 2013
Hwc logistics ad january 31, 2013BillStankiewicz
 
Dubai Seven Star Hotel From Bill Stankiewicz
Dubai Seven Star Hotel From Bill StankiewiczDubai Seven Star Hotel From Bill Stankiewicz
Dubai Seven Star Hotel From Bill StankiewiczBillStankiewicz
 
Bill Stankiewicz Copy Of Facebook 2012 Beyond Hype
Bill Stankiewicz Copy Of  Facebook 2012 Beyond HypeBill Stankiewicz Copy Of  Facebook 2012 Beyond Hype
Bill Stankiewicz Copy Of Facebook 2012 Beyond HypeBillStankiewicz
 
Bill Stankiewicz Copy American Shipper Report 20012 Web
Bill Stankiewicz Copy American Shipper  Report 20012 WebBill Stankiewicz Copy American Shipper  Report 20012 Web
Bill Stankiewicz Copy American Shipper Report 20012 WebBillStankiewicz
 
Bill Stankiewicz Copy William Gates U Ti
Bill Stankiewicz Copy William Gates U TiBill Stankiewicz Copy William Gates U Ti
Bill Stankiewicz Copy William Gates U TiBillStankiewicz
 
Bill Stankiewicz Copy State Of Logistics Study For Web 3 Pl
Bill Stankiewicz Copy  State Of Logistics Study For Web 3 PlBill Stankiewicz Copy  State Of Logistics Study For Web 3 Pl
Bill Stankiewicz Copy State Of Logistics Study For Web 3 PlBillStankiewicz
 
Bill Stankiewicz Copy Adrian Gonzalez, Arc V2
Bill Stankiewicz Copy Adrian Gonzalez, Arc  V2Bill Stankiewicz Copy Adrian Gonzalez, Arc  V2
Bill Stankiewicz Copy Adrian Gonzalez, Arc V2BillStankiewicz
 
Bill Stankiewicz Copy Greg Smith Oracle For Web
Bill Stankiewicz Copy Greg Smith Oracle For WebBill Stankiewicz Copy Greg Smith Oracle For Web
Bill Stankiewicz Copy Greg Smith Oracle For WebBillStankiewicz
 
Bill Stankiewicz Copy Of Sid Brown Nfi
Bill Stankiewicz Copy Of Sid Brown NfiBill Stankiewicz Copy Of Sid Brown Nfi
Bill Stankiewicz Copy Of Sid Brown NfiBillStankiewicz
 
Bill Stankiewicz Copy Keith Bradley Ingram Micro
Bill Stankiewicz Copy Keith Bradley Ingram MicroBill Stankiewicz Copy Keith Bradley Ingram Micro
Bill Stankiewicz Copy Keith Bradley Ingram MicroBillStankiewicz
 
Bill Stankiewicz Copy Jan. 2011 Uncertainty Is Certain
Bill Stankiewicz Copy Jan. 2011 Uncertainty Is CertainBill Stankiewicz Copy Jan. 2011 Uncertainty Is Certain
Bill Stankiewicz Copy Jan. 2011 Uncertainty Is CertainBillStankiewicz
 
2 5 2011 Mobile In Retail
2 5 2011 Mobile In Retail2 5 2011 Mobile In Retail
2 5 2011 Mobile In RetailBillStankiewicz
 
2 5 2011 Global Powers Of Retailing
2 5 2011 Global Powers Of Retailing2 5 2011 Global Powers Of Retailing
2 5 2011 Global Powers Of RetailingBillStankiewicz
 
2 5 2011 Exel And Dhl Seek Greater Flexibility
2 5 2011 Exel And Dhl Seek Greater Flexibility2 5 2011 Exel And Dhl Seek Greater Flexibility
2 5 2011 Exel And Dhl Seek Greater FlexibilityBillStankiewicz
 
2 5 2011 Bill Stankiewicz Copy Sustainability Trends European Retail
2 5 2011 Bill Stankiewicz Copy Sustainability Trends European Retail2 5 2011 Bill Stankiewicz Copy Sustainability Trends European Retail
2 5 2011 Bill Stankiewicz Copy Sustainability Trends European RetailBillStankiewicz
 
2 5 2011 Bill Stankiewicz Copy Of Traceability
2 5 2011 Bill Stankiewicz Copy Of Traceability2 5 2011 Bill Stankiewicz Copy Of Traceability
2 5 2011 Bill Stankiewicz Copy Of TraceabilityBillStankiewicz
 
2009 Phil Herr Presentation
2009 Phil Herr Presentation2009 Phil Herr Presentation
2009 Phil Herr PresentationBillStankiewicz
 

Más de BillStankiewicz (20)

Hwc logistics ad january 31, 2013
Hwc logistics ad january 31, 2013Hwc logistics ad january 31, 2013
Hwc logistics ad january 31, 2013
 
Dubai Seven Star Hotel From Bill Stankiewicz
Dubai Seven Star Hotel From Bill StankiewiczDubai Seven Star Hotel From Bill Stankiewicz
Dubai Seven Star Hotel From Bill Stankiewicz
 
Bill Stankiewicz Copy Of Facebook 2012 Beyond Hype
Bill Stankiewicz Copy Of  Facebook 2012 Beyond HypeBill Stankiewicz Copy Of  Facebook 2012 Beyond Hype
Bill Stankiewicz Copy Of Facebook 2012 Beyond Hype
 
Bill Stankiewicz Copy American Shipper Report 20012 Web
Bill Stankiewicz Copy American Shipper  Report 20012 WebBill Stankiewicz Copy American Shipper  Report 20012 Web
Bill Stankiewicz Copy American Shipper Report 20012 Web
 
Clg Overview
Clg OverviewClg Overview
Clg Overview
 
Bill Stankiewicz Copy William Gates U Ti
Bill Stankiewicz Copy William Gates U TiBill Stankiewicz Copy William Gates U Ti
Bill Stankiewicz Copy William Gates U Ti
 
Bill Stankiewicz Copy State Of Logistics Study For Web 3 Pl
Bill Stankiewicz Copy  State Of Logistics Study For Web 3 PlBill Stankiewicz Copy  State Of Logistics Study For Web 3 Pl
Bill Stankiewicz Copy State Of Logistics Study For Web 3 Pl
 
Bill Stankiewicz Copy Adrian Gonzalez, Arc V2
Bill Stankiewicz Copy Adrian Gonzalez, Arc  V2Bill Stankiewicz Copy Adrian Gonzalez, Arc  V2
Bill Stankiewicz Copy Adrian Gonzalez, Arc V2
 
Bill Stankiewicz Copy Greg Smith Oracle For Web
Bill Stankiewicz Copy Greg Smith Oracle For WebBill Stankiewicz Copy Greg Smith Oracle For Web
Bill Stankiewicz Copy Greg Smith Oracle For Web
 
Bill Stankiewicz Copy Of Sid Brown Nfi
Bill Stankiewicz Copy Of Sid Brown NfiBill Stankiewicz Copy Of Sid Brown Nfi
Bill Stankiewicz Copy Of Sid Brown Nfi
 
Bill Stankiewicz Copy Keith Bradley Ingram Micro
Bill Stankiewicz Copy Keith Bradley Ingram MicroBill Stankiewicz Copy Keith Bradley Ingram Micro
Bill Stankiewicz Copy Keith Bradley Ingram Micro
 
The Spirit April 2011
The Spirit April 2011The Spirit April 2011
The Spirit April 2011
 
Bill Stankiewicz Copy Jan. 2011 Uncertainty Is Certain
Bill Stankiewicz Copy Jan. 2011 Uncertainty Is CertainBill Stankiewicz Copy Jan. 2011 Uncertainty Is Certain
Bill Stankiewicz Copy Jan. 2011 Uncertainty Is Certain
 
2 5 2011 Mobile In Retail
2 5 2011 Mobile In Retail2 5 2011 Mobile In Retail
2 5 2011 Mobile In Retail
 
2 5 2011 Global Powers Of Retailing
2 5 2011 Global Powers Of Retailing2 5 2011 Global Powers Of Retailing
2 5 2011 Global Powers Of Retailing
 
2 5 2011 Exel And Dhl Seek Greater Flexibility
2 5 2011 Exel And Dhl Seek Greater Flexibility2 5 2011 Exel And Dhl Seek Greater Flexibility
2 5 2011 Exel And Dhl Seek Greater Flexibility
 
2 5 2011 Bill Stankiewicz Copy Sustainability Trends European Retail
2 5 2011 Bill Stankiewicz Copy Sustainability Trends European Retail2 5 2011 Bill Stankiewicz Copy Sustainability Trends European Retail
2 5 2011 Bill Stankiewicz Copy Sustainability Trends European Retail
 
2 5 2011 Bill Stankiewicz Copy Of Traceability
2 5 2011 Bill Stankiewicz Copy Of Traceability2 5 2011 Bill Stankiewicz Copy Of Traceability
2 5 2011 Bill Stankiewicz Copy Of Traceability
 
2009 Phil Herr Presentation
2009 Phil Herr Presentation2009 Phil Herr Presentation
2009 Phil Herr Presentation
 
2010 Jay Bush
2010 Jay Bush2010 Jay Bush
2010 Jay Bush
 

2009 Best Practices In Transportation Part 2

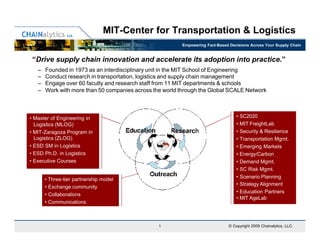
  • 1. MIT-Center for Transportation & Logistics Empowering Fact-Based Decisions Across Your Supply Chain “Drive supply chain innovation and accelerate its adoption into practice.” – Founded in 1973 as an interdisciplinary unit in the MIT School of Engineering – Conduct research in transportation, logistics and supply chain management – Engage over 60 faculty and research staff from 11 MIT departments & schools – Work with more than 50 companies across the world through the Global SCALE Network • Master of Engineering in • SC2020 Logistics (MLOG) • MIT FreightLab • MIT-Zaragoza Program in • Security & Resilience Logistics (ZLOG) • Transportation Mgmt. • ESD SM in Logistics • Emerging Markets • ESD Ph.D. in Logistics • Energy/Carbon • Executive Courses • Demand Mgmt. • SC Risk Mgmt. • Three-tier partnership model • Scenario Planning • Strategy Alignment • Exchange community • Education Partners • Collaborations • MIT AgeLab • Communications 1 © Copyright 2009 Chainalytics, LLC.
  • 2. Key Question Empowering Fact-Based Decisions Across Your Supply Chain What factors influence transportation rates and how much? Primary Business Sector (percent of membership) • Various methods are available . . . – Anecdotal Foods Consumer 19% Products – Survey 14% Durable – Econometric Modeling Goods Beverages 14% 16% Other 6% Industrial Whlsl/ Retail 11% Distrib 12% 8% • Econometric Modeling – requires lots of data – Annual data set contains >11M shipments for $11B in spend – 62 different companies varying in TL spend from $12M to $500M+ – Covers USA, Canada and in and out of Mexico – Equivalent to ~ 2.5% of the total North American intercity truckload market 2 © Copyright 2009. Chainalytics, LLC.
  • 3. Econometric Modeling Empowering Fact-Based Decisions Across Your Supply Chain • Objective: – Develop an equation to predict the cost per load for TL freight, given characteristics of the freight • Technique: – Find the ‘best-fit’ line between all of the observations using Weighted Least Squares (WLS) Regression – Develop a “base model” – Test various policies, practices, and processes to capture impact • Complications: – We never know which characteristics are important – We can never capture ALL of the factors that influence cost – The relationships can be very complex – The data always have problems – some that are not easily fixed 3 © Copyright 2009. Chainalytics, LLC.
  • 4. Testing Out Policy Impacts Empowering Fact-Based Decisions Across Your Supply Chain Is there a benefit to being “carrier friendly”? How do I even measure this? What if we try to capture the accessorial policy. Value Ranges Cost Impact Third Quartile First Quartile Range 1-3Q Responses Maximum Minimum Median Accessorial Units LHD LHR Power Unit Detention $/hour $ 23 $ 50 $ 52 $ 60 $ 80 $ 10 48 $ 4 $ (17) Drop Trailer Detention $/day $ 25 $ 25 $ 35 $ 50 $ 136 $ 25 29 $ 16 $ 73 Driver Assisted Loading $/event $ - $ 60 $ 75 $ 80 $ 100 $ 20 9 $ 23 X Driver Assisted Unloading $/event $ 60 $ 75 $ 75 $ 93 $ 125 $ 18 16 $ 22 X Driver Loading Wait Time $/event $ 45 $ 49 $ 50 $ 55 $ 70 $ 6 4 X X Driver Unloading Wait Time $/event $ - $ - $ 30 $ 50 $ 70 $ 50 11 X X Vehicle Ordered, Not Used $/event $ 100 $ 150 $ 238 $ 250 $ 300 $ 100 40 $ (10) $ 64 Layover $/event $ 150 $ 250 $ 275 $ 400 $ 500 $ 150 30 $ 14 $ (3) Redelivery $/event $ 20 $ 75 $ 113 $ 125 $ 225 $ 50 16 $ (9) $ (56) 1st Stop Off Charge $/stop $ 35 $ 60 $ 75 $ 90 $ 100 $ 30 36 $ 12 $ 57 2nd Stop Off Charge $/stop $ 35 $ 75 $ 100 $ 125 $ 175 $ 50 38 $ 22 $ 52 3rd Stop Off Charge $/stop $ 35 $ 100 $ 125 $ 156 $ 300 $ 56 36 $ 27 $ 61 4th Stop Off Charge $/stop $ 55 $ 113 $ 150 $ 213 $ 300 $ 100 23 $ 40 $ 24 5th Stop Off Charge $/stop $ 55 $ 100 $ 125 $ 175 $ 300 $ 75 13 X X 6th Stop Off Charge $/stop $ 55 $ 95 $ 138 $ 181 $ 300 $ 86 12 X X 7th Stop Off Charge $/stop $ 55 $ 95 $ 138 $ 181 $ 300 $ 86 12 X X Storage Fee $/event $ 25 $ 35 $ 40 $ 50 $ 100 $ 15 10 $ 18 $ 134 4 © Copyright 2009. Chainalytics, LLC.
  • 5. Testing Out Policy Impacts Empowering Fact-Based Decisions Across Your Supply Chain • Individually, there is some limited rate impact – Hard to separate out each individual policy/charge – Potential for firms to have the same “footprint” • Looking at the collective effect – Shippers with charges consistently worse than the median = less friendly – Do these shippers tend to pay more or less in terms of line haul rates? Firms by Percentage of Accessorials & Policies > Median 16 Shippers with more than half of their Number of Firms 12 accessorials “worse” than median values 8 paid ~3-5% more per load. 4 0 0% 20% 40% 60% 80% 100% Percent of reported policies above the median 5 © Copyright 2009. Chainalytics, LLC.
  • 6. Agenda Empowering Fact-Based Decisions Across Your Supply Chain • How should shippers procure transportation? • What impact do policies and practices have on rates? • How should a shipper handle fuel volatility? 6 © Copyright 2009. Chainalytics, LLC.
  • 7. Predicting Fuel Prices Empowering Fact-Based Decisions Across Your Supply Chain • Delphi Study with ~30 Transportation professionals in April 2008 • What will the price of diesel be at the end of the next 4 quarters? Fuel Price Delphi - Round 2 (4/2/08) $4.50 Maximum Forecast Median Forecast $4.25 $4.00 Cost per Gallon $3.75 $3.50 Minimum Forecast $3.25 $3.00 Apr-08 Jul-08 Oct-08 Jan-09 Apr-09 1st Quartile max min 3rd Quartile Source: Chainalytics 2009 7 © Copyright 2009. Chainalytics, LLC.
  • 8. US Department of Energy Empowering Fact-Based Decisions Across Your Supply Chain Energy Information Administration’s Outlook for 2009 (published June 2008) • According to EIA’s June 2008 Short-Term Energy Outlook, national average retail diesel fuel prices will peak in the third quarter of 2008 at $4.75 before falling to $4.11 per gallon by the fourth quarter of 2009 . . . However, the recent volatility seen in crude oil and petroleum product prices, if continued, may significantly alter these price projections.” Source: http://www.eia.doe.gov/bookshelf/brochures/diesel/ 8 © Copyright 2009. Chainalytics, LLC.
  • 9. Fuel Price Estimates Empowering Fact-Based Decisions Across Your Supply Chain National Diesel Prices - 2004 - 2009 $5.00 $4.50 4/08 Shipper Estimates 6/08 US DOE Estimates $4.00 $3.50 $3.00 $2.50 $2.00 $1.50 04 05 06 07 08 09 04 05 06 07 08 4 5 6 7 8 05 06 07 08 09 -0 -0 -0 -0 -0 r- r- r- r- r- r- l- l- l- l- l- n- n- n- n- n- ct ct ct ct ct Ju Ju Ju Ju Ju Ap Ap Ap Ap Ap Ap Ja Ja Ja Ja Ja O O O O O 9 © Copyright 2009. Chainalytics, LLC.
  • 10. We never learn . . . Empowering Fact-Based Decisions Across Your Supply Chain Source: Scenarios: An Explorer’s Guide, Shell International 2003. 10 © Copyright 2009. Chainalytics, LLC.
  • 11. Fuel Impacts Empowering Fact-Based Decisions Across Your Supply Chain Change in Fuel Costs, Linehaul Costs, ALOH, and FSC Paid 200% 180% Percent Change from 10/1/07 160% 140% 120% 100% 80% 10/2/07 11/2/07 12/2/07 1/2/08 2/2/08 3/2/08 4/2/08 5/2/08 6/2/08 7/2/08 8/2/08 9/2/08 Week of Year ALOH ACPM DryFSCPaid Fuel ($/gal) Comparing each to the value as of 1 Oct 2007 – note that the FSC paid increased faster than the actual cost of fuel. 11 © Copyright 2009. Chainalytics, LLC.
  • 12. Fuel Impacts Empowering Fact-Based Decisions Across Your Supply Chain Linehaul CPM versus Cost of Fuel over Modeling Time Period 14 JUL 08 $1.530 $1.520 1 OCT 07 $1.510 Linehaul Cost per Mile $1.500 29 SEP 08 $1.490 $1.480 Underlying Line Haul $1.470 Rates were modified! $1.460 No longer linked to fuel. $1.450 $3.00 $3.20 $3.40 $3.60 $3.80 $4.00 $4.20 $4.40 $4.60 $4.80 $5.00 Fuel Cost per Gallon Source: Chainalytics 2009 Each point represents the average line haul cost per mile plotted against the cost of fuel for that week – from Oct 2008 to Sep 2009. 12 © Copyright 2009. Chainalytics, LLC.
  • 13. Fuel Impacts Empowering Fact-Based Decisions Across Your Supply Chain Fuel versus Linehaul Costs $1.70 Oct 2008 $1.65 Linehaul Cost ($/mile) $1.60 Oct 2006 July 2008 Nov $1.55 2007 Mar 2008 $1.50 $1.45 $2.25 $2.75 $3.25 $3.75 $4.25 $4.75 Cost of Fuel ($/gal) Longhaul Dry Van Longhaul Refrigerated Van 13 © Copyright 2009. Chainalytics, LLC.
  • 14. Fuel Surcharge Programs Empowering Fact-Based Decisions Across Your Supply Chain Parameters for TL FSC programs: Effective Fuel Surcharge Programs: Base or Peg Rate – Threshold cost of fuel per gallon LHD: $1.238 Base with $0.058 Escalator and $0.01 Surcharge Escalator – Increase in fuel costs that triggers surcharge LHR: $1.240 Base with $0.054 Escalator and $0.01 Surcharge Surcharge – Amount paid to carrier in dollars per mile LHI: $1.258 Base with $0.066 Escalator and $0.01 Surcharge Impact of FSC Programs $0.80 FSC Paid to Carrier ($/mile) $0.70 $0.60 $0.50 $0.40 $0.30 $0.20 $0.10 $- $(0.10) $2.00 $2.25 $2.50 $2.75 $3.00 $3.25 $3.50 $3.75 $4.00 $4.25 $4.50 Cost of Fuel ($/gallon) Min 25th Median 75th Max 14 © Copyright 2009. Chainalytics, LLC.
  • 15. Fuel Impact on Benchmark Empowering Fact-Based Decisions Across Your Supply Chain • How does a shipper’s FSC program influence line haul rates? – Two Schools of Thought: Compensating or Independent Line Haul = $1.20 FSC = $0.34 Line Haul = $1.20 FSC = $0.34 Shipper A: Line Haul = $1.26 FSC = $0.28 Line Haul = $1.20 FSC = $0.28 Shipper B: Shipper A = Shipper B Total Cost = $1.54 e sent as ping requests to other nodes. $1.48 Case 1: LH and FSC Compensate Case 2: LH and FSC are Independent • Previous Analysis – Prior to this model, FSC programs mainly varied with respect to the Escalator. – In Model 1 of 2008 we found that shippers with a $0.06 Escalator paid had higher line haul rates (~$0.125 per mile) than shippers with a $0.05 Escalator. – This year – there was greater variability across all dimensions. Direct comparisons of programs proved inconclusive. 15 © Copyright 2009. Chainalytics, LLC.
  • 16. Conclusions Empowering Fact-Based Decisions Across Your Supply Chain • The more shippers expose in the Fuel Surcharge bucket the better off they are, in total rate paid – Keep the peg or base low – Keep the escalator in line with estimated fuel efficiency • The overall impact of your FSC program is only about 1%-2% of the total rate paid • Predicting the future price of fuel is futile – Create a fair FSC and stick to it 16 © Copyright 2009. Chainalytics, LLC.
  • 17. Empowering Fact-Based Decisions Across Your Supply Chain Best Practices in Transportation Procurement Gary Girotti Vice President Chainalytics LLC Dr. Chris Caplice Executive Director MIT Center for Transportation & Logistics March 3, 2009 17 © Copyright 2009. Chainalytics, LLC.