1. Brian Piper
(Bentley University, MBA, Marketing Candidate)
RSA Experiential Marketing
Advisor/Manager: Linda Gray
Abstract
The purpose of this project was to utilize the RSA® Conference 2014 Personas Conference
Attendees Only Report in conjunction with Google Analytics to determine online
engagement and thus marketing opportunity by persona segment related to RSA
Conference 2014. By identifying rsaconference.com unique visitor demographic
information, an online market size was able to be outlined. Audience age, gender and
location were used to define persona segments present online based on the personas
identified at conference. It was found that 63.12% of conference attendees had an
online presence, while conference attendees accounted for a total 3.34% of all online
users in Q1-Q2 2014. Online visitors were typically of a younger, largely U.S. & China
based demographic. While overall online engagement was highest in the 25-34 age
group, the largest ratio of returning online visitors to new online visitors was found in the
45-54 age group. A total untapped market of site users (those not having attended
conference, but engaged online) fitting the profiles identified at RSA Conference 2014
was found to be 31.2% of all online users.
Introduction
The RSA Conference 2014 Persona Report (referred to as RSAC 2014 Personas) had been
compiled by a third-party vendor, Exhibit Surveys to identify segmentation groups of
conference attendees. A post-event survey was designed by Exhibit Surveys and garnered
an array of responses which were then cross referenced and categorized into four
identified personas: Newbies (32% of attendees), Veterans (25% of attendees), Embracers
(24% of attendees) & Hermits (19% of attendees).
Rsaconference.com is primarily used to promote and collect registrations for RSA
Conference, and to publish content to increase engagement between conferences
including: blogs, videos & podcasts.
Previously, Google Analytics coding had been organized on the rsaconference.com
website, but a method of data collection had not yet been established. Data is filterable
by date range, demographic and viewed web content allowing both high level and drilled
down reporting capabilities.
Project Objectives
Data from both RSAC 2014 Personas and rsaconference.com (via Google Analytics) was
gleaned to determine market size and online engagement. Goals were to identify a
market size in the RSA Conference online market space, nature of online behavior, and
segmentation as it related to RSA Conference 2014 attendance demographics.
Methods/Process
Google Analytics demographic data was compiled as percentages of unique users (as Google Analytics utilizes sampling for all drilled-
down reporting). Proportions of users within 10-year age groups, users by gender and users by location were extracted. In-market
segment data (based on users’ Google searches) was available, but proved not to be a worthwhile indicator of industry as Google
searches don’t always pertain to the users’ industry segment. Date ranges used were Q1 – Q2 of 2014 (Jan. 1 – Jun. 30).
Online proportions were divided out by age group and within each, proportions of gender and location were tabulated in Microsoft
Excel. These were then divided out into two groups: new users and returning users (as a basic qualifier of engagement). Proportions of
conference attendees in each persona published in RSAC 2014 Personas were also included in Microsoft Excel. For each online age
group, the gender (Male, Female) and location (U.S., International) proportions were each multiplied by the corresponding proportion
from each conference attendee persona. By overlaying the quantities from both data sources (RSAC 2014 Personas & Google Analytics),
an online market size was established for each persona.
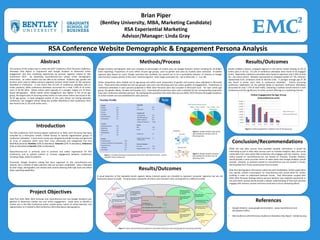
Results/Outcomes
Results yielded a distinct untapped segment in the online market totaling 31.2% of
online users in Q1-Q2. 63.12% of conference attendees were found to be engaged
online. Oppositely conference attendees were found to represent only 3.34% of total
Q1 – Q2 online visitors. Newbies represented an untapped market of 7.5%, Veterans
represented 8.5%, Embracers 8.6% & Hermits 6.6%. A younger average age of 38
was found in online users than in conference attendees. Visitors accessing
conference registration via the website (likely to represent conference attendees)
accounted for only 7.17% of total traffic, indicating a marked overall interest in RSA
Conference and the significance of online content offerings as a marketing channel.
Conclusion/Recommendations
While the two data sources here provided valuable information, it would be
interesting to pull in other data sources such as Youtube Analytics data, and social
media data from sites where RSA Conference also engages with the industry. Since
videos posted on rsaconference.com are hosted on Youtube, Youtube Analytics
would provide a more accurate metric of video views than Google Analytics would
provide. Likewise, as podcasts posted on rsaconference.com are hosted in iTunes,
deriving data from iTunes would prove more accurate.
Now that demographic information online has been established, further exploration
into specific content consumption on rsaconference.com would allow for further
profiling in order to understand behavior trends. That information coupled with
RSAC 2014 Personas findings (where persona behavior was explicitly questioned in
the post-event survey) would provide a deeper understanding of how each persona
engages with industry content and hence how best to focus marketing efforts.
Results/Outcomes
A visual depiction of the tabulated results appears below (colored spaces are intended to represent consumer segments but are not
necessarily drawn to scale). The gray space represents all online users and each color corresponds to a different profile.
References
• Google Analytics. www.google.com/analytics. www.rsaconference.com
(all website traffic).
• RSA Conference 2014 Personas Conference Attendees Only Report. Exhibit Surveys.
RSA Conference Website Demographic & Engagement Persona Analysis
Figure 1. Example of persona measurement data from RSAC 2014 Personas used to
establish online market size.
Figure 2. Google Analytics age group
data divided out by New Users &
Returning Users.
Figure 3. Google Analytics location
data divided out by New Users &
Returning Users.
Figure 4. Visual representation of conference and online market size with average age for each group indicated
Figure 5. Online engagement is highest in the 25-34 age group.