Asian Outbound Investment H1 2017
•
1 recomendación•288 vistas

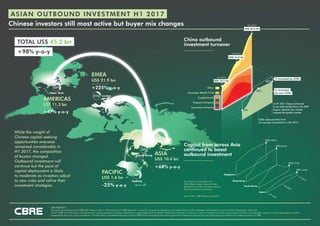
International real estate continues to serve as an attractive asset class for investors, with Asian outbound investment into the sector posting significant year-on-year gains. In H1 2017, Asian cross-border investment surged by 98% y-o-y to US$ 45.2 billion.
Denunciar
Compartir
Denunciar
Compartir
Descargar para leer sin conexión
Recomendados
Recomendados
Más contenido relacionado
Destacado
Destacado (7)
Mô tả nghề nhân viên điều độ, khai thác bay (Dispatcher)
Mô tả nghề nhân viên điều độ, khai thác bay (Dispatcher)
Similar a Asian Outbound Investment H1 2017
Similar a Asian Outbound Investment H1 2017 (20)
Venture Capital Deals & Exits 2017 REV Partners Jan 2018
Venture Capital Deals & Exits 2017 REV Partners Jan 2018
Asia HealthTech Investment Landscape 2017 Full Year report
Asia HealthTech Investment Landscape 2017 Full Year report
Hotels Hospitality Group Hotel Investment OutLook 2017 JLL
Hotels Hospitality Group Hotel Investment OutLook 2017 JLL
Último
Último (20)
Girls in Kalyanpuri }Delhi↫8447779280↬Escort Service. In Delhi NCR
Girls in Kalyanpuri }Delhi↫8447779280↬Escort Service. In Delhi NCR
Maha Mauka Squarefeet Brochure |Maha Mauka Squarefeet PDF Brochure|
Maha Mauka Squarefeet Brochure |Maha Mauka Squarefeet PDF Brochure|
Shapoorji Pallonji Joyville Vista Pune | Spend Your Family Time Together
Shapoorji Pallonji Joyville Vista Pune | Spend Your Family Time Together
9990771857 Call Girls in Dwarka Sector 6 Delhi (Call Girls) Delhi
9990771857 Call Girls in Dwarka Sector 6 Delhi (Call Girls) Delhi
Properties for Sale in Istanbul with Schools and Parks | Antalya Development
Properties for Sale in Istanbul with Schools and Parks | Antalya Development
9990771857 Call Girls Dwarka Sector 9 Delhi (Call Girls ) Delhi
9990771857 Call Girls Dwarka Sector 9 Delhi (Call Girls ) Delhi
Low Rate ↬Call Girls in Trilokpuri Delhi ↫8447779280}Escorts Service In Delhi
Low Rate ↬Call Girls in Trilokpuri Delhi ↫8447779280}Escorts Service In Delhi
TENANT SCREENING REPORT SERVICES How Tenant Screening Reports Work
TENANT SCREENING REPORT SERVICES How Tenant Screening Reports Work
9990771857 Call Girls in Dwarka Sector 1 Delhi (Call Girls) Delhi
9990771857 Call Girls in Dwarka Sector 1 Delhi (Call Girls) Delhi
Call girls in new Ashok NagarDelhi꧁ 8447779280꧂ Escort Service Women Seeking ...
Call girls in new Ashok NagarDelhi꧁ 8447779280꧂ Escort Service Women Seeking ...
Call Girls in Karkardooma Delhi +91 84487779280}Woman Seeking Man in Delhi NCR
Call Girls in Karkardooma Delhi +91 84487779280}Woman Seeking Man in Delhi NCR
9990771857 Call Girls in Dwarka Sector 3 Delhi (Call Girls) Delhi
9990771857 Call Girls in Dwarka Sector 3 Delhi (Call Girls) Delhi
9990771857 Call Girls in Dwarka Sector 7 Delhi (Call Girls) Delhi
9990771857 Call Girls in Dwarka Sector 7 Delhi (Call Girls) Delhi
9990771857 Call Girls in Dwarka Sector 137 Noida (Call Girls) Delhi
9990771857 Call Girls in Dwarka Sector 137 Noida (Call Girls) Delhi
Asian Outbound Investment H1 2017
- 1. Chinese investors still most active but buyer mix changes CBRE RESEARCH This report was prepared by the CBRE APAC Research Team, which forms part of CBRE Research – a network of preeminent researchers who collaborate to provide real estate market research and econometric forecasting to real estate. © 2017 CBRE, Inc. Information contained herein, including projections, has been obtained from sources believed to be reliable. While we do not doubt its accuracy, we have not verified it and make no guarantee, warranty or representation about it. It is your responsibility to confirm independently its accuracy and completeness. This information is presented exclusively for use by CBRE clients and professionals and all rights to the material are reserved and cannot be reproduced without prior written permission of CBRE. Capital from across Asia continued to boost outbound investment China outbound investment turnover EMEA US$ 21.9 bn +225% y-o-y ASIA US$ 10.4 bn +68% y-o-y PACIFIC US$ 1.6 bn -25% y-o-y While the weight of Chinese capital seeking opportunities overseas remained considerable in H1 2017, the composition of buyers changed. Outbound investment will continue but the pace of capital deployment is likely to moderate as investors adjust to new rules and refine their investment strategies. Insurance Company Property Company Conglomerate Sovereign Wealth Fund Other AMERICAS US$ 11.3 bn +47% y-o-y 55% 87% ASIAN OUTBOUND INVESTMENT H1 2017 SOEs reduced their level of overseas acquisitions in H2 2016 In H1 2017, there continued to be solid activity from non-SOE buyers. Several new names entered the global market. 21% 22% 38% London Hong Kong Sydney New York 88% H1 2016 H2 2016 H1 2017 Hong Kong Singapore South Korea Japan US$ 6.8 bn US$ 6.6 bn US$ 2.9 bn US$ 1.3 bn Transactions include deals in the Office, Retail, Mixed, Industrial, Hotel, Residential and Other commercial sectors. Development sites are excluded. Source: RCA, CBRE Research, Aug 2017 US$ 25.6 bn H1 2017 US$ 16.9 bn H2 2016 H1 2016 32% US$ 10.1 bn % Invested by SOEs % Invested by non-SOEs TOTAL US$ 45.2 bn +98% y-o-y