
Recomendados
Recomendados
Más contenido relacionado
Similar a Regional Check-Up 2018
Similar a Regional Check-Up 2018 (20)
Más de CPABC
Último
Último (20)
Regional Check-Up 2018
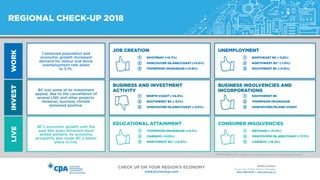
- 1. Media Contact Vivian Tse, Public Affairs Manager 604.488.2647 | vtse@bccpa.ca Check Up On your Region’s Economy www.bccheckup.com Continued population and economic growth increased demand for labour and drove unemployment rate down to 5.1%. BC lost some of its investment appeal, due to the cancellation of several LNG and other projects. However, business climate remained positive. BC’s economic growth over the past few years attracted more skilled workers. Its economic prosperity also made BC a better place to live. Kootenay (+6.7%) Vancouver Island/Coast (+5.5%) Thompson-Okanagan (+4.6%) 1 2 3 1 2 3 1 2 3 1 2 3 1 2 3 1 2 3 North Coast (-14.4%) Southwest BC (-3.1%) Vancouver Island/Coast (-3.0%) Thompson-Okanagan (+4.1%) Cariboo (+3.9%) Northwest BC* (+2.9%) Northeast BC (-3.8%) Northwest BC* (-1.9%) Southwest BC (-0.9%) southwest bc Thompson-Okanagan Vancouver/Island Coast Nechako (-27.3%) Vancouver Island/Coast (-17.1%) Cariboo (-16.3%) Job creation Business and investment activity Business Insolvencies and incorporations Educational Attainment Unemployment Consumer Insolvencies INVESTLIVEWORK Regional check-up 2018 *Northwest BC is made up of the Nechako andNorth Coast development regions.
- 2. Media Contact Vivian Tse, Public Affairs Manager 604.488.2647 | vtse@bccpa.ca Check Up On your Region’s Economy www.bccheckup.com Job Creation Highlights Job creation points to the number of jobs created or lost in a year. It indicates whether the economy is expanding or contracting. BC’S employment Grew By 87,300 jobs In 2017, reaching a total of 2.47 Million Northeast BC was the only region to experience an overall job loss in BC, as it continues to be impacted by stalled oil and gas and other resources based projects in the region. Thompson-Okanagan’s labour market expanded to 259,700 jobs in 2017, a new record for the region. Southwest BC accounted for the majority of job gains in BC, largely due to housing and consumer spending activity. Gains were largely driven by real estate and consumer spending activity. *Northwest BC is made up of the Nechako andNorth Coast development regions. Goods: + 300 Jobs Services: + 4,300 Jobs Kootenay Goods: - 2,400 Jobs Services: + 4,600 Jobs Cariboo Goods: + 1,900 Jobs Services: - 1,500 Jobs Northwest BC* Goods: - 200 Jobs Services: - 400 Jobs Northeast BC Goods: + 15,400 Jobs Services: + 33,800 Jobs SOUTHWEST BC Goods: + 1,000 Jobs Services: + 10,400 Jobs Thompson- okanagan Goods: + 5,300 Jobs Services: + 10,400 Jobs Vancouver ISLAND/COAST
- 3. Media Contact Vivian Tse, Public Affairs Manager 604.488.2647 | vtse@bccpa.ca Check Up On your Region’s Economy www.bccheckup.com Highlights Southwest BC and Vancouver Island/ Coast’s unemployment rates are below the provincial average. Northeast BC saw the largest decline in its unemployment rate, from 9.7% to 5.9%. This is likely due to an exit of workers from the labour force, as the region experienced an overall job loss in 2017. Only Cariboo’s unemployment rate remained the same, while other regions saw declines in the unemployment rate. SOUTHWEST bc NorthWest bc* NorthEast bc Kootenay CaribooVancouver Island/coast Thompson- Okanagan BC’s Unemployment Rate Fell to 5.1% 4.6% 5.0% 5.8% 5.9% 7.1% 7.3% 7.4% 5.1% BC AVERAGE -0.9% -0.8% -1.9% -3.8% -0.7% -0.7% NO CHANGE *Northwest BC is made up of the Nechako andNorth Coast development regions. Unemployment Unemployment rate is defined as the share of the workforce that is unemployed while actively seeking employment and willing to work.
- 4. Media Contact Vivian Tse, Public Affairs Manager 604.488.2647 | vtse@bccpa.ca Check Up On your Region’s Economy www.bccheckup.com Business and investment activity Highlights Major Project Activity in BC Total Cost of all major projects $402.6 Billion (-8.0%) Other Investment activity in bc Three projects worth $10.6 billion in total were Cancelled in Q4 2017: Capital investment in non-residential construction: $1.6 billion (+4.8%) Venture capital investment: $646 Million (91 deals) 1 Malahat LNG 2 Prince Rupert LNG 3 BC LNG New proposed Projects worth $1.67 Billion Capital investment lays the foundation for economic productivity. This in turn ignites long-term job creation and economic development. $7.2 billion (No Change) $9.1 billion (+0.2%) $39.1 billion (+4.6%) Nechako Kootenay Northeast BC $58.7 billion (-3.0%)$187.1 billion (-14.4%) $10.2 billion (-2.1%) $69.7 billion (-3.1%) $21.4 billion (-2.0%) Cariboo Southwest BC North Coast Thompson- okanagan Vancouver Island/coast
- 5. Media Contact Vivian Tse, Public Affairs Manager 604.488.2647 | vtse@bccpa.ca Check Up On your Region’s Economy www.bccheckup.com business insolvencies and incorporations Highlights The trend in the number of business insolvencies and incorporations is an indicator of investment and market conditions for entrepreneurs. BC business insolvencies fell by 27.1% while business incorporations increased by 6.2% indicating a more stable climate Northeast BC has had its ups and downs in terms of business incorporations, due to economic fluctuations, but business insolvencies have remained relatively low, indicating some stability. The challenges faced by Cariboo’s forestry industry in 2017 may have contributed to the increase in business insolvencies. Over the past 5 years, Thompson- Okanagan’s business insolvencies fell by almost 75% while incorporations increased by almost 37%, reflecting business confidence and optimism. North Coast southwest bc -19 -1 -5 -1 +2 -15-1 -9-28 +85 +33 +24 -7 +200 +142 +2,242 cariboo Northeast BC kootenay nechako thompson- okanagan Vancouver Island/Coast Number of Business Insolvencies vs. Business Incorporations (Change in Number of Reports 2016 - 2017) Insolvencies Incorporations
- 6. Media Contact Vivian Tse, Public Affairs Manager 604.488.2647 | vtse@bccpa.ca Check Up On your Region’s Economy www.bccheckup.com Highlights Educational Attainment kootenay Cariboo Northeast bcNorthwest bC*SouthWest bc Vancouver Island/coast Thompson- okanagan 73.8% 68.2% 67.9% 65.8% 65.8% 63.5% 2.4% 1.5% 4.1% 1.9% 2.9% 71.4% BC AVERAGE 3.9% 2.2% 56% Vancouver Island/Coast experienced a second consecutive year of decline in terms of educational attainment. This is surprising as the region’s tech industry continues to grow. Thompson-Okanagan’s educational attainment has fluctuated over the past 5 years, but has trended upwards as its economy increasingly expands and diversifies. BC’s labour force has become increasingly more educated over the past 15 years due to the evolution of the knowledge economy. *Northwest BC is made up of the Nechako andNorth Coast development regions. The educational attainment of BC’s labour forces (aged 25-54) Improved by 2.0% Post-secondary education lays the foundation for worker productivity and long-term gains for the individual and society as a whole.
- 7. Media Contact Vivian Tse, Public Affairs Manager 604.488.2647 | vtse@bccpa.ca Check Up On your Region’s Economy www.bccheckup.com Highlights Consumer Insolvencies nechako 1.6 PER 1,000 ADULTS 3.0 PER 1,000 ADULTS 2.9 PER 1,000 ADULTS 3.8 PER 1,000 ADULTS 3.6 PER 1,000 ADULTS 2.7 PER 1,000 ADULTS 2.2 PER 1,000 ADULTS 2.0 PER 1,000 ADULTS northeast bc Thompson- Okanagan vancouver island/coast kootenaycariboo north coastsouthwest bc Northwest BC enjoyed the lowest rates of consumer insolvency in BC over the past 5 years, which could be due to the relative affordability of housing in the region. Northeast BC is the only region to see an increase in the number of consumer insolvencies over the past 5 years. Cariboo had one of the highest consumer insolvency rates since 2012, driven by significant debt loads, layoffs in the region’s mining industry, and a decline in major project activity. For the past 5 years, BC’s consumer insolvency rate has progressively improved. The rate of consumer insolvency in BC fell by 10.7% Number of consumer insolvencies (Change 2016 - 2017) -27.3% -17.1% -16.3% -8.3% -6.3% -6.3% NO CHANGE +33.3% The consumer insolvency rate is the number of personal insolvencies per 1,000 adults and reflects the outcome of change in economic status, indebtedness or the credit market.