Infographic - Croatia - 2013 Annual Report on the State of Philanthropy
•
0 recomendaciones•394 vistas

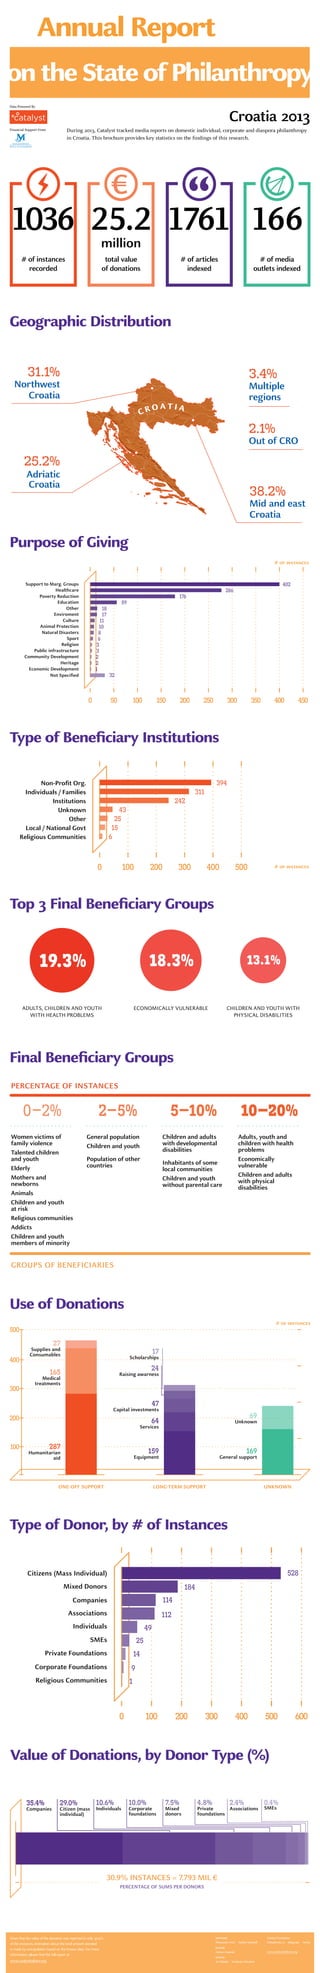
This document summarizes data on philanthropy in Croatia in 2013, including the geographic distribution of donations, types of donor and beneficiary institutions, top beneficiary groups, and uses of donations. The top three final beneficiary groups were adults, children and youth with health problems (19.3% of instances), economically vulnerable people (18.3%), and children and youth with physical disabilities (13.1%). Religious communities accounted for the largest share of donations by value (35.4%), followed by companies (29%) and individual citizens (10.6%). The total value of donations recorded was 16625.2 million kuna.
Recomendados

Recomendados
Más contenido relacionado
La actualidad más candente
La actualidad más candente (20)
Similar a Infographic - Croatia - 2013 Annual Report on the State of Philanthropy
Similar a Infographic - Croatia - 2013 Annual Report on the State of Philanthropy (20)
Más de Catalyst Balkans
Más de Catalyst Balkans (20)
Último
Último (20)
Infographic - Croatia - 2013 Annual Report on the State of Philanthropy
- 1. Geographic Distribution Purpose of Giving Type of Beneficiary Institutions Top 3 Final Beneficiary Groups Final Beneficiary Groups Use of Donations Type of Donor, by # of Instances Value of Donations, by Donor Type (%) Support to Marg. Groups Healthcare Poverty Reduction Education Other Enviroment Culture Animal Protection Natural Disasters Sport Religion Public infrastructure Community Development 0 50 100 150 200 250 300 Heritage 350 400 Economic Development 402 286 176 59 18 17 11 10 8 6 3 3 2 1 32Not Specified 450 2 Non-Profit Org. Individuals / Families Institutions Unknown Other Local / National Govt Religious Communities 0 100 200 300 400 500 394 311 242 43 25 15 6 0–2% 2–5% 5–10% 10–20% Women victims of family violence Talented children and youth Elderly Mothers and newborns Animals Children and youth at risk Religious communities Addicts Children and youth members of minority General population Children and youth Population of other countries Children and adults with developmental disabilities Inhabitants of some local communities Children and youth without parental care Adults, youth and children with health problems Economically vulnerable Children and adults with physical disabilities PERCENTAGE OF INSTANCES GROUPS OF BENEFICIARIES 27 Supplies and Consumables 17 Scholarships 24 Raising awarness 64 Services 47 Capital investments 69 Unknown 169 General support 287 Humanitarian aid 100 200 400 500 ONE-OFF SUPPORT LONG-TERM SUPPORT UNKNOWN 165 Medical treatments 159 Equipment 300 Mixed Donors Companies Citizens (Mass Individual) Associations Individuals SMEs Private Foundations Corporate Foundations 0 100 200 300 400 500 528 184 114 112 49 25 9 14 1 600 Religious Communities 35.4% Companies 29.0% Citizen (mass individual) 10.6% Individuals 10.0% Corporate foundations 7.5% Mixed donors 4.8% Private foundations 2.4% Associations 30.9% INSTANCES = 7.793 MIL € PERCENTAGE OF SUMS PER DONORS 0.4% SMEs C R O A T I A 31.1% Northwest Croatia 3.4% Multiple regions 25.2% Adriatic Croatia 2.1% Out of CRO 38.2% Mid and east Croatia 1761 16625.2million 1036 # of instances recorded # of articles indexed # of media outlets indexed total value of donations Annual Report on the State of Philanthropy 1761 16625.2 million 1036 # of instances recorded # of articles indexed # of media outlets indexed total value of donations 19.3% 18.3% 13.1% ADULTS, CHILDREN AND YOUTH WITH HEALTH PROBLEMS ECONOMICALLY VULNERABLE CHILDREN AND YOUTH WITH PHYSICAL DISABILITIES Croatia 2013 # of instances # of instances # of instances Catalyst Foundation Makedonska 21 Belegrade Serbia www.catalystbalkans.org authors Aleksandra Vesić Nathan Koeshall editor Nathan Koeshall design Ivo Matejin Fondacija Dokukino During 2013, Catalyst tracked media reports on domestic individual, corporate and diaspora philanthropy in Croatia. This brochure provides key statistics on the findings of this research. Given that the value of the donation was reported in only 30.9% of the instances, estimation about the total amount donated is made by extrapolation based on the known data. For more information, please find the full report at www.catalystbalkans.org Data Powered By Financial Support From