SlideShare una empresa de Scribd logo
1 de 45
Descargar para leer sin conexión
INDUSTRIAL PROJECT IV
Nguari Cedrick Mbu
5709-349-0
IPR401E
FINAL REPORT
THE APPLICATION OF A PROGRAMMABLE LOGIC
CONTROLLER (PLC) TO CONSERVE AND OPTIMISE
THE USE OF ELECTRICAL ENERGY IN DOMESTIC AND
INDUSTRIAL APPLICATIONS
Final Report 5709-349-0
1
THE APPLICATION OF A PROGRAMMABLE LOGIC
CONTROLLER (PLC) TO CONSERVE AND OPTIMISE THE USE
OF ELECTRICAL ENERGY IN DOMESTIC AND INDUSTRIAL
APPLICATIONS
Nguari Cedrick Mbu
Report submitted to the University of South Africa, UNISA, in fulfilment of
the requirements for the degree Bachelor of Technology Electrical
Engineering in the Faculty of Engineering at UNISA.
MENTOR: Mr. Almero du Pisani
SEPTEMBER 2015
Final Report 5709-349-0
2
Declaration of Own Work
I declare that this report is my own, unaided work. It is being submitted for the
baccalaureate Technology in Electrical Engineering in the Department of Electrical
Engineering at UNISA.It has not been submitted before for any degree, diploma,
assessment or other examination at any other tertiary educational institution.
Signed: by
at on this day of 2015
Mentor:
Signed: by
Final Report 5709-349-0
3
Acknowledgements
I would like to thank my mentor Mr. Almero Du Pisani for his tremendous contribution
with regard to the design and programming of the PLC. This project would not have
been possible without his help, guidance and experience. I am also grateful for the
opportunity and privilege to work on this project at Pretoria North Training Center.
In addition I would like to thank my parents and Juresse Kifuta my friend for their
support and guidance over the years.
Finally I would like to thank the Electrical Engineering Department at UNISA and my
study group members for their helps, suggestions and corrections which have had a
direct impact on the quality of the content.
Final Report 5709-349-0
4
Abstract
As it is impossible to document every detail, the aim of this final report is to highlight a
number of the various aspects involved in this particular design project. The aim of this
research project is to design a system that will automatically conserve energy in
domestic or industrial applications by intelligently controlling illumination in any
building.
Section 1 is a brief introduction and section 2 is a short discussion on the literature
survey.
Section 3 is the background theory, define and discuss different types of lighting
systems. Highlight their advantages and disadvantages and the proposed solution.
Section 4 explains and analyze the working procedures of the PIR’s, PLC and the
Day/Night sensor.
Section 5 highlights the main concepts of the software and hardware design.
Section 6 states the results.
Section 7 analyses the results.
Section 8 discusses the results.
Section 9 discusses the valuable lessons learned from this project and additional
recommendations.
Final Report 5709-349-0
5
Table of contents Page
List of figures…………………………………………………………………………………………..……1
List of tables…………………………………………………….………………………………………...….2
List of abbreviations............................................................................................…...3
1. Introduction……………………………………………………………………………………………….4
2. Literature survey……………………………………………………………………………………..…5
3. Background theory…………………………………………………………………………………..…6
3.1 Definition of a lighting system…………………………………………………………………..7
3.2 Overview of a lighting system for energy savings……………………………..…………8
3.3 Evaluation of various concepts of energy saving opportunities with efficient
Lighting………………………………………………………………………………………………….9
3.4 Proposed solution………………………………………………………………………..…………10
4. Detailed design………………………………………………………………………………..…………11
4.1 Introduction……………………………………………………………………………….………….12
4.2 Klockner Moeller…………………………………………………………………………….……..13
4.3 PIR sensors…………………………………………………………………………………….……..14
4.4 Day/Night sensor.........................................................................................…...15
4.5 Software implemented…………………………………………………………………………...16
5. Experimental evaluation………………………………………………….………………………..17
5.1 Software part………………………………………………………………………….……………….18
5.2 Hardware part………………………………………………………………………….……………..19
6. Results…………………………………………………………………………………………………………20
7. Analysis of results……………………………………………………………………………………….21
Final Report 5709-349-0
6
8. Discussion………………………………………………………………………….……………………....22
9. Conclusion and recommendations…………………………………………………………...23
10. Bibliography………………………………………………………………………………………………24
11. Appendices……………………………………………………………………………………..………….25
Final Report 5709-349-0
7
List of figures Page
Figure 3.1 A simple lighting system…………………………………………………………………….1
Figure 3.2 Different types of energy efficient fluorescent lamps……………………………2
Figure 3.3 the T labeled fluorescent lamps…………………………………………….…………….3
Figure 3.4 the components of a fluorescent lamp……………………….………………………..4
Figure 3.5 Exit signs made of LEDs…………………………………………………………………….5
Figure 4.1 The project schematic…………………………………………………………………….…..6
Figure 4.2 Klockner Moeller PLCs…………………………………………………………………….…7
Figure 4.3 PIR PCBs both sides……………………………………………………………………………8
Figure 4.4 The Pyroelectric sensor……………………………………………….……………………..8
Figure 4.5 The older PIR…………………………………………………………………………………….7
Figure 4.6 The new PIR……………………………………………………………………………….……..9
Figure 4.7 PIR detecting procedures…………………………………………………………………….9
Figure 4.8 The element window, the two pieces of sensing material......................…...7
Figure 4.9 The internal schematic of the PIR sensor……………….……………………………..9
Figure 4.10 The Fresnel lens condenses light providing a larger range of IR
to the sensor………………………………………………………………………………………………………9
Figure 4.11 The Fresnel lens provides a larger range of IR to the sensor……………..…..5
Figure 4.12 The focal length of the IR…………………………………………………………………….5
Figure 4.13 The Multiple facet sections………………………………………………………………….9
Figure 4.14 A macro shot showing the different Fresnel lenses in each facet…………….9
Figure 4.15 Different angles of the Fresnel lenses……..……………………………………………8
Figure 4.16 PIR test schematic……………………………………………………………………………..9
Figure 4.17 PIR test wiring…………………………………………………………..………………………8
Figure 4.18 Back of the PIR with the jumper in the L position…………………….…………..9
Figure 4.19 Graph showing the non-retriggering option of the PIR……………….………..7
Figure 4.20 Graph showing the retriggering option of the PIR…………………………….…9
Figure 4.21 Back of the PIR showing the jumper in H position………………….…………….9
Figure 4.22 The trimpot of a PIR for changing sensitivity………………………………..……..8
Figure 4.23 Connecting a PIR to a Microcontroller………………………………………………….7
Figure 4.24 Day/Night sensor wiring diagram……………………………………………………….9
Figure 5.1 Ladder programming……………………………………………………….……………………9
Figure 5.2 Day/Night sensor………………………………………………………………………………….6
Figure 5.3 Day/Night sensor………………………………………………………………………………….8
Figure 5.4 Programmed PLC for hardware wiring………………………………………….………9
Figure 5.5 The wiring diagram…………………………………………………….………………………..8
Figure 5.6 External relay…………………………………………………………………….…………………0
Figure 5.7 12V DC supply for the PIR………………………………………………………….…………..0
Figure 5.8 Resistor connected to the live………………………………….………………………………8
Figure 5.9 An open PIR………………………………………….………………………………………………8
Figure 5.10 PIR……………………….…………………………………………………………………………….7
Figure 5.11 Day/Night sensor………………………………………..……………………………………….9
Figure 5.12 The complete project……………………………………………………………………………10
Final Report 5709-349-0
8
List of tables Page
Table 3.1 The lumen output of incandescent bulbs……………………………………………..9
Table 3.2 Comparison of the three models of exit signs………………………………………9
List of abbreviations
A-Amp
AC-Alternating Current
CCD-Charge-Coupled Device
CFL-Compact Fluorescent Lamps
CRI-Colour Rendering Index
DC-Direct Current
D/N-Day/Night sensor
EPA-Environmental Protection Agency
FSR-Force Sensing Resistor
IC-Integrated circuit
IR-InfraRed
JFET-Junction Field Effect Transistor
K-degree Kelvin
KWH-KiloWatt/Hour
L-Live
LED-Light Emitting Diode
N-Neutral
PCB-Printed Circuit Board
PIR-Passive InfraRed
PLC-Programmable Logic Controller
PSU-Power Supply Unit
R-Rands
RH-Relative Humidity
V-Volt
Final Report 5709-349-0
9
1. Introduction
There are various different motivations or reasons to improve energy efficiency.
Reducing energy use reduces energy costs and may result in a financial cost saving
benefit to consumers if the energy savings offset any additional costs to
implementing energy efficient technology. Reducing energy use is also seen as a key
solution to the problem of reducing polluting emissions. According to the
International Energy Agency, improved energy efficiency in buildings, industrial
processes and transportation could reduce the world’s energy need in 2050 by one
third, and help control global emissions of harmful gases.
Energy efficiency and renewable energy are said to be the twin pillars of sustainable
energy policy. In many countries energy efficiency is also seen to have a national
security benefit because it can be used to reduce the level of energy imports from
foreign countries and may slow down the rate at which domestic energy resources
are depleted. To keep our planet in this condition for future generations, we all need
to look at how we use energy.
In South Africa the demand for electricity is much higher than what the National
supplier is able to supply in peak hours and that leads to regular load shedding
throughout the country.
In many towns and cities lights are left on in buildings 24 hours a day, irrespective
0f people needing the illumination or not. Load shedding is experienced almost
everyday.
The aim of this research project is to design a system that will automatically conserve
energy in domestic or industrial applications by intelligently controlling
illumination in any building.
In this project the objective is to identify criteria, design and develop a software,
program and implement a programmable logic controller (PLC) system to control
the lightning system of a certain building.
By implementing this project, we envisage a minimum reduction of 20% in the
electricity consumption. This will directly benefit the population of South Africa
and Eskom as a utility provider. Eskom has warned that without additional funding
to buy diesel, load shedding will be continuous and ongoing because the utility will
not be able to operate its open gas turbines. At the moment Eskom requested an
increase of 25% which will have a very negative influence on the economy and
people of South Africa.
This is not a new concept but the introduction of PIRs and the Day/Night sensor
makes it different from other energy saving projects with PLCs.
Final Report 5709-349-0
10
2. Literature Survey
1. The preliminary literature survey or study consisted of research on the
Internet, technical journals, data sheets, product and service manuals, textbooks
and other printed publications.
2. The first step was to define the Inputs to the PLC and how they operate. This
was accomplished by referring to any available circuit diagrams, service and
operators’ manuals and the internet. It was also beneficial to gain some
understanding on the PIRs and the Day/Night sensor.
3. Choice of a programming language for the PLC was the next logical step. A
choice needed to be made between different types of PLC’s programming
language. The ladder diagram was the chosen one because of it is the
programming language that approaches the structure of an electric circuit.
4. The next step was the selection of a PLC.Klockner Moeller PLC was selected
because of its easier programming using LCD display.
3. Background Theory
3.1 Definition of a lighting system
A lighting system is defined as all of the components necessary to meet the
requirements for illumination. This includes all components from the supply and the
switch that control the power to the lamps all the way to the reflectance of the space
in which the lighting system operates.
Figure 3.1 A simple lighting system
Final Report 5709-349-0
11
3.2 Overview of a Lighting System for Energy savings
The first consideration when examining lighting systems for energy savings
opportunities must always be the requirement for illumination, defined by:
• The duration of illumination required and,
• The level of illumination required.
The lighting system must be designed and operated to meet the need for illumination
at the lowest expenditure of energy.
The quality of the light is also an important consideration in meeting the need. There
are two characteristics of the light source that define quality:
• Colour rendering index (CRI)
• Colour temperature.
Colour Rendering Index: CRI is a unit of measure that defines how well colours are
rendered by different illumination conditions in comparison to a standard (i.e. a
thermal radiator or daylight). CRI is calculated on a scale from 1-100 where a CRI of
100 would represent that all colour samples illuminated by a light source in
question, would appear to have the same colour as those same samples illuminated
by a reference source. To put it another way, low CRI causes colours to appear
washed out and perhaps even take on a different hue, and high CRI makes all colours
look natural and vibrant.
Colour Temperature describes certain colour characteristics of light sources. A
"blackbody" is a theoretical object which is a perfect radiator of visible light. As the
actual temperature of this blackbody is raised, it radiates energy in the visible range,
first red, changing to orange, white, and finally bluish white.
Colour temperature describes the colour of a light source by comparing it to the
colour of a blackbody radiator at a given temperature. For example, the colour
appearance of a halogen lamp is similar to a blackbody radiator heated to about
3000 degrees Kelvin. Therefore it is said that the halogen lamp has a colour
temperature of 3000 degrees K- which is considered to be a warm colour
temperature.
Though color temperature is not a measure of the physical temperature of the light
source, it does correspond to the physical temperature of the blackbody radiator
when the colour appearance is the same as the source being tested.
Final Report 5709-349-0
12
3.3 Evaluation of various Concepts of energy-saving opportunities
with efficient lighting
Electric lighting is a major energy consumer. Enormous energy savings are possible
using energy efficient equipment, effective controls, and careful design. Using less
electric lighting reduces heat gain, thus saving air-conditioning energy and
improving thermal comfort. Electric lighting design also strongly affects visual
performance and visual comfort by aiming to maintain adequate and appropriate
illumination while controlling reflection and glare.
Lighting is not just a high priority when considering hotel design; it is also a high-
return, low-risk investment. By installing new lighting technologies, hotels can
reduce the amount of electricity consumed and energy costs associated with lighting.
There are several types of energy efficient lighting and affordable lighting
technology. The following are a few examples of energy-saving opportunities with
efficient lighting.
1. INSTALLATION OF COMPACT FLUORESCENT LAMPS (CFLs`) IN PLACE OF
INCANDESCENT LAMPS.
Compact Fluorescent Lamps use a different, more advanced technology than
incandescent light bulbs and come in a range of styles and sizes based on brand and
purpose. They can replace regular, incandescent bulbs in almost any light fixture
including globe lamps for the bathroom vanity, lamps for recessed lighting,
dimming, and 3-way functionality lights. CFLs use about 2/3 less energy than
standard.
Incandescent bulbs, give the same amount of light, but CFL lamps can last 6 to 10
times longer. CFL prices range from R40 to R150 depending on the bulb, but you
save about R250 to R300 per bulb on energy during the lifetime of the bulb.
When looking to purchase CFLs to replace incandescent bulbs, compare the light
output, or Lumens, and not the watts. Watts refers to the amount of energy used, not
the amount of light. In other words, if the incandescent bulb you wish to replace is
60 Watts, this is equal to 800 Lumens. To get the same amount of light in a CFL, you
should look at a CFL that provides 800 Lumens or more (equal to about a 13 watt
fluorescent bulb). Use the table below to easily figure the conversions.
Final Report 5709-349-0
13
Table 3.1 The lumen output of incandescent bulbs
Incandescent bulb (watts) Typical lumens (measure of light
output)
40 > 450
60 > 800
75 > 1100
100 > 1600
150 > 2600
2. INSTALLATION OF ENERGY-EFFICIENT FLUORESCENT LAMPS IN PLACE OF
“CONVENTIONAL” FLUORESCENT LAMPS
Many lodging facilities may already use fluorescent lighting in their high traffic areas
such as the lobby or office area. However, not all fluorescent lamps are energy
efficient and cost effective. There are several types of fluorescent lamps that vary
depending on the duration of their lamp life, energy efficiency, regulated power, and
the quality of color it transmits.
Figure 3.2 Different types of energy-efficient fluorescent lamps
There are a few styles worth noting; these models are simply labeled as “T-12”, “T-8”, or
“T-5”. The names come from the size of their diameter per eighth inch. For example, a
T-12 lamp is 12/8 inch in diameter (or 1 1/2 inch); a T-8 lamp is 8/8 inch in diameter
(or 1 inch); a T-5 lamp is 5/8 inch in diameter. This is a simple way to identify the type
of fluorescent lamps your facility is using.
Final Report 5709-349-0
14
Figure 3.3 The T labeled fluorescent lamps
The recommended style of fluorescent lighting is a T-8. T-8 lights are the most cost-
effective. They usually cost about R9.9 a bulb and are 30% to 40% more efficient
than standard T-12 fluorescent lamps, which have poor color rendition and cause eye
strain. T-8 lamps provide more illumination, better color, and don't flicker (often
exhibited by standard fluorescent fixtures). T-5 lamps are the most energy efficient
and also tend to transmit the best color; however, they usually cost about R50 per
bulb.
Each style of fluorescent lamp cannot function without a ballast. A ballast is an
electrical device used in fluorescent lamps to regulate starting and operating
characteristics of the lamp. Some ballasts are magnetic where as others are
electronic. Electronic high frequency ballasts are now standard for most fluorescent
lights. Due to the differences in wattage between the types of lights, if converting
from a T-12 to a T-8 light, one must also change the type of ballast being used.
Figure 3.4 The components of a fluorescent lamp
Note: It is important to discard all styles of fluorescent lamps appropriately. Because
they contain a small amount of mercury, improper disposal could harm our soils or
lakes. Fluorescent bulbs should be recycled, not thrown away.
Final Report 5709-349-0
15
3. REPLACE ALL EXIT SIGNS WITH LIGHT EMITTING DIODE (LED) EXIT SIGNS.
The development of light emitting diodes (LEDs) has allowed the replacement of exit
sign lighting with a more energy efficient alternative. Multiple LEDs, properly
configured, produce equivalent lighting and consume 95% less electricity than
incandescent bulbs and 75% less than energy-efficient compact fluorescent lamps. A
major benefit is the 20-year life cycle rating of LEDs; they virtually eliminate
maintenance.
Figure 3.5 Exit signs made of LEDs
Of the three different styles of exit signs, incandescent signs are the least expensive, but
are inefficient and use energy releasing heat instead of light. Fluorescent signs are also
inexpensive and have an expected life of about 10,000 hours. LED exit signs are the
most expensive, but are also the most energy efficient exit signs available. Their payback
time is usually about four years. The table below offers an easy comparison of the three
models of exit signs.
Table 3.2 Comparison of the three models of exit signs
Incandescent Fluorescent LED
Input Power (watts) 40 11 2
Yearly energy (kwh) 350 96 18
Lamp Life (years) 0.25-0.5 1-2 10+
Estimated energy
cost/year (0,06/kwh)
R210 R57.5 R11
Final Report 5709-349-0
16
Note: Not all LED exit signs are the same. Some are of lower quality and decrease
their light output after a few years. Be sure to look for LED signs with semiconductor
material that is made of aluminum, indium, gallium, and phosphor. Also, some LED
signs have lights that are wired in a series circuit, meaning that when one LED light
burns out, the whole sign loses its light. Look for LED exit signs that are wired in a
parallel circuit.
3.4 Proposed Solution
Despite the significant savings that may be achieved through modifications to
lighting systems, inappropriate actions such as: The lack of switching off lights upon
leaving or the lack of switching off lights when day light is sufficient can have a far
more dramatic effect on worker and occupant productivity and comfort.
In order to optimize the energy saving of an illumination system, the right choice of
choosing the correct lamps for the specific application is only one aspect of electrical
energy conservation. A second important factor is to control the lights so that areas
where there are people must be illuminated while areas where there are no people
could be dark. In the rest of the study, I will design and develop a software program
for a programmable logic controller (PLC) system and the peripheral hardware to
control a lighting system for a building.
4. Detailed design
4.1 Introduction
A single floor office block with three main areas will be the basis for this design.
Figure 4.1 The project schematic
Final Report 5709-349-0
17
4.2 For this design a Klockner Moeller PLC was selected because:
Inputs and outputs are 230v
Low cost
Easier programming because of LCD display
Smart size
Relay isolated outputs
Figure 4.2 Klockner Moeller PLCs
4.3 PIR alarm sensors will be used 12v PSU
PIR sensors allow you to sense motion, almost always used to detect whether a human
has moved in or out of the sensors range. They are small, inexpensive, low-power, easy
to use and don't wear out. For that reason they are commonly found in appliances and
gadgets used in homes or businesses. They are often referred to as PIR, "Passive
Infrared", "Pyroelectric", or "IR motion" sensors.
Figure 4.3 PIR PCBs both sides
PIRs are basically made of a pyroelectric sensor (which you can see above as the round
metal can with a rectangular crystal in the center), which can detect levels of infrared
radiation. Everything emits some low level radiation, and the hotter something is, the
Final Report 5709-349-0
18
more radiation is emitted. The sensor in a motion detector is actually split in two halves.
The reason for that is that we are looking to detect motion (change) not average IR
levels. The two halves are wired up so that they cancel each other out. If one half sees
more or less IR radiation than the other, the output will swing high or low.
Figure 4.4 The pyroelectric sensor
The older PIRs looked like this:
Figure 4.5 The older PIR
Final Report 5709-349-0
19
The new PIRs have more adjustable settings and have a header installed in the 3-pin
ground/out/power pads.
Figure 4.6 The new PIR
For many basic projects or products that need to detect when a person has left or
entered the area, or has approached, PIR sensors are great. They are low power and low
cost, pretty rugged, have a wide lens range, and are easy to interface with. Note that
PIRs won't tell you how many people are around or how close they are to the sensor, the
lens is often fixed to a certain sweep and distance (although it can be hacked
somewhere) and they are also sometimes set off by housepets. Experimentation is key.
Size: Rectangular
Price: R150
Output: Digital pulse high (3V) when triggered (motion detected) digital low when idle
(no motion detected). Pulse lengths are determined by resistors and capacitors on the
PCB and differ from sensor to sensor.
Sensitivity range: up to 20 feet (6 meters) 110° x 70° detection range
Power supply: 3V-9V input voltage, but 5V is ideal.
How PIRs Work
PIR sensors are more complicated than many of the other sensors (like photocells, FSRs
and tilt switches) because there are multiple variables that affect the sensors input and
output. To begin explaining how a basic sensor works, we'll use this rather nice diagram.
Final Report 5709-349-0
20
The PIR sensor itself has two slots in it, each slot is made of a special material that is
sensitive to IR. The lens used here is not really doing much and so we see that the two
slots can 'see' out past some distance (basically the sensitivity of the sensor). When the
sensor is idle, both slots detect the same amount of IR, the ambient amount radiated
from the room or walls or outdoors. When a warm body like a human or animal passes
by, it first intercepts one half of the PIR sensor, which causes a positive differential
change between the two halves. When the warm body leaves the sensing area, the
reverse happens, whereby the sensor generates a negative differential change. These
change pulses are what is detected.
Figure 4.7 PIR detecting procedures
The PIR Sensor
The IR sensor itself is housed in a hermetically sealed metal can to improve
noise/temperature/humidity immunity. There is a window made of IR-transmissive
material (typically coated silicon since that is very easy to come by) that protects the
sensing element. Behind the window are the two balanced sensors.
Final Report 5709-349-0
21
Figure 4.8 The element window, the two pieces of sensing material
Figure 4.9 The Internal schematic of the PIR sensor
This image shows the internal schematic. There is actually a JFET inside (a type of
transistor) which is very low-noise and buffers the extremely high impedence of the
sensors into something a low-cost chip (like the BIS0001) can sense.
Final Report 5709-349-0
22
Lenses
PIR sensors are rather generic and for the most part vary only in price and sensitivity.
Most of the real magic happens with the optics. This is a pretty good idea for
manufacturing: the PIR sensor and circuitry is fixed and costs a few Rands. The lens
costs only a few cents and can change -the breadth, range, sensing pattern, very easily.
In the diagram up top, the lens is just a piece of plastic, but that means that the
detection area is just two rectangles. Usually we'd like to have a detection area that is
much larger. To do that, we use a simple lens such as those found in a camera: they
condenses a large area (such as a landscape) into a small one (on film or a CCD sensor).
For reasons that will be apparent soon, we would like to make the PIR lenses small and
thin and moldable from cheap plastic, even though it may add distortion. For this
reason the sensors are actually Fresnel lenses.
Figure 4.10 The Fresnel lens condenses light providing a larger range of IR to the sensor.
Figure 4.11 The Fresnel lens provides a larger range of IR to the sensor
Final Report 5709-349-0
23
Figure 4.12 The focal length of the IR
OK, so now we have a much larger range. However, remember that we actually have two
sensors, and more importantly we don’t want two really big sensing-area rectangles, but
rather a scattering of multiple small areas. So what we do is split up the lens into
multiple section, each section of which is a fresnel lens
Figure 4.13 The multiple facet-sections
Final Report 5709-349-0
24
Figure 4.14 A macro shot showing the different Fresnel lenses in each facet
The different faceting and sub-lenses create a range of detection areas, interleaved with
each other. That’s why the lens centers in the facets above are 'inconsistent' - every other
one points to a different half of the PIR sensing element
Figure 4.15 Different angles of the Fresnel lenses
Final Report 5709-349-0
25
TESRING A PIR
Figure 4.16 PIR test schematic Figure 4.17 PIR test wiring
When the PIR detects motion, the output pin will go "high" to 3.3V and light up the
LED.
RETRIGGERING
There's a couple options you may have with your PIR. First up we'll explore the
'Retriggering' option.
Once you have the LED blinking, look on the back of the PIR sensor and make sure that
the jumper is placed in the L position as shown below.
Figure 4.18 Back of the PIR with the jumper in the L position.
Final Report 5709-349-0
26
Now set up the testing board. You may notice that when connecting up the PIR sensor as
above, the LED does not stay on when moving in front of it but actually turns on and off
every second or so. That is called "non-retriggering".
Figure 4.19 Graph showing the non-retriggering option of the PIR.
Now change the jumper so that it is in the H position. If you set up the test, you will
notice that now the LED does stay on the entire time that something is moving. That is
called "retriggering".
Figure 4.20 Graph showing the retriggering option of the PIR.
For most applications, "retriggering" (jumper in H position as shown below) mode is a
little nicer.
Figure 4.21 Back of the PIR showing the jumper in H position.
Final Report 5709-349-0
27
If you need to connect the sensor to something edge-triggered, you'll want to set it to
"non-retriggering" (jumper in L position).
CHANGING SENSITIVITY
The PIR has a trimpot on the back for adjusting sensitivity. You can adjust this if your
PIR is too sensitive or not sensitive enough - clockwise makes it more sensitive.
Figure 4.22 The trimpot of a PIR for changing sensitivity.
CHANGING Pulse Time and Time out Length
There are two 'timeouts' associated with the PIR sensor. One is the "Tx" timeout: how
long the LED is lit after it detects movement - this is easy to adjust on because there's a
potentiometer.
The second is the "Ti" timeout which is how long the LED is guaranteed to be off when
there is no movement. This one is not easily changed but if you're handy with a
soldering iron it is within reason.
First, let’s take a look at the BISS datasheet
Tx= The time duration which the output pin (Vo) remains high after triggering.
Ti= During this time period, triggering is inhibited.
Tx≈24576xR10xC6; Ti≈24xR9xC7 (ref to schematic)
On PIR sensors, there's a little trim potentiometer labeled TIME. This is a 1 Mega ohm
adjustable resistor which is added to a 10Kseries resistor. And C6 is 0.01uF so
Tx = 24576 x (10K + Rtime) x 0.01uF.
Final Report 5709-349-0
28
If the Rtime potentiometer is turned all the way down counter-clockwise (to 0 ohms)
then Tx = 24576 x (10K) x 0.01uF = 2.5 seconds (approx.)
If the Rtime potentiometer is turned all the way up clockwise to 1 Megaohm then Tx =
24576 x (1010K) x 0.01uF = 250 seconds (approx.)
If RTime is in the middle, that'd be about 120 seconds (two minutes) so you can tweak it
as necessary. For example if you want motion from someone to turn on a fan for a
minimum of 1 minute, set the Rtime potentiometer to about 1/4 the way around.
READING PIR Sensors.
Connecting PIR sensors to a microcontroller is really simple. The PIR acts as a digital
output so all you need to do is listen for the pin to flip high (detected) or low (not
detected).
It’s likely that you'll want retriggering, so be sure to put the jumper in the H position.
Power the PIR with 5V and connect ground to ground. Then connect the output to a
digital pin.
Figure 4.23 Connecting a PIR to a Microcontroller.
The code is very simple, and is basically just keeps track of whether the input to pin 2 is
high or low. It also tracks the state of the pin, so that it prints out a message when
motion has started and stopped.
/*
* PIR sensor tester */
int ledPin = 13; // choose the pin for the LED
int inputPin = 2; // choose the input pin (for PIR sensor)
int pirState = LOW; // we start, assuming no motion detected int val = 0; //
variable for reading the pin status
Final Report 5709-349-0
29
void setup() {
pinMode(ledPin, OUTPUT); // declare LED as output pinMode(inputPin, INPUT);
// declare sensor as input
Serial.begin(9600); }
void loop(){
val = digitalRead(inputPin); // read input value
if (val == HIGH) { // check if the input is HIGH
4.4 230v day/night sensor directly connected to plc input
A Day/Night Sensor can automatically turn on or off lights at dusk and dawn. It is not
only convenient but also practical; it can control the lighting loads by working only at
night. Examples of use are street lights, office lights, and warehouse and factory lights,
garden lights.
SPECIFICATION
Power source: 220V – 240V/AC
Power Frequency: 50Hz
Rated Current: 25A
Ambient Light: <5LUX to 50 LUX (adjustable)
Working Temperature: -20º to +40 º
Working Humidity: <93%RH
WIRING DIAGRAM
Figure 4.24 Day/Night sensor Wiring diagram
L - Live in
N - Neutral In
A - Output to Lamp (Load)
Final Report 5709-349-0
30
4.5 Software implemented timers will be used
The Ladder Diagram is a graphics oriented programming language which approaches
the structure of an electric circuit. The Ladder Diagram consists of a series of networks.
A network is limited on the left and right sides by a left and right vertical current line. In
the middle is a circuit diagram made up of contacts, coils, and connecting lines.
Each network consists on the left side of a series of contacts which pass on from left to
right the condition "ON" or "OFF" which correspond to the Boolean values TRUE and
FALSE. To each contact belongs a Boolean variable. If this variable is TRUE, then the
condition is passed from left to right along the connecting line. Otherwise the right
connection receives the value OFF.
5. Experimental Evaluation
5.1Software part
As indicated previously that we are going to use the ladder diagram programming
language.
Figure 5.1 Ladder programming
T1, T2, T3 represent respectively the contacts of timer1, timer2 and timer3 that we had
set to 10 seconds each.I4 is the input 4 that represents our Day/night sensor.Q1, Q2, Q3
represent respectively Output 1(or light for Area 1), output 2(or light for Area 2) and
Output 3 (or light for Area 3).
Final Report 5709-349-0
31
I1, I2 and I3 that are normally closed contacts represent respectively the PIR 1, PIR2
and PIR3
Let us explain now how our program works:
1. Phase 1 during the day (when there is enough light entering the Day/Night sensor)
Figure 5.2 Day/Night sensor
1.1 No people movement
When we switch on our PLC nothing will happen because the day/night is in a zero
Boolean state because of the light entering it and because the PIR will also be in a zero
Boolean state since there is no people movement our output (lamp) will remain off.
1.2 People movement
When there is people movement the PIR detects people presence it will go ON or a True
(One) Boolean state it means the timer will be triggered and T1 will become a normally
closed contact but our Output (light) will remain off because T1 and I4 are in series since
T1 is a 1 and I4 a 0 both are acting like a AND gate.
2. Phase 2 During night (or when there is no enough light entering the day/night sensor)
Figure 5.3 Day/Night sensor when there is no enough light entering it
Final Report 5709-349-0
32
2.1 No people movement
When there is no people movement the PIR is in the zero Boolean state and the
Day/night is in a 1 Boolean since they are in series the output (light) will be off.
2.2 people movement
When there is people movement both PIR and the Day/Night will be in a 1 state Boolean
state then the output (light) will be on.
5.2 Hardware part
Figure 5.4 A programmed PLC for hardware wiring
Figure 5.5 The wiring diagram
Final Report 5709-349-0
33
A transistor PIR needs an external relay to isolate the 220v from it.
Figure 5.6 External relay Figure 5.7 12v DC supply for the PIR
We connected a resistor in series to the live going to the PIR to limit the current.
Figure 5.8 Resistor connected to the live
Then we did the wiring to connect both inputs:
Figure 5.9 An open PIR Figure 5.10 PIR
Final Report 5709-349-0
34
Figure 5.11 A Day/Night sensor
Figure 5.12The complete project
6. Results
Depending on the characteristics of the space to be controlled, energy savings as high
as 90% can be realized through use of PIR sensors and Day/Night sensors combined.
Final Report 5709-349-0
35
Table 6.1 Table of results
OCCUPANCY AREA ENERGY SAVINGS
Private office 15-50%
Classroom 40-50%
Conference room 25-70%
Restrooms 32-72%
Corridors 32-84%
Storage areas 50-80%
7. Analysis of results
When occupancy in a given space is predictable, switching can often be scheduled
using simple devices such as time-clocks and timer-switches to save energy. When
occupancy is not predictable, then switching can be automated using occupancy
sensors (PIR sensors).
PIR sensors detect when a space is occupied or unoccupied and turn the lights on or
off automatically after a short period of time to save energy.
The results was established by considering also the following variables:
1. Technology: choose method of motion detection that will best meet the
application need.
2. Sensitivity: determine how sensitive the sensor should be to movement so
that it effectively detects minor and major motion without nuisance switching
(on/off).Sensors are now available which provide automatic adjustments of
time delay and sensitivity. In this models, manual set-up and subsequent
adjustments are unnecessary.
3. Coverage area: specify range and coverage area for the motion detector
based on the desired level of sensitivity.
4. Mounting: locate the sensor for maximum effect.
5. Time delay: determine how long the sensor should wait before turning out
the lights when the space is unoccupied to be convenient for users but also
maximize energy savings.
6. Cut off: determine whether the occupancy sensor’s coverage area must be
restricted so that it will not monitor adjacent areas that should not be
monitored (such as a hallway outside a controlled private office).
Final Report 5709-349-0
36
7. Special features: specify special features for the sensor based on available
offerings from manufacturer and application need.
8. Discussion
Lighting alone can make up to 50% of your business energy usage. Your office might
waste a lot of that energy if its light are left on in empty rooms. Cutting back on wasted
lighting can mean major energy savings. When you install PIR sensors. Saving energy
becomes automatic. How much energy can you really save when you install PIR sensors?
Many businesses hesitate to upgrade their offices with PIR sensors because they do not
think they can afford the cost of the sensors, installation and possible downtime.
The truth is, businesses cannot afford not use occupancy sensors (PIR sensors). An EPA
study showed that within just 14 days of installation, buildings with occupancy sensors
reduced their energy waste by as much as 68%...increasing energy savings by as much as
60%.They found the most energy waste was reduced in restrooms and conference
rooms, where lights are often left on, even when the spaces are unoccupied.
You can adjust your sensors time delay for the most energy savings. A short 5 minutes
delay means the lights will shut off after five minutes of no detected movement.
However, someone working quietly might find themselves left in dark if the time delay is
too short for the given space.
In order for a PIR to work well most of the time, they are designed with certain
limitations. A PIR sensor cannot detect a stationary or very slow moving body. If the
sensor was set to the required sensitivity, it would be activated by the cooling of a
nearby wall in the evening, or by very small animals.Similary, if someone walks straight
towards a PIR sensor, it will not detect them until they are very close.
Final Report 5709-349-0
37
9. Conclusions and Recommendations
1. According to Smith (2005:10):‟Microcontrollers are now providing us with a
new way of designing circuits.Designs,which at one time required many
digital ICs and lengthy Boolean algebra calculations, can now be programmed
simply into one microcontroller.” This proved to be true in our case.Peatman
(2003:1) states the following: ‟Electronic intelligence is hidden inside the
products we use in our daily lives. As the cost of the integrated circuits that
provide this intelligence has dropped over the years, the number of
manufactures using these devices and their diverse applications has
exploded.”
2. There is also a wide range of embedded or self-contained devices that are
available (Predko2002:2).Therefore important choices need to be made in
this regard.
3. This project also made it evident how an original idea, proposal, concept or
even the complexity and the design procedure can vary during different stages
or phases of the project. It also illustrates the great diversity in this particular
field. One of the issues is the ability to provide relatively complex interfaces
for applications using a simple PLC. Additionally it was important to note that
a project is based on a collection of different development efforts (for
hardware and software) and not a development process in a single discipline.
4. With regard to the hardware design, datasheets are extremely important.
5. Environmental factors are very influential onto the circuit, thus, any changes
in the room temperature or pressure would have an influence on the output.
In order to obtain a successful operation, the environmental factors should be
taken in great consideration.
6. To improve this project, the designers could use a programmable
microcontroller which can be instructed with the language C or C#.
7. Finally this type of project and of course as a subject forms a solid basis or
foundation in the approach or involvement in any future projects.
Final Report 5709-349-0
38
10. Bibliography
1. CANIOU.07-1999.Passive Infrared detection: Theory and Application.USA.Hardback.
2. S.Melville and w.Goddard.2005.Research Methodology. Second Edition.SA.Juta &
Co.
3. FLOYD, T.L.1997.Digital Fundamentals. Sixth Edition.USA.Prentice Hall.
4. CAMPBEL T.2007.PLC Programming Hand Book.Third.Edition.USA.McGraw-Hill.
5. HAROWITZ, P. & HILL, W.1996.The Art of Electronics. Second Edition. Great
Britain. Cambridge University Press.
6. MAJOR TECH.2013.Day/Night Sensor DNS25 Instruction Manual.SA Isando.
7. BALDOR.2001.BISS Technical Datasheet. Circuit Standard SSI.
8. KILIAN, C.T.2006.Modern Control Technology. Third Edition.USA.Delmar.
9. STROUD, K.A.1995.Engineering Mathematics. Fourth Edition.UK.Macmillan.
10. UNISA.2005.Industrial Project IV.Study Guide 1.
11. UNISA.2005.Industrial Project IV.Study Guide 2.
12. www.klocknermoeller.com
13. www.energysavingsensors.com
Final Report 5709-349-0
39
11. Appendices
1. Circuit diagrams……………………………………………………………………………1
2. The 4 other PLC’s programming language……………………………………….2
3. Cost analysis…………………………………………………………………………………4
4. CD ROM
► Design Project Operation.
Final Report 5709-349-0
40
1. Circuit diagrams
Figure 11.1 PIR sensor Circuit Diagram.
Figure 11.2 Day/Night sensor Circuit Diagram.
Final Report 5709-349-0
41
2. The 4 other PLC’s programming language
Figure 11.3 An Example of the INSTRUCTION LIST programming language.
Figure 11.4 An example of a FUNCTION BLOCK DIAGRAM programming language.
Final Report 5709-349-0
42
Figure 11.5 An example of a SEQUENTIAL FUNCTION CHART programming language.
Figure 11.6 An example of a SEQUENTIAL TEST programming language.
Final Report 5709-349-0
43
3.Cost Analysis
A cost analysis of the material used in the design project.
Quantity Description Price
3 Resistor 1/4w 2k7 5
3 PIR sensor 600
1 Day/Night sensor 250
1 PLC and Connectors bench 3500
Other materials (approx.) 950
Total R5305
Final Report 5709-349-0
44

Más contenido relacionado

Destacado

Qué son los resultados de aprendizaje y como se redactan
Qué son los resultados de aprendizaje y como se redactanQué son los resultados de aprendizaje y como se redactan
Qué son los resultados de aprendizaje y como se redactanMoises Logroño
 
Resultados del Aprendizaje
Resultados del AprendizajeResultados del Aprendizaje
Resultados del AprendizajeChina Stefa
 
Objetivos y Resultados de Aprendizaje
Objetivos y Resultados de AprendizajeObjetivos y Resultados de Aprendizaje
Objetivos y Resultados de AprendizajeClaudia Patricia
 
01 taxonomías de resultados de aprendizaje Bloom y Biggs
01 taxonomías de resultados de aprendizaje Bloom y Biggs01 taxonomías de resultados de aprendizaje Bloom y Biggs
01 taxonomías de resultados de aprendizaje Bloom y BiggsAlfredo Prieto Martín
 
Cómo redactar los resultados de aprendizaje
Cómo redactar los resultados de aprendizajeCómo redactar los resultados de aprendizaje
Cómo redactar los resultados de aprendizajeEder Valenzuela
 
GUIA DE LOGROS DE APRENDIZAJE
GUIA DE LOGROS DE APRENDIZAJEGUIA DE LOGROS DE APRENDIZAJE
GUIA DE LOGROS DE APRENDIZAJEWILSON VELASTEGUI
 

Destacado (6)

Qué son los resultados de aprendizaje y como se redactan
Qué son los resultados de aprendizaje y como se redactanQué son los resultados de aprendizaje y como se redactan
Qué son los resultados de aprendizaje y como se redactan
 
Resultados del Aprendizaje
Resultados del AprendizajeResultados del Aprendizaje
Resultados del Aprendizaje
 
Objetivos y Resultados de Aprendizaje
Objetivos y Resultados de AprendizajeObjetivos y Resultados de Aprendizaje
Objetivos y Resultados de Aprendizaje
 
01 taxonomías de resultados de aprendizaje Bloom y Biggs
01 taxonomías de resultados de aprendizaje Bloom y Biggs01 taxonomías de resultados de aprendizaje Bloom y Biggs
01 taxonomías de resultados de aprendizaje Bloom y Biggs
 
Cómo redactar los resultados de aprendizaje
Cómo redactar los resultados de aprendizajeCómo redactar los resultados de aprendizaje
Cómo redactar los resultados de aprendizaje
 
GUIA DE LOGROS DE APRENDIZAJE
GUIA DE LOGROS DE APRENDIZAJEGUIA DE LOGROS DE APRENDIZAJE
GUIA DE LOGROS DE APRENDIZAJE
 

Similar a FINAL REPORT

DESIGN AND CONSTRUCTION OF A PERSON COUNTER WITH VOICE ALARM
DESIGN AND CONSTRUCTION OF A PERSON COUNTER WITH VOICE ALARM DESIGN AND CONSTRUCTION OF A PERSON COUNTER WITH VOICE ALARM
DESIGN AND CONSTRUCTION OF A PERSON COUNTER WITH VOICE ALARM Ayuba Kwasako Danburam
 
Bidirectional Visitor Counter for efficient electricity usage.
Bidirectional Visitor Counter for efficient electricity usage.Bidirectional Visitor Counter for efficient electricity usage.
Bidirectional Visitor Counter for efficient electricity usage.NandaVardhanThupalli
 
final report (parking project).pdf
final report (parking project).pdffinal report (parking project).pdf
final report (parking project).pdfgamefacegamer
 
Minigrid policy toolkit 2014 REN21
Minigrid policy toolkit 2014 REN21Minigrid policy toolkit 2014 REN21
Minigrid policy toolkit 2014 REN21PatrickTanz
 
Plc and scada report
Plc and scada reportPlc and scada report
Plc and scada reportIndira Kundu
 
KEB supply failure
KEB supply failureKEB supply failure
KEB supply failuregayatrigayu1
 
Hyun wong thesis 2019 06_19_rev31_final
Hyun wong thesis 2019 06_19_rev31_finalHyun wong thesis 2019 06_19_rev31_final
Hyun wong thesis 2019 06_19_rev31_finalHyun Wong Choi
 
advancing-the-automotive-industry-by-collaboration-and-modularity
advancing-the-automotive-industry-by-collaboration-and-modularityadvancing-the-automotive-industry-by-collaboration-and-modularity
advancing-the-automotive-industry-by-collaboration-and-modularityStefano Marzani
 
University of Pune - Project report
University of Pune -  Project reportUniversity of Pune -  Project report
University of Pune - Project reportRishiraj Randive
 
Hyun wong thesis 2019 06_19_rev29_final
Hyun wong thesis 2019 06_19_rev29_finalHyun wong thesis 2019 06_19_rev29_final
Hyun wong thesis 2019 06_19_rev29_finalHyun Wong Choi
 
Hyun wong thesis 2019 06_19_rev27_final
Hyun wong thesis 2019 06_19_rev27_finalHyun wong thesis 2019 06_19_rev27_final
Hyun wong thesis 2019 06_19_rev27_finalHyun Wong Choi
 
Hyun wong thesis 2019 06_19_rev30_final
Hyun wong thesis 2019 06_19_rev30_finalHyun wong thesis 2019 06_19_rev30_final
Hyun wong thesis 2019 06_19_rev30_finalHyun Wong Choi
 
Report 5 - Mechanical - Low Carbon and Renewable Technology
Report 5 - Mechanical - Low Carbon and Renewable TechnologyReport 5 - Mechanical - Low Carbon and Renewable Technology
Report 5 - Mechanical - Low Carbon and Renewable TechnologyUthishran Ratnakumar
 
Hyun wong thesis 2019 06_19_rev38_final
Hyun wong thesis 2019 06_19_rev38_finalHyun wong thesis 2019 06_19_rev38_final
Hyun wong thesis 2019 06_19_rev38_finalHyun Wong Choi
 
Project Report Distance measurement system
Project Report Distance measurement systemProject Report Distance measurement system
Project Report Distance measurement systemkurkute1994
 
Plc report with project
Plc report with projectPlc report with project
Plc report with projectPriya Hada
 
Master's_Thesis_XuejiaoHAN
Master's_Thesis_XuejiaoHANMaster's_Thesis_XuejiaoHAN
Master's_Thesis_XuejiaoHANXuejiao Han
 

Similar a FINAL REPORT (20)

DESIGN AND CONSTRUCTION OF A PERSON COUNTER WITH VOICE ALARM
DESIGN AND CONSTRUCTION OF A PERSON COUNTER WITH VOICE ALARM DESIGN AND CONSTRUCTION OF A PERSON COUNTER WITH VOICE ALARM
DESIGN AND CONSTRUCTION OF A PERSON COUNTER WITH VOICE ALARM
 
Bidirectional Visitor Counter for efficient electricity usage.
Bidirectional Visitor Counter for efficient electricity usage.Bidirectional Visitor Counter for efficient electricity usage.
Bidirectional Visitor Counter for efficient electricity usage.
 
final report (parking project).pdf
final report (parking project).pdffinal report (parking project).pdf
final report (parking project).pdf
 
Minigrid policy toolkit 2014 REN21
Minigrid policy toolkit 2014 REN21Minigrid policy toolkit 2014 REN21
Minigrid policy toolkit 2014 REN21
 
VENDING_MACHINE_2023-2024
VENDING_MACHINE_2023-2024VENDING_MACHINE_2023-2024
VENDING_MACHINE_2023-2024
 
Plc and scada report
Plc and scada reportPlc and scada report
Plc and scada report
 
KEB supply failure
KEB supply failureKEB supply failure
KEB supply failure
 
Hyun wong thesis 2019 06_19_rev31_final
Hyun wong thesis 2019 06_19_rev31_finalHyun wong thesis 2019 06_19_rev31_final
Hyun wong thesis 2019 06_19_rev31_final
 
advancing-the-automotive-industry-by-collaboration-and-modularity
advancing-the-automotive-industry-by-collaboration-and-modularityadvancing-the-automotive-industry-by-collaboration-and-modularity
advancing-the-automotive-industry-by-collaboration-and-modularity
 
University of Pune - Project report
University of Pune -  Project reportUniversity of Pune -  Project report
University of Pune - Project report
 
Plc report
Plc reportPlc report
Plc report
 
Hyun wong thesis 2019 06_19_rev29_final
Hyun wong thesis 2019 06_19_rev29_finalHyun wong thesis 2019 06_19_rev29_final
Hyun wong thesis 2019 06_19_rev29_final
 
Hyun wong thesis 2019 06_19_rev27_final
Hyun wong thesis 2019 06_19_rev27_finalHyun wong thesis 2019 06_19_rev27_final
Hyun wong thesis 2019 06_19_rev27_final
 
Hyun wong thesis 2019 06_19_rev30_final
Hyun wong thesis 2019 06_19_rev30_finalHyun wong thesis 2019 06_19_rev30_final
Hyun wong thesis 2019 06_19_rev30_final
 
Report 5 - Mechanical - Low Carbon and Renewable Technology
Report 5 - Mechanical - Low Carbon and Renewable TechnologyReport 5 - Mechanical - Low Carbon and Renewable Technology
Report 5 - Mechanical - Low Carbon and Renewable Technology
 
Hyun wong thesis 2019 06_19_rev38_final
Hyun wong thesis 2019 06_19_rev38_finalHyun wong thesis 2019 06_19_rev38_final
Hyun wong thesis 2019 06_19_rev38_final
 
Misgie fikr
Misgie fikrMisgie fikr
Misgie fikr
 
Project Report Distance measurement system
Project Report Distance measurement systemProject Report Distance measurement system
Project Report Distance measurement system
 
Plc report with project
Plc report with projectPlc report with project
Plc report with project
 
Master's_Thesis_XuejiaoHAN
Master's_Thesis_XuejiaoHANMaster's_Thesis_XuejiaoHAN
Master's_Thesis_XuejiaoHAN
 

Más de Cedalaloi Nguari

Más de Cedalaloi Nguari (8)

MITSUBISHI n TOSHIBA PLCs
MITSUBISHI n TOSHIBA PLCsMITSUBISHI n TOSHIBA PLCs
MITSUBISHI n TOSHIBA PLCs
 
Work force collaboration and development
Work force collaboration and developmentWork force collaboration and development
Work force collaboration and development
 
Community Organizing for Action
Community Organizing for ActionCommunity Organizing for Action
Community Organizing for Action
 
Fundamentals of Business Expansion
Fundamentals of Business ExpansionFundamentals of Business Expansion
Fundamentals of Business Expansion
 
YALI_Certificate
YALI_CertificateYALI_Certificate
YALI_Certificate
 
NDip
NDipNDip
NDip
 
ABB AC 500
ABB AC 500 ABB AC 500
ABB AC 500
 
SOFT STARTER
SOFT STARTERSOFT STARTER
SOFT STARTER
 

FINAL REPORT

  • 1. INDUSTRIAL PROJECT IV Nguari Cedrick Mbu 5709-349-0 IPR401E FINAL REPORT THE APPLICATION OF A PROGRAMMABLE LOGIC CONTROLLER (PLC) TO CONSERVE AND OPTIMISE THE USE OF ELECTRICAL ENERGY IN DOMESTIC AND INDUSTRIAL APPLICATIONS
  • 2. Final Report 5709-349-0 1 THE APPLICATION OF A PROGRAMMABLE LOGIC CONTROLLER (PLC) TO CONSERVE AND OPTIMISE THE USE OF ELECTRICAL ENERGY IN DOMESTIC AND INDUSTRIAL APPLICATIONS Nguari Cedrick Mbu Report submitted to the University of South Africa, UNISA, in fulfilment of the requirements for the degree Bachelor of Technology Electrical Engineering in the Faculty of Engineering at UNISA. MENTOR: Mr. Almero du Pisani SEPTEMBER 2015
  • 3. Final Report 5709-349-0 2 Declaration of Own Work I declare that this report is my own, unaided work. It is being submitted for the baccalaureate Technology in Electrical Engineering in the Department of Electrical Engineering at UNISA.It has not been submitted before for any degree, diploma, assessment or other examination at any other tertiary educational institution. Signed: by at on this day of 2015 Mentor: Signed: by
  • 4. Final Report 5709-349-0 3 Acknowledgements I would like to thank my mentor Mr. Almero Du Pisani for his tremendous contribution with regard to the design and programming of the PLC. This project would not have been possible without his help, guidance and experience. I am also grateful for the opportunity and privilege to work on this project at Pretoria North Training Center. In addition I would like to thank my parents and Juresse Kifuta my friend for their support and guidance over the years. Finally I would like to thank the Electrical Engineering Department at UNISA and my study group members for their helps, suggestions and corrections which have had a direct impact on the quality of the content.
  • 5. Final Report 5709-349-0 4 Abstract As it is impossible to document every detail, the aim of this final report is to highlight a number of the various aspects involved in this particular design project. The aim of this research project is to design a system that will automatically conserve energy in domestic or industrial applications by intelligently controlling illumination in any building. Section 1 is a brief introduction and section 2 is a short discussion on the literature survey. Section 3 is the background theory, define and discuss different types of lighting systems. Highlight their advantages and disadvantages and the proposed solution. Section 4 explains and analyze the working procedures of the PIR’s, PLC and the Day/Night sensor. Section 5 highlights the main concepts of the software and hardware design. Section 6 states the results. Section 7 analyses the results. Section 8 discusses the results. Section 9 discusses the valuable lessons learned from this project and additional recommendations.
  • 6. Final Report 5709-349-0 5 Table of contents Page List of figures…………………………………………………………………………………………..……1 List of tables…………………………………………………….………………………………………...….2 List of abbreviations............................................................................................…...3 1. Introduction……………………………………………………………………………………………….4 2. Literature survey……………………………………………………………………………………..…5 3. Background theory…………………………………………………………………………………..…6 3.1 Definition of a lighting system…………………………………………………………………..7 3.2 Overview of a lighting system for energy savings……………………………..…………8 3.3 Evaluation of various concepts of energy saving opportunities with efficient Lighting………………………………………………………………………………………………….9 3.4 Proposed solution………………………………………………………………………..…………10 4. Detailed design………………………………………………………………………………..…………11 4.1 Introduction……………………………………………………………………………….………….12 4.2 Klockner Moeller…………………………………………………………………………….……..13 4.3 PIR sensors…………………………………………………………………………………….……..14 4.4 Day/Night sensor.........................................................................................…...15 4.5 Software implemented…………………………………………………………………………...16 5. Experimental evaluation………………………………………………….………………………..17 5.1 Software part………………………………………………………………………….……………….18 5.2 Hardware part………………………………………………………………………….……………..19 6. Results…………………………………………………………………………………………………………20 7. Analysis of results……………………………………………………………………………………….21
  • 7. Final Report 5709-349-0 6 8. Discussion………………………………………………………………………….……………………....22 9. Conclusion and recommendations…………………………………………………………...23 10. Bibliography………………………………………………………………………………………………24 11. Appendices……………………………………………………………………………………..………….25
  • 8. Final Report 5709-349-0 7 List of figures Page Figure 3.1 A simple lighting system…………………………………………………………………….1 Figure 3.2 Different types of energy efficient fluorescent lamps……………………………2 Figure 3.3 the T labeled fluorescent lamps…………………………………………….…………….3 Figure 3.4 the components of a fluorescent lamp……………………….………………………..4 Figure 3.5 Exit signs made of LEDs…………………………………………………………………….5 Figure 4.1 The project schematic…………………………………………………………………….…..6 Figure 4.2 Klockner Moeller PLCs…………………………………………………………………….…7 Figure 4.3 PIR PCBs both sides……………………………………………………………………………8 Figure 4.4 The Pyroelectric sensor……………………………………………….……………………..8 Figure 4.5 The older PIR…………………………………………………………………………………….7 Figure 4.6 The new PIR……………………………………………………………………………….……..9 Figure 4.7 PIR detecting procedures…………………………………………………………………….9 Figure 4.8 The element window, the two pieces of sensing material......................…...7 Figure 4.9 The internal schematic of the PIR sensor……………….……………………………..9 Figure 4.10 The Fresnel lens condenses light providing a larger range of IR to the sensor………………………………………………………………………………………………………9 Figure 4.11 The Fresnel lens provides a larger range of IR to the sensor……………..…..5 Figure 4.12 The focal length of the IR…………………………………………………………………….5 Figure 4.13 The Multiple facet sections………………………………………………………………….9 Figure 4.14 A macro shot showing the different Fresnel lenses in each facet…………….9 Figure 4.15 Different angles of the Fresnel lenses……..……………………………………………8 Figure 4.16 PIR test schematic……………………………………………………………………………..9 Figure 4.17 PIR test wiring…………………………………………………………..………………………8 Figure 4.18 Back of the PIR with the jumper in the L position…………………….…………..9 Figure 4.19 Graph showing the non-retriggering option of the PIR……………….………..7 Figure 4.20 Graph showing the retriggering option of the PIR…………………………….…9 Figure 4.21 Back of the PIR showing the jumper in H position………………….…………….9 Figure 4.22 The trimpot of a PIR for changing sensitivity………………………………..……..8 Figure 4.23 Connecting a PIR to a Microcontroller………………………………………………….7 Figure 4.24 Day/Night sensor wiring diagram……………………………………………………….9 Figure 5.1 Ladder programming……………………………………………………….……………………9 Figure 5.2 Day/Night sensor………………………………………………………………………………….6 Figure 5.3 Day/Night sensor………………………………………………………………………………….8 Figure 5.4 Programmed PLC for hardware wiring………………………………………….………9 Figure 5.5 The wiring diagram…………………………………………………….………………………..8 Figure 5.6 External relay…………………………………………………………………….…………………0 Figure 5.7 12V DC supply for the PIR………………………………………………………….…………..0 Figure 5.8 Resistor connected to the live………………………………….………………………………8 Figure 5.9 An open PIR………………………………………….………………………………………………8 Figure 5.10 PIR……………………….…………………………………………………………………………….7 Figure 5.11 Day/Night sensor………………………………………..……………………………………….9 Figure 5.12 The complete project……………………………………………………………………………10
  • 9. Final Report 5709-349-0 8 List of tables Page Table 3.1 The lumen output of incandescent bulbs……………………………………………..9 Table 3.2 Comparison of the three models of exit signs………………………………………9 List of abbreviations A-Amp AC-Alternating Current CCD-Charge-Coupled Device CFL-Compact Fluorescent Lamps CRI-Colour Rendering Index DC-Direct Current D/N-Day/Night sensor EPA-Environmental Protection Agency FSR-Force Sensing Resistor IC-Integrated circuit IR-InfraRed JFET-Junction Field Effect Transistor K-degree Kelvin KWH-KiloWatt/Hour L-Live LED-Light Emitting Diode N-Neutral PCB-Printed Circuit Board PIR-Passive InfraRed PLC-Programmable Logic Controller PSU-Power Supply Unit R-Rands RH-Relative Humidity V-Volt
  • 10. Final Report 5709-349-0 9 1. Introduction There are various different motivations or reasons to improve energy efficiency. Reducing energy use reduces energy costs and may result in a financial cost saving benefit to consumers if the energy savings offset any additional costs to implementing energy efficient technology. Reducing energy use is also seen as a key solution to the problem of reducing polluting emissions. According to the International Energy Agency, improved energy efficiency in buildings, industrial processes and transportation could reduce the world’s energy need in 2050 by one third, and help control global emissions of harmful gases. Energy efficiency and renewable energy are said to be the twin pillars of sustainable energy policy. In many countries energy efficiency is also seen to have a national security benefit because it can be used to reduce the level of energy imports from foreign countries and may slow down the rate at which domestic energy resources are depleted. To keep our planet in this condition for future generations, we all need to look at how we use energy. In South Africa the demand for electricity is much higher than what the National supplier is able to supply in peak hours and that leads to regular load shedding throughout the country. In many towns and cities lights are left on in buildings 24 hours a day, irrespective 0f people needing the illumination or not. Load shedding is experienced almost everyday. The aim of this research project is to design a system that will automatically conserve energy in domestic or industrial applications by intelligently controlling illumination in any building. In this project the objective is to identify criteria, design and develop a software, program and implement a programmable logic controller (PLC) system to control the lightning system of a certain building. By implementing this project, we envisage a minimum reduction of 20% in the electricity consumption. This will directly benefit the population of South Africa and Eskom as a utility provider. Eskom has warned that without additional funding to buy diesel, load shedding will be continuous and ongoing because the utility will not be able to operate its open gas turbines. At the moment Eskom requested an increase of 25% which will have a very negative influence on the economy and people of South Africa. This is not a new concept but the introduction of PIRs and the Day/Night sensor makes it different from other energy saving projects with PLCs.
  • 11. Final Report 5709-349-0 10 2. Literature Survey 1. The preliminary literature survey or study consisted of research on the Internet, technical journals, data sheets, product and service manuals, textbooks and other printed publications. 2. The first step was to define the Inputs to the PLC and how they operate. This was accomplished by referring to any available circuit diagrams, service and operators’ manuals and the internet. It was also beneficial to gain some understanding on the PIRs and the Day/Night sensor. 3. Choice of a programming language for the PLC was the next logical step. A choice needed to be made between different types of PLC’s programming language. The ladder diagram was the chosen one because of it is the programming language that approaches the structure of an electric circuit. 4. The next step was the selection of a PLC.Klockner Moeller PLC was selected because of its easier programming using LCD display. 3. Background Theory 3.1 Definition of a lighting system A lighting system is defined as all of the components necessary to meet the requirements for illumination. This includes all components from the supply and the switch that control the power to the lamps all the way to the reflectance of the space in which the lighting system operates. Figure 3.1 A simple lighting system
  • 12. Final Report 5709-349-0 11 3.2 Overview of a Lighting System for Energy savings The first consideration when examining lighting systems for energy savings opportunities must always be the requirement for illumination, defined by: • The duration of illumination required and, • The level of illumination required. The lighting system must be designed and operated to meet the need for illumination at the lowest expenditure of energy. The quality of the light is also an important consideration in meeting the need. There are two characteristics of the light source that define quality: • Colour rendering index (CRI) • Colour temperature. Colour Rendering Index: CRI is a unit of measure that defines how well colours are rendered by different illumination conditions in comparison to a standard (i.e. a thermal radiator or daylight). CRI is calculated on a scale from 1-100 where a CRI of 100 would represent that all colour samples illuminated by a light source in question, would appear to have the same colour as those same samples illuminated by a reference source. To put it another way, low CRI causes colours to appear washed out and perhaps even take on a different hue, and high CRI makes all colours look natural and vibrant. Colour Temperature describes certain colour characteristics of light sources. A "blackbody" is a theoretical object which is a perfect radiator of visible light. As the actual temperature of this blackbody is raised, it radiates energy in the visible range, first red, changing to orange, white, and finally bluish white. Colour temperature describes the colour of a light source by comparing it to the colour of a blackbody radiator at a given temperature. For example, the colour appearance of a halogen lamp is similar to a blackbody radiator heated to about 3000 degrees Kelvin. Therefore it is said that the halogen lamp has a colour temperature of 3000 degrees K- which is considered to be a warm colour temperature. Though color temperature is not a measure of the physical temperature of the light source, it does correspond to the physical temperature of the blackbody radiator when the colour appearance is the same as the source being tested.
  • 13. Final Report 5709-349-0 12 3.3 Evaluation of various Concepts of energy-saving opportunities with efficient lighting Electric lighting is a major energy consumer. Enormous energy savings are possible using energy efficient equipment, effective controls, and careful design. Using less electric lighting reduces heat gain, thus saving air-conditioning energy and improving thermal comfort. Electric lighting design also strongly affects visual performance and visual comfort by aiming to maintain adequate and appropriate illumination while controlling reflection and glare. Lighting is not just a high priority when considering hotel design; it is also a high- return, low-risk investment. By installing new lighting technologies, hotels can reduce the amount of electricity consumed and energy costs associated with lighting. There are several types of energy efficient lighting and affordable lighting technology. The following are a few examples of energy-saving opportunities with efficient lighting. 1. INSTALLATION OF COMPACT FLUORESCENT LAMPS (CFLs`) IN PLACE OF INCANDESCENT LAMPS. Compact Fluorescent Lamps use a different, more advanced technology than incandescent light bulbs and come in a range of styles and sizes based on brand and purpose. They can replace regular, incandescent bulbs in almost any light fixture including globe lamps for the bathroom vanity, lamps for recessed lighting, dimming, and 3-way functionality lights. CFLs use about 2/3 less energy than standard. Incandescent bulbs, give the same amount of light, but CFL lamps can last 6 to 10 times longer. CFL prices range from R40 to R150 depending on the bulb, but you save about R250 to R300 per bulb on energy during the lifetime of the bulb. When looking to purchase CFLs to replace incandescent bulbs, compare the light output, or Lumens, and not the watts. Watts refers to the amount of energy used, not the amount of light. In other words, if the incandescent bulb you wish to replace is 60 Watts, this is equal to 800 Lumens. To get the same amount of light in a CFL, you should look at a CFL that provides 800 Lumens or more (equal to about a 13 watt fluorescent bulb). Use the table below to easily figure the conversions.
  • 14. Final Report 5709-349-0 13 Table 3.1 The lumen output of incandescent bulbs Incandescent bulb (watts) Typical lumens (measure of light output) 40 > 450 60 > 800 75 > 1100 100 > 1600 150 > 2600 2. INSTALLATION OF ENERGY-EFFICIENT FLUORESCENT LAMPS IN PLACE OF “CONVENTIONAL” FLUORESCENT LAMPS Many lodging facilities may already use fluorescent lighting in their high traffic areas such as the lobby or office area. However, not all fluorescent lamps are energy efficient and cost effective. There are several types of fluorescent lamps that vary depending on the duration of their lamp life, energy efficiency, regulated power, and the quality of color it transmits. Figure 3.2 Different types of energy-efficient fluorescent lamps There are a few styles worth noting; these models are simply labeled as “T-12”, “T-8”, or “T-5”. The names come from the size of their diameter per eighth inch. For example, a T-12 lamp is 12/8 inch in diameter (or 1 1/2 inch); a T-8 lamp is 8/8 inch in diameter (or 1 inch); a T-5 lamp is 5/8 inch in diameter. This is a simple way to identify the type of fluorescent lamps your facility is using.
  • 15. Final Report 5709-349-0 14 Figure 3.3 The T labeled fluorescent lamps The recommended style of fluorescent lighting is a T-8. T-8 lights are the most cost- effective. They usually cost about R9.9 a bulb and are 30% to 40% more efficient than standard T-12 fluorescent lamps, which have poor color rendition and cause eye strain. T-8 lamps provide more illumination, better color, and don't flicker (often exhibited by standard fluorescent fixtures). T-5 lamps are the most energy efficient and also tend to transmit the best color; however, they usually cost about R50 per bulb. Each style of fluorescent lamp cannot function without a ballast. A ballast is an electrical device used in fluorescent lamps to regulate starting and operating characteristics of the lamp. Some ballasts are magnetic where as others are electronic. Electronic high frequency ballasts are now standard for most fluorescent lights. Due to the differences in wattage between the types of lights, if converting from a T-12 to a T-8 light, one must also change the type of ballast being used. Figure 3.4 The components of a fluorescent lamp Note: It is important to discard all styles of fluorescent lamps appropriately. Because they contain a small amount of mercury, improper disposal could harm our soils or lakes. Fluorescent bulbs should be recycled, not thrown away.
  • 16. Final Report 5709-349-0 15 3. REPLACE ALL EXIT SIGNS WITH LIGHT EMITTING DIODE (LED) EXIT SIGNS. The development of light emitting diodes (LEDs) has allowed the replacement of exit sign lighting with a more energy efficient alternative. Multiple LEDs, properly configured, produce equivalent lighting and consume 95% less electricity than incandescent bulbs and 75% less than energy-efficient compact fluorescent lamps. A major benefit is the 20-year life cycle rating of LEDs; they virtually eliminate maintenance. Figure 3.5 Exit signs made of LEDs Of the three different styles of exit signs, incandescent signs are the least expensive, but are inefficient and use energy releasing heat instead of light. Fluorescent signs are also inexpensive and have an expected life of about 10,000 hours. LED exit signs are the most expensive, but are also the most energy efficient exit signs available. Their payback time is usually about four years. The table below offers an easy comparison of the three models of exit signs. Table 3.2 Comparison of the three models of exit signs Incandescent Fluorescent LED Input Power (watts) 40 11 2 Yearly energy (kwh) 350 96 18 Lamp Life (years) 0.25-0.5 1-2 10+ Estimated energy cost/year (0,06/kwh) R210 R57.5 R11
  • 17. Final Report 5709-349-0 16 Note: Not all LED exit signs are the same. Some are of lower quality and decrease their light output after a few years. Be sure to look for LED signs with semiconductor material that is made of aluminum, indium, gallium, and phosphor. Also, some LED signs have lights that are wired in a series circuit, meaning that when one LED light burns out, the whole sign loses its light. Look for LED exit signs that are wired in a parallel circuit. 3.4 Proposed Solution Despite the significant savings that may be achieved through modifications to lighting systems, inappropriate actions such as: The lack of switching off lights upon leaving or the lack of switching off lights when day light is sufficient can have a far more dramatic effect on worker and occupant productivity and comfort. In order to optimize the energy saving of an illumination system, the right choice of choosing the correct lamps for the specific application is only one aspect of electrical energy conservation. A second important factor is to control the lights so that areas where there are people must be illuminated while areas where there are no people could be dark. In the rest of the study, I will design and develop a software program for a programmable logic controller (PLC) system and the peripheral hardware to control a lighting system for a building. 4. Detailed design 4.1 Introduction A single floor office block with three main areas will be the basis for this design. Figure 4.1 The project schematic
  • 18. Final Report 5709-349-0 17 4.2 For this design a Klockner Moeller PLC was selected because: Inputs and outputs are 230v Low cost Easier programming because of LCD display Smart size Relay isolated outputs Figure 4.2 Klockner Moeller PLCs 4.3 PIR alarm sensors will be used 12v PSU PIR sensors allow you to sense motion, almost always used to detect whether a human has moved in or out of the sensors range. They are small, inexpensive, low-power, easy to use and don't wear out. For that reason they are commonly found in appliances and gadgets used in homes or businesses. They are often referred to as PIR, "Passive Infrared", "Pyroelectric", or "IR motion" sensors. Figure 4.3 PIR PCBs both sides PIRs are basically made of a pyroelectric sensor (which you can see above as the round metal can with a rectangular crystal in the center), which can detect levels of infrared radiation. Everything emits some low level radiation, and the hotter something is, the
  • 19. Final Report 5709-349-0 18 more radiation is emitted. The sensor in a motion detector is actually split in two halves. The reason for that is that we are looking to detect motion (change) not average IR levels. The two halves are wired up so that they cancel each other out. If one half sees more or less IR radiation than the other, the output will swing high or low. Figure 4.4 The pyroelectric sensor The older PIRs looked like this: Figure 4.5 The older PIR
  • 20. Final Report 5709-349-0 19 The new PIRs have more adjustable settings and have a header installed in the 3-pin ground/out/power pads. Figure 4.6 The new PIR For many basic projects or products that need to detect when a person has left or entered the area, or has approached, PIR sensors are great. They are low power and low cost, pretty rugged, have a wide lens range, and are easy to interface with. Note that PIRs won't tell you how many people are around or how close they are to the sensor, the lens is often fixed to a certain sweep and distance (although it can be hacked somewhere) and they are also sometimes set off by housepets. Experimentation is key. Size: Rectangular Price: R150 Output: Digital pulse high (3V) when triggered (motion detected) digital low when idle (no motion detected). Pulse lengths are determined by resistors and capacitors on the PCB and differ from sensor to sensor. Sensitivity range: up to 20 feet (6 meters) 110° x 70° detection range Power supply: 3V-9V input voltage, but 5V is ideal. How PIRs Work PIR sensors are more complicated than many of the other sensors (like photocells, FSRs and tilt switches) because there are multiple variables that affect the sensors input and output. To begin explaining how a basic sensor works, we'll use this rather nice diagram.
  • 21. Final Report 5709-349-0 20 The PIR sensor itself has two slots in it, each slot is made of a special material that is sensitive to IR. The lens used here is not really doing much and so we see that the two slots can 'see' out past some distance (basically the sensitivity of the sensor). When the sensor is idle, both slots detect the same amount of IR, the ambient amount radiated from the room or walls or outdoors. When a warm body like a human or animal passes by, it first intercepts one half of the PIR sensor, which causes a positive differential change between the two halves. When the warm body leaves the sensing area, the reverse happens, whereby the sensor generates a negative differential change. These change pulses are what is detected. Figure 4.7 PIR detecting procedures The PIR Sensor The IR sensor itself is housed in a hermetically sealed metal can to improve noise/temperature/humidity immunity. There is a window made of IR-transmissive material (typically coated silicon since that is very easy to come by) that protects the sensing element. Behind the window are the two balanced sensors.
  • 22. Final Report 5709-349-0 21 Figure 4.8 The element window, the two pieces of sensing material Figure 4.9 The Internal schematic of the PIR sensor This image shows the internal schematic. There is actually a JFET inside (a type of transistor) which is very low-noise and buffers the extremely high impedence of the sensors into something a low-cost chip (like the BIS0001) can sense.
  • 23. Final Report 5709-349-0 22 Lenses PIR sensors are rather generic and for the most part vary only in price and sensitivity. Most of the real magic happens with the optics. This is a pretty good idea for manufacturing: the PIR sensor and circuitry is fixed and costs a few Rands. The lens costs only a few cents and can change -the breadth, range, sensing pattern, very easily. In the diagram up top, the lens is just a piece of plastic, but that means that the detection area is just two rectangles. Usually we'd like to have a detection area that is much larger. To do that, we use a simple lens such as those found in a camera: they condenses a large area (such as a landscape) into a small one (on film or a CCD sensor). For reasons that will be apparent soon, we would like to make the PIR lenses small and thin and moldable from cheap plastic, even though it may add distortion. For this reason the sensors are actually Fresnel lenses. Figure 4.10 The Fresnel lens condenses light providing a larger range of IR to the sensor. Figure 4.11 The Fresnel lens provides a larger range of IR to the sensor
  • 24. Final Report 5709-349-0 23 Figure 4.12 The focal length of the IR OK, so now we have a much larger range. However, remember that we actually have two sensors, and more importantly we don’t want two really big sensing-area rectangles, but rather a scattering of multiple small areas. So what we do is split up the lens into multiple section, each section of which is a fresnel lens Figure 4.13 The multiple facet-sections
  • 25. Final Report 5709-349-0 24 Figure 4.14 A macro shot showing the different Fresnel lenses in each facet The different faceting and sub-lenses create a range of detection areas, interleaved with each other. That’s why the lens centers in the facets above are 'inconsistent' - every other one points to a different half of the PIR sensing element Figure 4.15 Different angles of the Fresnel lenses
  • 26. Final Report 5709-349-0 25 TESRING A PIR Figure 4.16 PIR test schematic Figure 4.17 PIR test wiring When the PIR detects motion, the output pin will go "high" to 3.3V and light up the LED. RETRIGGERING There's a couple options you may have with your PIR. First up we'll explore the 'Retriggering' option. Once you have the LED blinking, look on the back of the PIR sensor and make sure that the jumper is placed in the L position as shown below. Figure 4.18 Back of the PIR with the jumper in the L position.
  • 27. Final Report 5709-349-0 26 Now set up the testing board. You may notice that when connecting up the PIR sensor as above, the LED does not stay on when moving in front of it but actually turns on and off every second or so. That is called "non-retriggering". Figure 4.19 Graph showing the non-retriggering option of the PIR. Now change the jumper so that it is in the H position. If you set up the test, you will notice that now the LED does stay on the entire time that something is moving. That is called "retriggering". Figure 4.20 Graph showing the retriggering option of the PIR. For most applications, "retriggering" (jumper in H position as shown below) mode is a little nicer. Figure 4.21 Back of the PIR showing the jumper in H position.
  • 28. Final Report 5709-349-0 27 If you need to connect the sensor to something edge-triggered, you'll want to set it to "non-retriggering" (jumper in L position). CHANGING SENSITIVITY The PIR has a trimpot on the back for adjusting sensitivity. You can adjust this if your PIR is too sensitive or not sensitive enough - clockwise makes it more sensitive. Figure 4.22 The trimpot of a PIR for changing sensitivity. CHANGING Pulse Time and Time out Length There are two 'timeouts' associated with the PIR sensor. One is the "Tx" timeout: how long the LED is lit after it detects movement - this is easy to adjust on because there's a potentiometer. The second is the "Ti" timeout which is how long the LED is guaranteed to be off when there is no movement. This one is not easily changed but if you're handy with a soldering iron it is within reason. First, let’s take a look at the BISS datasheet Tx= The time duration which the output pin (Vo) remains high after triggering. Ti= During this time period, triggering is inhibited. Tx≈24576xR10xC6; Ti≈24xR9xC7 (ref to schematic) On PIR sensors, there's a little trim potentiometer labeled TIME. This is a 1 Mega ohm adjustable resistor which is added to a 10Kseries resistor. And C6 is 0.01uF so Tx = 24576 x (10K + Rtime) x 0.01uF.
  • 29. Final Report 5709-349-0 28 If the Rtime potentiometer is turned all the way down counter-clockwise (to 0 ohms) then Tx = 24576 x (10K) x 0.01uF = 2.5 seconds (approx.) If the Rtime potentiometer is turned all the way up clockwise to 1 Megaohm then Tx = 24576 x (1010K) x 0.01uF = 250 seconds (approx.) If RTime is in the middle, that'd be about 120 seconds (two minutes) so you can tweak it as necessary. For example if you want motion from someone to turn on a fan for a minimum of 1 minute, set the Rtime potentiometer to about 1/4 the way around. READING PIR Sensors. Connecting PIR sensors to a microcontroller is really simple. The PIR acts as a digital output so all you need to do is listen for the pin to flip high (detected) or low (not detected). It’s likely that you'll want retriggering, so be sure to put the jumper in the H position. Power the PIR with 5V and connect ground to ground. Then connect the output to a digital pin. Figure 4.23 Connecting a PIR to a Microcontroller. The code is very simple, and is basically just keeps track of whether the input to pin 2 is high or low. It also tracks the state of the pin, so that it prints out a message when motion has started and stopped. /* * PIR sensor tester */ int ledPin = 13; // choose the pin for the LED int inputPin = 2; // choose the input pin (for PIR sensor) int pirState = LOW; // we start, assuming no motion detected int val = 0; // variable for reading the pin status
  • 30. Final Report 5709-349-0 29 void setup() { pinMode(ledPin, OUTPUT); // declare LED as output pinMode(inputPin, INPUT); // declare sensor as input Serial.begin(9600); } void loop(){ val = digitalRead(inputPin); // read input value if (val == HIGH) { // check if the input is HIGH 4.4 230v day/night sensor directly connected to plc input A Day/Night Sensor can automatically turn on or off lights at dusk and dawn. It is not only convenient but also practical; it can control the lighting loads by working only at night. Examples of use are street lights, office lights, and warehouse and factory lights, garden lights. SPECIFICATION Power source: 220V – 240V/AC Power Frequency: 50Hz Rated Current: 25A Ambient Light: <5LUX to 50 LUX (adjustable) Working Temperature: -20º to +40 º Working Humidity: <93%RH WIRING DIAGRAM Figure 4.24 Day/Night sensor Wiring diagram L - Live in N - Neutral In A - Output to Lamp (Load)
  • 31. Final Report 5709-349-0 30 4.5 Software implemented timers will be used The Ladder Diagram is a graphics oriented programming language which approaches the structure of an electric circuit. The Ladder Diagram consists of a series of networks. A network is limited on the left and right sides by a left and right vertical current line. In the middle is a circuit diagram made up of contacts, coils, and connecting lines. Each network consists on the left side of a series of contacts which pass on from left to right the condition "ON" or "OFF" which correspond to the Boolean values TRUE and FALSE. To each contact belongs a Boolean variable. If this variable is TRUE, then the condition is passed from left to right along the connecting line. Otherwise the right connection receives the value OFF. 5. Experimental Evaluation 5.1Software part As indicated previously that we are going to use the ladder diagram programming language. Figure 5.1 Ladder programming T1, T2, T3 represent respectively the contacts of timer1, timer2 and timer3 that we had set to 10 seconds each.I4 is the input 4 that represents our Day/night sensor.Q1, Q2, Q3 represent respectively Output 1(or light for Area 1), output 2(or light for Area 2) and Output 3 (or light for Area 3).
  • 32. Final Report 5709-349-0 31 I1, I2 and I3 that are normally closed contacts represent respectively the PIR 1, PIR2 and PIR3 Let us explain now how our program works: 1. Phase 1 during the day (when there is enough light entering the Day/Night sensor) Figure 5.2 Day/Night sensor 1.1 No people movement When we switch on our PLC nothing will happen because the day/night is in a zero Boolean state because of the light entering it and because the PIR will also be in a zero Boolean state since there is no people movement our output (lamp) will remain off. 1.2 People movement When there is people movement the PIR detects people presence it will go ON or a True (One) Boolean state it means the timer will be triggered and T1 will become a normally closed contact but our Output (light) will remain off because T1 and I4 are in series since T1 is a 1 and I4 a 0 both are acting like a AND gate. 2. Phase 2 During night (or when there is no enough light entering the day/night sensor) Figure 5.3 Day/Night sensor when there is no enough light entering it
  • 33. Final Report 5709-349-0 32 2.1 No people movement When there is no people movement the PIR is in the zero Boolean state and the Day/night is in a 1 Boolean since they are in series the output (light) will be off. 2.2 people movement When there is people movement both PIR and the Day/Night will be in a 1 state Boolean state then the output (light) will be on. 5.2 Hardware part Figure 5.4 A programmed PLC for hardware wiring Figure 5.5 The wiring diagram
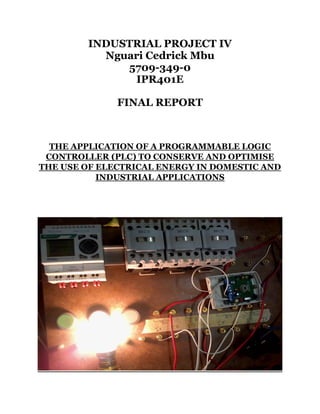
  • 34. Final Report 5709-349-0 33 A transistor PIR needs an external relay to isolate the 220v from it. Figure 5.6 External relay Figure 5.7 12v DC supply for the PIR We connected a resistor in series to the live going to the PIR to limit the current. Figure 5.8 Resistor connected to the live Then we did the wiring to connect both inputs: Figure 5.9 An open PIR Figure 5.10 PIR
  • 35. Final Report 5709-349-0 34 Figure 5.11 A Day/Night sensor Figure 5.12The complete project 6. Results Depending on the characteristics of the space to be controlled, energy savings as high as 90% can be realized through use of PIR sensors and Day/Night sensors combined.
  • 36. Final Report 5709-349-0 35 Table 6.1 Table of results OCCUPANCY AREA ENERGY SAVINGS Private office 15-50% Classroom 40-50% Conference room 25-70% Restrooms 32-72% Corridors 32-84% Storage areas 50-80% 7. Analysis of results When occupancy in a given space is predictable, switching can often be scheduled using simple devices such as time-clocks and timer-switches to save energy. When occupancy is not predictable, then switching can be automated using occupancy sensors (PIR sensors). PIR sensors detect when a space is occupied or unoccupied and turn the lights on or off automatically after a short period of time to save energy. The results was established by considering also the following variables: 1. Technology: choose method of motion detection that will best meet the application need. 2. Sensitivity: determine how sensitive the sensor should be to movement so that it effectively detects minor and major motion without nuisance switching (on/off).Sensors are now available which provide automatic adjustments of time delay and sensitivity. In this models, manual set-up and subsequent adjustments are unnecessary. 3. Coverage area: specify range and coverage area for the motion detector based on the desired level of sensitivity. 4. Mounting: locate the sensor for maximum effect. 5. Time delay: determine how long the sensor should wait before turning out the lights when the space is unoccupied to be convenient for users but also maximize energy savings. 6. Cut off: determine whether the occupancy sensor’s coverage area must be restricted so that it will not monitor adjacent areas that should not be monitored (such as a hallway outside a controlled private office).
  • 37. Final Report 5709-349-0 36 7. Special features: specify special features for the sensor based on available offerings from manufacturer and application need. 8. Discussion Lighting alone can make up to 50% of your business energy usage. Your office might waste a lot of that energy if its light are left on in empty rooms. Cutting back on wasted lighting can mean major energy savings. When you install PIR sensors. Saving energy becomes automatic. How much energy can you really save when you install PIR sensors? Many businesses hesitate to upgrade their offices with PIR sensors because they do not think they can afford the cost of the sensors, installation and possible downtime. The truth is, businesses cannot afford not use occupancy sensors (PIR sensors). An EPA study showed that within just 14 days of installation, buildings with occupancy sensors reduced their energy waste by as much as 68%...increasing energy savings by as much as 60%.They found the most energy waste was reduced in restrooms and conference rooms, where lights are often left on, even when the spaces are unoccupied. You can adjust your sensors time delay for the most energy savings. A short 5 minutes delay means the lights will shut off after five minutes of no detected movement. However, someone working quietly might find themselves left in dark if the time delay is too short for the given space. In order for a PIR to work well most of the time, they are designed with certain limitations. A PIR sensor cannot detect a stationary or very slow moving body. If the sensor was set to the required sensitivity, it would be activated by the cooling of a nearby wall in the evening, or by very small animals.Similary, if someone walks straight towards a PIR sensor, it will not detect them until they are very close.
  • 38. Final Report 5709-349-0 37 9. Conclusions and Recommendations 1. According to Smith (2005:10):‟Microcontrollers are now providing us with a new way of designing circuits.Designs,which at one time required many digital ICs and lengthy Boolean algebra calculations, can now be programmed simply into one microcontroller.” This proved to be true in our case.Peatman (2003:1) states the following: ‟Electronic intelligence is hidden inside the products we use in our daily lives. As the cost of the integrated circuits that provide this intelligence has dropped over the years, the number of manufactures using these devices and their diverse applications has exploded.” 2. There is also a wide range of embedded or self-contained devices that are available (Predko2002:2).Therefore important choices need to be made in this regard. 3. This project also made it evident how an original idea, proposal, concept or even the complexity and the design procedure can vary during different stages or phases of the project. It also illustrates the great diversity in this particular field. One of the issues is the ability to provide relatively complex interfaces for applications using a simple PLC. Additionally it was important to note that a project is based on a collection of different development efforts (for hardware and software) and not a development process in a single discipline. 4. With regard to the hardware design, datasheets are extremely important. 5. Environmental factors are very influential onto the circuit, thus, any changes in the room temperature or pressure would have an influence on the output. In order to obtain a successful operation, the environmental factors should be taken in great consideration. 6. To improve this project, the designers could use a programmable microcontroller which can be instructed with the language C or C#. 7. Finally this type of project and of course as a subject forms a solid basis or foundation in the approach or involvement in any future projects.
  • 39. Final Report 5709-349-0 38 10. Bibliography 1. CANIOU.07-1999.Passive Infrared detection: Theory and Application.USA.Hardback. 2. S.Melville and w.Goddard.2005.Research Methodology. Second Edition.SA.Juta & Co. 3. FLOYD, T.L.1997.Digital Fundamentals. Sixth Edition.USA.Prentice Hall. 4. CAMPBEL T.2007.PLC Programming Hand Book.Third.Edition.USA.McGraw-Hill. 5. HAROWITZ, P. & HILL, W.1996.The Art of Electronics. Second Edition. Great Britain. Cambridge University Press. 6. MAJOR TECH.2013.Day/Night Sensor DNS25 Instruction Manual.SA Isando. 7. BALDOR.2001.BISS Technical Datasheet. Circuit Standard SSI. 8. KILIAN, C.T.2006.Modern Control Technology. Third Edition.USA.Delmar. 9. STROUD, K.A.1995.Engineering Mathematics. Fourth Edition.UK.Macmillan. 10. UNISA.2005.Industrial Project IV.Study Guide 1. 11. UNISA.2005.Industrial Project IV.Study Guide 2. 12. www.klocknermoeller.com 13. www.energysavingsensors.com
  • 40. Final Report 5709-349-0 39 11. Appendices 1. Circuit diagrams……………………………………………………………………………1 2. The 4 other PLC’s programming language……………………………………….2 3. Cost analysis…………………………………………………………………………………4 4. CD ROM ► Design Project Operation.
  • 41. Final Report 5709-349-0 40 1. Circuit diagrams Figure 11.1 PIR sensor Circuit Diagram. Figure 11.2 Day/Night sensor Circuit Diagram.
  • 42. Final Report 5709-349-0 41 2. The 4 other PLC’s programming language Figure 11.3 An Example of the INSTRUCTION LIST programming language. Figure 11.4 An example of a FUNCTION BLOCK DIAGRAM programming language.
  • 43. Final Report 5709-349-0 42 Figure 11.5 An example of a SEQUENTIAL FUNCTION CHART programming language. Figure 11.6 An example of a SEQUENTIAL TEST programming language.
  • 44. Final Report 5709-349-0 43 3.Cost Analysis A cost analysis of the material used in the design project. Quantity Description Price 3 Resistor 1/4w 2k7 5 3 PIR sensor 600 1 Day/Night sensor 250 1 PLC and Connectors bench 3500 Other materials (approx.) 950 Total R5305