SlideShare una empresa de Scribd logo
1 de 29
C.J. Pretorius¹, W.F. Schmidt¹ C.S. van Staden¹
K. Egger²
¹ Department of Water Affairs and Forestry, Republic of South Africa
² Schneider Ingenieur AG, Chur, Switzerland
10th INTERNATIONAL SYMPOSIUM ON DEFORMATION MEASUREMENTS
Orange, California, USA
THE EXTENSIVE GEODETIC SYSTEM USED FOR THE
MONITORING OF A 185 METRE HIGH ARCH DAM
IN
SOUTHERN AFRICA
•Provide Lesotho with hydro-
electricity
Features:
•double curvature arch dam
•185 m high above foundation
•crest length of 710 meter
•crest thickness 9 meter
•base width 60 meters
•To supplement water to the
Gauteng industrial area of the
Republic of South Africa;
Main objectives:
Katse Dam
Lesotho Highlands Water Project
Reference : Meas 9101
Point P01
Meas du dv dz
9211 .0 .4 .4
9612 .1 .1 -11.6
9709 -.2 .1 -13.3
9803 -.2 .2 -14.6
9807 .1 .0 -15.3
Point P02
Meas du dv dz
9211 .0 .3 -.5
9612 -9.9 2.4 -8.7
9709 -11.8 5.0 -17.3
9803 -12.4 5.1 -18.1
9807 -11.9 5.4 -19.1
Point P08
Meas du dv dz
9211 3.2 -.6 -1.7
9612 4.0 -.7 -11.1
9709 3.9 1.0 -13.6
9803 3.6 1.4 -14.2
9807 3.8 .1 -15.4
Deformations after impounding started 1996
• Correlation between pendulums and the Geodetic triangulation may take place
on the crest of the dam, galleries inside the dam wall and exits on the downstream
face of the dam
Concept of the Geodetic Deformation Measurements
• Close correlation between Instrumentation and Geodetic measurements
Correlation between Instrumentation and the Geodetic System
• Results of instruments which record relative displacements, when evaluated
together with Geodetic results, their relative displacements become absolute
• Multistage Geodetic system - full, reduced and mini measurements
have to be employed
• Establishment of an extensive triangulation network
Measurement intervals
• Concrete dams are subject to expansion and contraction because of changes in
temperature and pressure of the water load between summer and winter
• Monitoring therefore takes place during late summer (February) and winter (August) when
the expansion and contraction is at its maximum and minimum
INTRODUCTION
Basic Layout:
• Instrumentation
• Pendulums
• Triangulation Network
• Traverses & Pendulums
43 Vibrating Wire Extensometers
442 Vibrating wire Jointmeters
28 Vibrating wire Strain gauges
64 Thermometers
100 Vibrating wire Piezometers
22 Vibrating wire pressure transducers
24 Clinometer
8 Trivec stations
.... Leakage Weirs
.... Water Level measuring Devices ext
INSTRUMENTATION
Consists of:
Equipment Used
Leica TC2002 Leica TCA2003 Kern H.D. Tripod Kern Plummit
Kern E2 Iseth Distometer Leica NA3003 60 cm Digit Scale
Illuminated Target Altrimetric 60cm
Digit Scale
Crest Targets
Instrument Adaptors
Vertical Target
Illuminated Targets
TRIANGULATION NETWORK
5 Primary Pillars
7 Secondary Pillars
4 Crest Pillars
6 Gal Exit Pillars
4 Exit Brackets
6 Primary Benchmarks
22 Secondary Benchmarks
TRAVERSES & PENDULUMS
17 Hanging Pendulums9 Inverted Pendulums
6 Optical Align Brackets
6 Pendulums Anchors
2060
2005
1945
1900
Traverse Brackets
Crest Pillar
2 Altrimetric wire anchors
The Arch Dam
19 Parapet targets
Gal Exit Pillars
6 Opt. A. Points
Connections Traverse - Net
Pendulum
Chamber
Gal Exit Pillar with
pendulum chambers
Opt Alignment Point
Inverted Pendulum
El : 2005
D- GALLERY
7 Hanging Pendulums
7 Pendulum Anchors
5 Gal Exit Points
38 Traverse Brackets
6 Pillars
D - ACCESS
El:2008 - 2000
Pillars
Station Points
Brackets
Exit
Exit
Dam Wall
E Gallery
Left Flank
Rock Abutment
Gallery Exit
Pillar
Gallery Exit
Point
Traverse Pillars/Brackets
E - ACCESS
El: 1994 - 2036
Gallery Exit
Bracket
Crest Benchmarks Traverse Brackets Altrimetric Wires
PRECISE LEVELLING
ON DAM WALL
Adjustment Method used
• Helmert/91 program system
• Three-dimensional adjustment
• Based on theory of least squares
Definition of Adjustment
• Constants and Unknown parameters (co-ordinates etc.)
• Definition of the generalised Helmert - transformation
• Definition of an adequate stochastic model
Network
Mean Error Ellipses (U,V) Code A B Theta Mhe
mm mm o mm
Primary Pillar : P01 .39 .28 58.58 1.49
El 2060 Pillar : P115 .23 .19 85.13 .46
Alignment Point : R111 .40 .39 122.11 .50
Parapet Target : 111 .54 .52 37.04 .50
Bench mark : C11 ..... ..... ........ .47
El 2005 Pillar : P200 .27 .22 90.44 .43
El 1945 Pillar : P300 .28 .23 88.46 .42
The mean error ellipses depend on:
• Accuracy of observations
• Geometry of the geodetic network, and
• Selection of fixed points/Helmert control points
Traverses
Mean Error Ellipses (U,V) Code A B Theta Mhe
mm mm o mm
El 2005 Right Flank : 253 .34 .29 160.15 .30
Centre Bracket : 200 .14 .09 179.06 .17
Left Flank : 236 .22 .16 38.04 .24
El 1945 Right Flank : 337 .67 .22 150.49 .37
Centre Bracket : 300 .13 .10 179.42 .24
Left Flank : 336 .62 .21 28.16 .42
El 1900 Right Flank : 427 1.93 .57 153.31 .67
Centre Bracket : 400 .70 .44 179.20 .59
Left Flank : 426 1.67 .52 27.55 .69
Optical Align Point El 2052 : TA11 .47 .42 73.47 ....
Hanging Pendulum : DH0 .49 .39 101.09 ....
Inverse Pendulum :VKM0 1.37 .59 177.18 ....
Altrimetric Wire : AW11 .... .... .... .35
Mean error ellipses refer to Optical Alignment and Gallery
exit points as fixed points in the adjustments
Horizontal Displacements
El. 2060
Winter
Summer
-16 mm
Summer
Winter
- 5 mm
Horizontal Displacements
El. 2005
Summer
Winter
- 4.3 mm
Vertical Displacements
El. 2060
0.2 mm
Vertical Displacements
El. 2005
Left- Right Flank Contour Displacement
El. 2060, 2005, 1945 and 1900
Right Flank Left Flank
-7.5 - -8.5 mm+7.5 - +8.5 mm
Up/Downstream Contour Displacement
El. 2060, 2005, 1945 and 1900
-20.0 - -17.5 mm -10.0 - -7.5 mm-10.0 - -7.5 mm
Vertical Contour Displacement
El. 2060, 2005, 1945 and 1900
-7.5 - -6.25 mm
Mapeleng Crack
Upstream 10 Km on right flank
1.5 Km long , up to 70mm wide
• The Geodetic Scheme is of a high standard
• The scheme gives a high degree of information on the behaviour of the
dam
• Scheme is not only based on the network and traverse disposition but
also on the inclusion of the total pendulum system
• Scheme offers a variety of reduced measurements
• Easily accessible and ensure a high efficiency
• Provides adequate geodetic information of the structure and the
surrounding areas over a long period of time.
Conclusions
Katse dam monitoring

Más contenido relacionado

La actualidad más candente

Hamza-Nasir_CEME-Mechatronics-Presentation-Weatherford
Hamza-Nasir_CEME-Mechatronics-Presentation-WeatherfordHamza-Nasir_CEME-Mechatronics-Presentation-Weatherford
Hamza-Nasir_CEME-Mechatronics-Presentation-Weatherford
Hamza Nasir
 
Maria Krutikova Compendium
Maria Krutikova CompendiumMaria Krutikova Compendium
Maria Krutikova Compendium
Maria Krutikova
 

La actualidad más candente (20)

Data Center Cooling System Design: Reducing Cooling Costs and Power Consumpti...
Data Center Cooling System Design: Reducing Cooling Costs and Power Consumpti...Data Center Cooling System Design: Reducing Cooling Costs and Power Consumpti...
Data Center Cooling System Design: Reducing Cooling Costs and Power Consumpti...
 
Wind Analysis: Boston Seaport District
Wind Analysis: Boston Seaport DistrictWind Analysis: Boston Seaport District
Wind Analysis: Boston Seaport District
 
ISM 2016 A Mining Imperative: Enhanced accuracy of real-time spatial data and...
ISM 2016 A Mining Imperative: Enhanced accuracy of real-time spatial data and...ISM 2016 A Mining Imperative: Enhanced accuracy of real-time spatial data and...
ISM 2016 A Mining Imperative: Enhanced accuracy of real-time spatial data and...
 
Hamza-Nasir_CEME-Mechatronics-Presentation-Weatherford
Hamza-Nasir_CEME-Mechatronics-Presentation-WeatherfordHamza-Nasir_CEME-Mechatronics-Presentation-Weatherford
Hamza-Nasir_CEME-Mechatronics-Presentation-Weatherford
 
Smoke Control in a Car Park with Cloud Based CFD
Smoke Control in a Car Park with Cloud Based CFDSmoke Control in a Car Park with Cloud Based CFD
Smoke Control in a Car Park with Cloud Based CFD
 
SimScale Pedestrian Wind Comfort Capabilities
SimScale Pedestrian Wind Comfort CapabilitiesSimScale Pedestrian Wind Comfort Capabilities
SimScale Pedestrian Wind Comfort Capabilities
 
Basics of building aerodynamics & their effects on pedestrian comfort
Basics of building aerodynamics & their effects on pedestrian comfortBasics of building aerodynamics & their effects on pedestrian comfort
Basics of building aerodynamics & their effects on pedestrian comfort
 
Thermal Comfort Assessment: Comply with EN 15251 and EPBD
Thermal Comfort Assessment: Comply with EN 15251 and EPBDThermal Comfort Assessment: Comply with EN 15251 and EPBD
Thermal Comfort Assessment: Comply with EN 15251 and EPBD
 
Hybrid Ventilation using CFD Simulation in the Cloud
Hybrid Ventilation using CFD Simulation in the CloudHybrid Ventilation using CFD Simulation in the Cloud
Hybrid Ventilation using CFD Simulation in the Cloud
 
How to use CFD for Water Cooled Electronics
How to use CFD for Water Cooled ElectronicsHow to use CFD for Water Cooled Electronics
How to use CFD for Water Cooled Electronics
 
SimScale Demo and Discussion on External AEC
SimScale Demo and Discussion on External AECSimScale Demo and Discussion on External AEC
SimScale Demo and Discussion on External AEC
 
Muneeb 21st adls
Muneeb 21st adls Muneeb 21st adls
Muneeb 21st adls
 
Pedestrian Wind Comfort Assessment for Master Planning
Pedestrian Wind Comfort Assessment for Master Planning Pedestrian Wind Comfort Assessment for Master Planning
Pedestrian Wind Comfort Assessment for Master Planning
 
TcpET
TcpETTcpET
TcpET
 
Maria Krutikova Compendium
Maria Krutikova CompendiumMaria Krutikova Compendium
Maria Krutikova Compendium
 
Brent Goliath NCPC-SA
Brent Goliath NCPC-SABrent Goliath NCPC-SA
Brent Goliath NCPC-SA
 
Sunsight Antenna Alignment intro
Sunsight Antenna Alignment introSunsight Antenna Alignment intro
Sunsight Antenna Alignment intro
 
Pipe monitoring 38 44
Pipe monitoring 38 44Pipe monitoring 38 44
Pipe monitoring 38 44
 
SimScale to IES for Building Simulation
SimScale to IES for Building SimulationSimScale to IES for Building Simulation
SimScale to IES for Building Simulation
 
Severn Partnership
Severn Partnership Severn Partnership
Severn Partnership
 

Similar a Katse dam monitoring

Current meter, electromagnetic
Current meter, electromagneticCurrent meter, electromagnetic
Current meter, electromagnetic
hydrologyproject0
 
POWER POINT PRESENTATION-MSC PROJECT
POWER POINT PRESENTATION-MSC PROJECTPOWER POINT PRESENTATION-MSC PROJECT
POWER POINT PRESENTATION-MSC PROJECT
Wasiu Oseni
 

Similar a Katse dam monitoring (20)

Vortex flow meter manual
Vortex flow meter manualVortex flow meter manual
Vortex flow meter manual
 
EIT_Presentation
EIT_PresentationEIT_Presentation
EIT_Presentation
 
Oscilloscope
OscilloscopeOscilloscope
Oscilloscope
 
Quishpe mireya practica6
Quishpe mireya practica6Quishpe mireya practica6
Quishpe mireya practica6
 
Turbimax cus31 endress+hauser datasheet-turbidity sensor
Turbimax cus31 endress+hauser datasheet-turbidity sensorTurbimax cus31 endress+hauser datasheet-turbidity sensor
Turbimax cus31 endress+hauser datasheet-turbidity sensor
 
Turbidity sensor-Turbimax CUS31
Turbidity sensor-Turbimax CUS31Turbidity sensor-Turbimax CUS31
Turbidity sensor-Turbimax CUS31
 
Presentation on electrical and automation system of cgl plant (CRM-2) JSW KR.
Presentation on electrical and automation system of cgl plant (CRM-2) JSW KR.Presentation on electrical and automation system of cgl plant (CRM-2) JSW KR.
Presentation on electrical and automation system of cgl plant (CRM-2) JSW KR.
 
ESS Earth Science Monitoring Solutions Presentation
ESS Earth Science Monitoring Solutions PresentationESS Earth Science Monitoring Solutions Presentation
ESS Earth Science Monitoring Solutions Presentation
 
Part 8 chap 1-appendices a, b, c
Part 8 chap 1-appendices a, b, cPart 8 chap 1-appendices a, b, c
Part 8 chap 1-appendices a, b, c
 
Condumax w CLS 21 D-endress+hauser datasheet-conductivity sensors
Condumax w CLS 21 D-endress+hauser datasheet-conductivity sensorsCondumax w CLS 21 D-endress+hauser datasheet-conductivity sensors
Condumax w CLS 21 D-endress+hauser datasheet-conductivity sensors
 
Mod mag m4000 datasheet badger meter electromagnetic flow meter_m-series
 Mod mag m4000 datasheet badger meter electromagnetic flow meter_m-series Mod mag m4000 datasheet badger meter electromagnetic flow meter_m-series
Mod mag m4000 datasheet badger meter electromagnetic flow meter_m-series
 
Kinetrol HD 1/4 Turn Electric Actuator
Kinetrol HD 1/4 Turn Electric ActuatorKinetrol HD 1/4 Turn Electric Actuator
Kinetrol HD 1/4 Turn Electric Actuator
 
Electromagnetic Flow Meter for Process Measurement
Electromagnetic Flow Meter for Process MeasurementElectromagnetic Flow Meter for Process Measurement
Electromagnetic Flow Meter for Process Measurement
 
Fluke clamp meter selection guide
Fluke clamp meter selection guideFluke clamp meter selection guide
Fluke clamp meter selection guide
 
Current meter, electromagnetic
Current meter, electromagneticCurrent meter, electromagnetic
Current meter, electromagnetic
 
07 chapter07 loop_diagrams
07 chapter07 loop_diagrams07 chapter07 loop_diagrams
07 chapter07 loop_diagrams
 
POWER POINT PRESENTATION-MSC PROJECT
POWER POINT PRESENTATION-MSC PROJECTPOWER POINT PRESENTATION-MSC PROJECT
POWER POINT PRESENTATION-MSC PROJECT
 
Solids Content Sensor-TurbiMax W CUS 41-CUS 41-W
Solids Content Sensor-TurbiMax W CUS 41-CUS 41-WSolids Content Sensor-TurbiMax W CUS 41-CUS 41-W
Solids Content Sensor-TurbiMax W CUS 41-CUS 41-W
 
automobile radiator project
automobile radiator projectautomobile radiator project
automobile radiator project
 
project report on REMOTE SENSING THERMOMETER
project report on REMOTE SENSING THERMOMETERproject report on REMOTE SENSING THERMOMETER
project report on REMOTE SENSING THERMOMETER
 

Katse dam monitoring

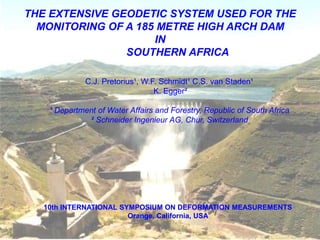
  • 1. C.J. Pretorius¹, W.F. Schmidt¹ C.S. van Staden¹ K. Egger² ¹ Department of Water Affairs and Forestry, Republic of South Africa ² Schneider Ingenieur AG, Chur, Switzerland 10th INTERNATIONAL SYMPOSIUM ON DEFORMATION MEASUREMENTS Orange, California, USA THE EXTENSIVE GEODETIC SYSTEM USED FOR THE MONITORING OF A 185 METRE HIGH ARCH DAM IN SOUTHERN AFRICA
  • 2. •Provide Lesotho with hydro- electricity Features: •double curvature arch dam •185 m high above foundation •crest length of 710 meter •crest thickness 9 meter •base width 60 meters •To supplement water to the Gauteng industrial area of the Republic of South Africa; Main objectives: Katse Dam
  • 4. Reference : Meas 9101 Point P01 Meas du dv dz 9211 .0 .4 .4 9612 .1 .1 -11.6 9709 -.2 .1 -13.3 9803 -.2 .2 -14.6 9807 .1 .0 -15.3 Point P02 Meas du dv dz 9211 .0 .3 -.5 9612 -9.9 2.4 -8.7 9709 -11.8 5.0 -17.3 9803 -12.4 5.1 -18.1 9807 -11.9 5.4 -19.1 Point P08 Meas du dv dz 9211 3.2 -.6 -1.7 9612 4.0 -.7 -11.1 9709 3.9 1.0 -13.6 9803 3.6 1.4 -14.2 9807 3.8 .1 -15.4 Deformations after impounding started 1996
  • 5. • Correlation between pendulums and the Geodetic triangulation may take place on the crest of the dam, galleries inside the dam wall and exits on the downstream face of the dam Concept of the Geodetic Deformation Measurements • Close correlation between Instrumentation and Geodetic measurements Correlation between Instrumentation and the Geodetic System • Results of instruments which record relative displacements, when evaluated together with Geodetic results, their relative displacements become absolute • Multistage Geodetic system - full, reduced and mini measurements have to be employed • Establishment of an extensive triangulation network Measurement intervals • Concrete dams are subject to expansion and contraction because of changes in temperature and pressure of the water load between summer and winter • Monitoring therefore takes place during late summer (February) and winter (August) when the expansion and contraction is at its maximum and minimum
  • 6. INTRODUCTION Basic Layout: • Instrumentation • Pendulums • Triangulation Network • Traverses & Pendulums
  • 7. 43 Vibrating Wire Extensometers 442 Vibrating wire Jointmeters 28 Vibrating wire Strain gauges 64 Thermometers 100 Vibrating wire Piezometers 22 Vibrating wire pressure transducers 24 Clinometer 8 Trivec stations .... Leakage Weirs .... Water Level measuring Devices ext INSTRUMENTATION Consists of:
  • 8. Equipment Used Leica TC2002 Leica TCA2003 Kern H.D. Tripod Kern Plummit Kern E2 Iseth Distometer Leica NA3003 60 cm Digit Scale Illuminated Target Altrimetric 60cm Digit Scale Crest Targets Instrument Adaptors Vertical Target Illuminated Targets
  • 9. TRIANGULATION NETWORK 5 Primary Pillars 7 Secondary Pillars 4 Crest Pillars 6 Gal Exit Pillars 4 Exit Brackets 6 Primary Benchmarks 22 Secondary Benchmarks
  • 10. TRAVERSES & PENDULUMS 17 Hanging Pendulums9 Inverted Pendulums 6 Optical Align Brackets 6 Pendulums Anchors 2060 2005 1945 1900 Traverse Brackets
  • 11. Crest Pillar 2 Altrimetric wire anchors The Arch Dam 19 Parapet targets Gal Exit Pillars 6 Opt. A. Points
  • 12. Connections Traverse - Net Pendulum Chamber Gal Exit Pillar with pendulum chambers Opt Alignment Point Inverted Pendulum
  • 13. El : 2005 D- GALLERY 7 Hanging Pendulums 7 Pendulum Anchors 5 Gal Exit Points 38 Traverse Brackets 6 Pillars
  • 14. D - ACCESS El:2008 - 2000 Pillars Station Points Brackets Exit Exit
  • 15. Dam Wall E Gallery Left Flank Rock Abutment Gallery Exit Pillar Gallery Exit Point Traverse Pillars/Brackets E - ACCESS El: 1994 - 2036 Gallery Exit Bracket
  • 16. Crest Benchmarks Traverse Brackets Altrimetric Wires PRECISE LEVELLING ON DAM WALL
  • 17. Adjustment Method used • Helmert/91 program system • Three-dimensional adjustment • Based on theory of least squares Definition of Adjustment • Constants and Unknown parameters (co-ordinates etc.) • Definition of the generalised Helmert - transformation • Definition of an adequate stochastic model
  • 18. Network Mean Error Ellipses (U,V) Code A B Theta Mhe mm mm o mm Primary Pillar : P01 .39 .28 58.58 1.49 El 2060 Pillar : P115 .23 .19 85.13 .46 Alignment Point : R111 .40 .39 122.11 .50 Parapet Target : 111 .54 .52 37.04 .50 Bench mark : C11 ..... ..... ........ .47 El 2005 Pillar : P200 .27 .22 90.44 .43 El 1945 Pillar : P300 .28 .23 88.46 .42 The mean error ellipses depend on: • Accuracy of observations • Geometry of the geodetic network, and • Selection of fixed points/Helmert control points
  • 19. Traverses Mean Error Ellipses (U,V) Code A B Theta Mhe mm mm o mm El 2005 Right Flank : 253 .34 .29 160.15 .30 Centre Bracket : 200 .14 .09 179.06 .17 Left Flank : 236 .22 .16 38.04 .24 El 1945 Right Flank : 337 .67 .22 150.49 .37 Centre Bracket : 300 .13 .10 179.42 .24 Left Flank : 336 .62 .21 28.16 .42 El 1900 Right Flank : 427 1.93 .57 153.31 .67 Centre Bracket : 400 .70 .44 179.20 .59 Left Flank : 426 1.67 .52 27.55 .69 Optical Align Point El 2052 : TA11 .47 .42 73.47 .... Hanging Pendulum : DH0 .49 .39 101.09 .... Inverse Pendulum :VKM0 1.37 .59 177.18 .... Altrimetric Wire : AW11 .... .... .... .35 Mean error ellipses refer to Optical Alignment and Gallery exit points as fixed points in the adjustments
  • 21. Summer Winter - 5 mm Horizontal Displacements El. 2005
  • 22. Summer Winter - 4.3 mm Vertical Displacements El. 2060
  • 24. Left- Right Flank Contour Displacement El. 2060, 2005, 1945 and 1900 Right Flank Left Flank -7.5 - -8.5 mm+7.5 - +8.5 mm
  • 25. Up/Downstream Contour Displacement El. 2060, 2005, 1945 and 1900 -20.0 - -17.5 mm -10.0 - -7.5 mm-10.0 - -7.5 mm
  • 26. Vertical Contour Displacement El. 2060, 2005, 1945 and 1900 -7.5 - -6.25 mm
  • 27. Mapeleng Crack Upstream 10 Km on right flank 1.5 Km long , up to 70mm wide
  • 28. • The Geodetic Scheme is of a high standard • The scheme gives a high degree of information on the behaviour of the dam • Scheme is not only based on the network and traverse disposition but also on the inclusion of the total pendulum system • Scheme offers a variety of reduced measurements • Easily accessible and ensure a high efficiency • Provides adequate geodetic information of the structure and the surrounding areas over a long period of time. Conclusions