
Recomendados
Más contenido relacionado
Similar a fy21-slide-template_final.pdf
Similar a fy21-slide-template_final.pdf (20)
Más de CharlesSantos684817
Más de CharlesSantos684817 (20)
Último
Último (20)
fy21-slide-template_final.pdf
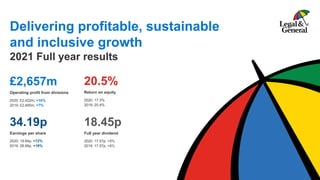
- 1. Delivering profitable, sustainable and inclusive growth 2021 Full year results £2,657m Operating profit from divisions 2020: £2,422m, +10% 2019: £2,485m, +7% 34.19p Earnings per share 2020: 19.84p, +72% 2019: 28.66p, +19% 18.45p Full year dividend 2020: 17.57p, +5% 2019: 17.57p, +5% 20.5% Return on equity 2020: 17.3% 2019: 20.4%
- 2. Forward looking statements • This document may contain ‘forward-looking statements’ with respect to the financial condition, performance and position, strategy, results of operations and businesses of the Company and the Group that are based on current expectations or beliefs, as well as assumptions about future events. These forward-looking statements can be identified by the fact that they do not relate only to historical or current facts. Forward-looking statements often use words such as ‘may’, ‘could’, ‘will’, ‘expect’, ‘intend’, ‘estimate’, ‘anticipate’, ‘believe’, ‘plan’, ‘seek’, ‘continue’ or other words of similar meaning. By their very nature, forward-looking statements are subject to known and unknown risks and uncertainties and can be affected by other factors that could cause actual results, and the Group’s plans and objectives, to differ materially from those expressed or implied in the forward-looking statements. Recipients should not place reliance on, and are cautioned about relying on, any forward-looking statements. • There are several factors which could cause actual results to differ materially from those expressed or implied in forward- looking statements. The factors that could cause actual results to differ materially from those described in the forward- looking statements include (but are not limited to): changes in global, political, economic, business, competitive and market forces or conditions; future exchange and interest rates; changes in environmental, social or physical risks; legislative, regulatory and policy developments; risks arising out of health crises and pandemics; changes in tax rates, future business combinations or dispositions; and other factors specific to the Group. Any forward-looking statement contained in this document is based on past or current trends and/or activities of the Group and should not be taken as a representation that such trends or activities will continue in the future. No statement in this document is intended to be a profit forecast or to imply that the earnings of the Group for the current year or future years will necessarily match or exceed the historical or published earnings of the Group. Each forward-looking statement speaks only as of the date of the particular statement. Except as required by any applicable laws or regulations, the Group expressly disclaims any obligation to revise or update any forward-looking statement contained within this document, regardless of whether those statements are affected as a result of new information, future events or otherwise. 2
- 3. Delivering profitable, sustainable and inclusive growth Sir Nigel Wilson Chief Executive Officer
- 4. Strong financial performance in 2021 187% Solvency II coverage ratio 2020: 175% 2019: 179% £2,262m Operating profit1 2020: £2,041m, +11% 2019: £2,131m, +6% £1.6bn SII operational surplus generation2 2020: £1.5bn, +12% 2019: £1.4bn, +17% 34.19p Earnings per share 2020: 19.84p, +72% 2019: 28.66p, +19% 1. Excludes mortality releases 2. Excludes discontinued operations 4 18.45p Full year dividend 2020: 17.57p, +5% 2019: 17.57p, +5% 20.5% Return on equity 2020: 17.3% 2019: 20.4% Strong profitability… Supported by a strong balance sheet… Driving strong shareholder returns
- 5. Double-digit growth in operating profits delivered 5 £m 2020 2021 % LGRI1 1,229 1,154 (6) LGC 275 461 68 LGIM 407 422 4 LGRR1 322 352 9 LGI 189 268 42 Operating profit from continuing divisions1 2,422 2,657 10 Group costs & discontinued operations (381) (395) Operating profit1 2,041 2,262 11 Profit before tax 1,788 2,488 39 1. Excludes mortality reserve releases (2021: nil, 2020: £177m, £102m LGRI, £75m LGRR). NB: PBT includes 2020 mortality reserve release 44% 17% 16% 13% 10% LGRI LGC LGIM LGRR LGI Very strong growth in LGC – up 68% on 2020 and 27% on 2019
- 6. L&G has delivered a strong and diversified set of financial results and is well positioned for further profitable growth 6 1. LGC is outperforming our capital markets ambition, delivering £461m of profit, and creating significant optionality for annuity front / back books 2. Our UK annuity business was self-financing in 2020 and 2021 and is expected to be self-financing again in 2022 3. We have merged our retail divisions, LGI and LGRR, to create a £600m profit Retail division covering the needs of our c12 million retail policyholders and workplace members 4. LGIM is now a £1.4tn business, with £479bn of International AUM, delivering £1bn of revenue and £35bn of external net flows 5. We have delivered over £2bn of earnings, 34.2p of EPS and an ROE of 20%+
- 7. We have delivered very strong performance over a decade 1,109 1,277 1,329 1,483 1,702 1,902 2,034 2,231 2,496 2,456 2,657 2011 2012 2013 2014 2015 2016 2017 2018 2019 2020 2021 12.42 13.84 15.20 16.70 18.16 21.22 23.10 24.74 28.66 19.84 34.19 2011 2012 2013 2014 2015 2016 2017 2018 2019 2020 2021 Operating profit from divisions1 (£m) Earnings per share2 (p) 6.40 7.65 9.30 11.25 13.40 14.35 15.35 16.42 17.57 17.57 18.45 2011 2012 2013 2014 2015 2016 2017 2018 2019 2020 2021 86 92 94 100 106 116 126 143 150 158 174 2011 2012 2013 2014 2015 2016 2017 2018 2019 2020 2021 Dividend per share (p) Book Value per share (p) 1. Includes discontinued operations, excludes mortality reserve releases 2. In addition to the above, 2020 EPS excludes Mature Savings gain on disposal 9% CAGR 11% CAGR 11% CAGR 7% CAGR ROE (%) 14.9 15.4 16.1 16.9 17.7 18.8 25.6 22.7 20.4 17.3 20.5 7
- 8. Structural and capital synergies result in ~20% ROE The highly synergistic nature of our business model continues to underpin our strong ROE Institutional Retirement (LGRI) Providing capital Retail (LGI and LGRR) Creating Alternative assets Capital Investment (LGC) Investment Management (LGIM) Co-investing Providing asset management services Creating Alternative assets Protection capital benefits Lifetime Mortgage origination Contributing DC and Annuity AUM Workplace client relationships Asset management services Contributing captive AUM Asset management services Annuity asset portfolio management 8
- 9. We are adding to those synergies by combining our Retail Retirement and Insurance businesses into a new Retail division Operating Profit (£m) 2020 2021 % LGRR 322 352 9 LGI 189 268 42 Retail 511 620 21 Accumulation Decumulation Workplace Private Pensions Individual Annuities Drawdown DC Savings Stocks & Share ISAs Home Equity Lifetime / RIO* Mortgages Guidance & Advice Group and Retail Protection (LGI) Protection Businesses within LGRR (Retirement Retail) Businesses within LGI (Insurance) • By bringing together our Retail Retirement and Insurance businesses we can better serve the Savings, Retirement and Protection needs of c12 million retail policyholders and workplace members • We start from a position of strength, with successful, established businesses in Workplace DC, Individual Annuities, Lifetime Mortgages, and Group and Retail Protection • We continue to invest in and scale up innovative fintech businesses in adjacent markets, e.g. Salary Finance (an employee benefits platform), Smartr365 (an end-to-end mortgage platform) The UK Retail Retirement & Protection Landscape Retail division: overview and rationale * Retirement Interest Only mortgages 9
- 10. What differentiates L&G from our global peers? 10 A unique ability to create and manage assets for clients, and which underpin our market leading retirement and protection solutions, delivering consistent and sustainable shareholder value Powerful asset origination and management capabilities, and leading retirement and protection solutions Only global provider of end to end de-risking solutions World class asset manager Established alternative asset origination capability Collaborative and entrepreneurial culture Customer-led approach Established and action-oriented commitment to ESG Market-leading FinTech LGRI, LGIM, LGC LGIM LGC All All LGRI, LGIM, LGC Retail
- 11. L&G provides powerful asset origination and management capabilities, and leading retirement and protection solutions Division Provision Description FY21 Operating Profit (£m) LGC Asset Origination An alternative asset origination platform, originating assets for L&G and for third parties, and generating attractive shareholder returns 461 LGIM Asset Management A global £1.4tn asset manager with deep expertise in DB and DC pensions 422 LGRI Retirement Solutions A leading multi-national manager of institutional Pension Risk Transfer business 1,154 Retail Retirement & Protection Solutions A leading provider of UK retail retirement solutions (LGRR) and of UK and US life insurance & income protection (LGI) 620 2,657 11
- 12. Our asset origination and asset management capabilities are an important source of competitive advantage Asset Management LGIM Asset Origination LGC L&G Retirement & Protection Solutions LGRI, Retail Third Party Investors Our asset origination and asset management capabilities are highly attractive to clients and also underpin our market leading retirement and protection solutions 12
- 13. LGC-originated assets are highly attractive to clients and provide a competitive advantage to our retirement businesses Housing SME Finance LGC Asset Origination Specialist Commercial Real Estate Clean Energy Benefits Profits within LGC + 50-200bps yield uplift in LGR + Fee generation on third party funds L&G Annuity Portfolio LGRI, LGRR Third Party Capital Sources of Patient Capital External Fund Investors Strategic Co-Investors 13
- 14. LGC is successfully growing its Alternative asset portfolio and profits. It had a very strong 2021 14 1.1 1.5 2.4 2.9 3.1 3.4 2016 2017 2018 2019 2020 2021 LGC Alternative AUM (£bn) 121 124 188 217 112 350 136 148 134 146 163 111 257 272 322 363 275 461 2016 2017 2018 2019 2020 2021 LGC Operating profit (£m) Alternative asset portfolio Traded & Treasury portfolio 40% of total LGC assets: £8.6bn 18% of total LGC assets: £6.2bn
- 15. 2014 2015 2016 2017 2018 2019 2020 2021 Alt. credit Pemberton Renewable infra Build to Rent Retirement villages Affordable Housing Data centres Suburban BTR Secure Income Fund Cala Homes Lifetime mortgages Modular Homes Energy demand mgmt Life Sciences Oxford Uni partnership Heat pumps Kensa ID Manchester Urban Regeneration Solar technology SalaryFinance Mortgages Smartr365 EV charging Film studios Healthcare Theidol.com (pre 2014) Venture Capital Smart Pension LGC has been the driver in developing the Group’s private markets capabilities in frontier sectors LGIM capability LGC capability Launch date of new private markets capabilities Retail capability We plan to increase our investment in Climate and SciTech 15
- 16. We are scaling up businesses of the future with a focus on Climate and SciTech 20% - 50% 3% - 20% 100% “START UPS” “SCALE UPS” “GROWN UPS” 100% 16 100% Generated £1.5bn of proceeds since 2015 for investment in higher growth and return business 1. Legal & General owns c98% of ADV 2. Following Pod Point’s successful IPO, our holding is now c14% down from c22% 3. We hold a 40% share in Smartr365 4. Onto and Tradeteq are investments via ADV and not directly held by Legal & General LGC LGIM Retail Kao Data Pod Point2 Pemberton SciTech BTR NTR Energy LGRI LGRA LGIMA ADV1 Cala Later Living Future Cities DC / Retail ETF LGIM Europe LGIM Asia Affordable homes Modular homes Suburban BTR Cambridge Innovation Capital Oxford PV Oxford Sciences Innovation Onto4 SalaryFinance Tradeteq4 Smartr3653
- 17. We have bold growth ambitions for LGC businesses 17 • Grown profits by 12x from £11m in 2013 to £132m in 2021 • 5 year ambition is to build 4,000 homes and to generate £1.7bn of revenue and £270m of operating profit per annum CALA • Started in 2019, now has 1,600 homes in operation. Has grown profits from £1m in 2019 to £26m in 2021 • 5 year ambition is to be building 3,000+ homes and to be generating £800m of revenue and £125m of profit per annum. Forecast asset creation of £1.7bn by 2025 Affordable Homes • 50/50 JV with PGGIM • 11,000+ homes either completed or in pipeline with a Gross Development Value (GDV) of £3.8bn • Generates value across the Group: LGIM asset management fees, LGC development profits and LGR asset creation Build to Rent • Since inception in 2016, committed AUM has grown by 10x from £1bn in 2016 to £11bn in 2021 • 5 year ambition is to grow committed AUM from £11bn to £27bn and EBITDA from £16m to c£100m Pemberton
- 18. LGC is demonstrating strong value creation 18 1. Based on sale price to Land Securities plus the £40m of net distributions received through our period of ownership 2. The IPO has raised c£120m of gross proceeds to support the ambitious growth plans of this innovative UK company 3. Return includes funds managed by L&G Return on initial investment 1.3x Inspired Villages Group • We announced a 15 year JV with Natwest Group Pension Fund (“NWPTL”) in Aug 21 • As part of JV, LGC sold a 50% stake in IVG’s first 11 sites to NWPTL based on an enterprise value of over £300m 3.8x2 Pod Point IPO • An electric vehicle (“EV”) charge point provider first backed by LGC in 2019, and in which EDF and LGC are currently the principal investors • Pod Point IPO’d in Nov 21. LGC now owns c14% (c22% previously) 5.3x3 Current Health • Current Health is a platform which supports healthcare organisations by providing a window into patient health at home and enabling them to manage all aspects of in-home care • Current Health was sold to Best Buy in Oct 21 1.6x1 MediaCity • Long-standing JV with Peel Land & Property Group, which has developed Europe’s leading creative, tech and digital hub • LGC sold its stake to Land Securities Group Plc in Nov 21
- 19. We achieved self-sustainability on the UK annuity portfolio (and for the Group as a whole) in both 2020 and 2021 • We expect to achieve self- sustainability again in 2022, driven by double digit growth in operational surplus generation to c£1.8bn • Our asset origination capability gives us optionality to put the higher yielding assets to new business (to benefit pricing/ margins) and/or to the back-book (improving the yield on the portfolio) £bn 2020 2021 UK annuity portfolio Total UK annuity portfolio Total UK PRT and Retail Annuity Volumes 8.5 7.2 Operational Surplus Generation 1.0 1.5 1.1 1.6 New Business Strain (0.3) (0.3) (0.3) (0.4) Net Surplus Generation 0.8 1.2 0.8 1.3 Dividend (0.7) (1.0) (0.7) (1.1) Net Surplus Generation – Dividend 0.1 0.1 0.1 0.2 UK annuity portfolio: self-sustainability Notes: The UK annuity portfolio OSG figures also include contributions from LGIM and LGC, reflecting the total Group value of writing UK PRT. Management actions also included Whilst we may choose not to prioritise self-sustainability in every discrete year, our ambition is for net surplus generation to exceed dividends for the Group over the period 2020-2024 Numbers in the table above do not sum due to rounding 19
- 20. • Asia Pacific (APAC) asset management market to grow to c$30trn by 20251. (LGIM APAC AUM $138bn) • Increasing wealth and pensions reform driving significant and growing demand for financial products We are expanding in Asia Pacific, where we have $138bn of AUM 20 Our strategic growth drivers are highly relevant Ageing Demographics Globalisation of asset markets Addressing Climate Change 1. Market size is based on most recent available data and L&G estimates 2. UNFPA 3. 30% of all wind turbines & solar panels and 45% of global electric vehicles are in China. By 2025 China’s battery facilities will be almost double the capacity of the rest of the world combined • By 2050, one in four people in APAC will be over 60 years old2 driving demand for greater pension provision, solutions for funding retirement, health and care • L&G Retail – strategic lifetime mortgages investment in Australia with further opportunities in technology-enabled retirement solutions being explored • Asia will play a critical role in the energy transition. China: the largest emitter and the largest clean energy market3 • Supporting investors in the transition with our ESG fund range and de-carbonisation strategies: first Net Zero APAC clients in 2021 5 12 15 77 100 138 2016 2017 2018 2019 2020 2021 LGIM Asia-Pacific AUM ($bn) 97% CAGR Strategic growth drivers
- 21. We have a clear purpose, and a long-term commitment to Inclusive Capitalism and ESHG, with a focus on execution 21 To improve the lives of our customers, build a better society for the long term and create value for our shareholders. We use our long-term assets in an economically effective and socially useful way to benefit everyone in society. Our purpose ESHG approach We think about the long-term ESHG impact of our businesses in terms of: • How we invest our £98bn of proprietary assets1 • How we influence as one of the world’s largest asset managers with £1.4tn AUM • How our businesses operate Environmental Social Governance • Decarbonising the assets on our balance sheet to align with the Paris objective • Committed to the Science Based Target Initiative • Investments in onshore and offshore wind, ground source heat pump technology and electric vehicles • Addressing the affordable housing shortage, e.g. building 3,000 affordable homes by 2023 • Housing for the homeless in partnership with Croydon council • Creating a stronger society, e.g. Advanced Care research investment at Edinburgh University • Engaging with investee companies, e.g. promoting Board diversity, director independence • Improving diversity and inclusion at L&G, e.g. addressing areas of under-representation • Maintaining focus on our supply chain, modern slavery, human rights and health & safety Health • Established a partnership with Sir Michael Marmot to address UK health inequality • Continuing to invest in pioneering health VC start-ups, e.g. CMR Surgical, Hinge Health • £5m gift to Newcastle City Council to pioneer new post-COVID approach to elderly care 1. As at 31st December 2021, excluding derivatives, cash & cash equivalents and loans; please see the appendix for further quantitative data on our ESHG progress and commitments Long-term, sustainable strategy delivering for our stakeholders
- 22. Financial highlights Positioned for growth Jeff Davies Chief Financial Officer
- 23. Strong financial performance, double-digit growth delivered Metric 2019 2020 2021 2019 % 2020 % Operating profit from continuing divisions (£m) 2,485 2,422 2,657 7 10 Discontinued operations (£m) 34 - Operating profit from divisions (£m) 2,496 2,456 2,657 6 8 Operating profit excluding mortality release (£m) 2,131 2,041 2,262 6 11 Mortality release (£m) 155 177 - Operating profit (£m) 2,286 2,218 2,262 2 Investment & other variances (£m) (430) 226 Of which: LGI (largely from the formulaic impact of UK and US rates) (459) 111 Profit before tax (£m) 2,112 1,788 2,488 18 39 Earnings per share1 (p) 28.66 19.84 34.19 19 72 Return on equity (%) 20.4 17.3 20.5 SII operational surplus generation from continuing operations (£bn) 1.4 1.5 1.6 17 12 SII coverage ratio (%) 179 175 187 23 1. EPS excludes 2019 / 2020 mortality releases and the Mature Savings gain on disposal in 2020
- 24. Financial Highlights 2020 2021 Operating profit (£m) 1,728 1,506 - Retirement Institutional (LGRI) 1,229 1,154 - Retirement Retail1 (LGRR) 322 352 - Mortality release 177 - Profit before tax1 (£m) 1,743 1,748 Total LGR new business (£m) 10,544 8,981 - Retirement Institutional (LGRI) 8,843 7,176 - Retirement Retail (LGRR) 1,701 1,805 - Workplace Savings net flows1 (£bn) 7.8 8.5 Total annuity AUM (£bn) 87.0 89.9 Of which: Direct investments 24.7 28.4 24 LGR: Consistently delivering strong profits 1. From 1 Jan 2021, the Workplace Savings administration business has transferred to LGRR. 2020 financials have been restated accordingly 2. Retirement Interest Only • Operating profit of £1,506m, reflecting: ‒ Release from operations up 8%, reflecting the scale of the business as prudential margins unwind from the growing back book ‒ £7.2bn of PRT new business written at good margins, due to price discipline and strong asset origination allocated to new business ‒ Individual annuity volumes of £957m, up 5%. Lifetime mortgage and RIO2 mortgage advances of £848m, up 7%, as retail markets continued to show recovery ‒ Positive variances driven by annual assumptions review and COVID-driven excess deaths
- 25. Total Sales (£m) 2019 2020 2021 UK PRT1 10,325 7,593 6,240 US PRT 893 1,250 789 Other International PRT 174 - 147 Total LGRI New Business 11,392 8,843 7,176 Solvency II New business value2 (£m) 890 901 635 Solvency II New business margin2 (%) 7.9 10.6 9.1 25 LGRI: Disciplined approach for value 1. Includes Assured Payment Policy 2. UK annuity business only • Robust 2021 volumes: £7.2bn of PRT across 57 transactions, written at a strong new business margin of 9% ‒ 69% of transactions were small scheme solutions. We leveraged technological innovation to drive efficiency ‒ We now have 11 umbrella agreements in place with different schemes to allow for efficient future execution ‒ 58% of UK transactions were with LGIM clients • UK annuities achieved a 9.1% Solvency II new business margin, delivering ahead of 2019 (7.9%). The 2020 margin largely benefitted from good credit sourcing in volatile markets and longer duration schemes. UK PRT capital strain was slightly lower than our 4.0% target • In 2022, we have already won or are exclusive on c£1bn. We have a pipeline of c£20bn • $1.1bn of US PRT written in 2021, including our 2nd biggest transaction at $293m. Additionally, we wrote our second Canadian PRT transaction • Five year ambition of £40-50bn UK PRT and $10bn of International PRT
- 26. Bond - Government Bond - Economic Infrastructure (incl. renewables) Bond - Social Infrastructure Bond - Utilities Bond - Private Corporate Debt (other) Bond - Real Estate (debt) Bond - Lifetime Mortgage Property - Residual Value Property - Fixed Coupon BBB, 33% (£26.9bn) A, 35% (£28.3bn) AA, 22% (£17.8bn) AAA, 9% (£7.6bn) • Defensively positioned, high quality portfolio. £3.4bn IFRS credit default reserve remains unutilised • Approximately two-thirds A-rated or better. Only 13% of BBB are BBB- • 16% of bonds in Sovereign-like assets • Lower-rated, cyclical exposures kept to a minimum: <1% airlines, hotels, leisure and traditional retail combined • Geographically diversified portfolio LGR Bond Portfolio: £81.8bn (out of £89.9bn) YE 2021 £81.8bn Other, 7% Sovereigns, Supras and Sub-Sovereigns, <1% Utilities, Commodities, Energy, 9% Non-cyclical consumer goods and services, 6% Infrastructure, 6% Technology, Telecoms and Industrials, 4% BB or below, 1% (£1.2bn) 26 LGR assets: Diversified bond portfolio complemented by high quality direct investments LGR DI portfolio: £28.4bn, 32% of total LGR assets Direct investments by type High quality Lifetime Mortgage book: average customer age 74; weighted average loan-to-value of 29.3% Across these asset classes, the primary exposure is to high quality counterparties, not to property valuations: c.69% of DI portfolio • No defaults and 99.8% of scheduled cash-flows paid. Primary exposure is to the underlying high quality tenant on rental income, e.g. Amazon, not to property risk • Originated £4.6bn of new, high quality direct investments during 2021. Around 60% of portfolio rated ‘A’ or above • Continue to benefit from LGC ESG-focused asset creation via affordable homes and Build-to-Rent
- 27. Financial Highlights 2020 2021 Operating profit (£m) 275 461 - Alternative asset portfolio 112 350 - Traded portfolio and Treasury 163 111 Investment and other variances (£m) (299) 19 Profit before tax (£m) (24) 480 Assets (£m) 9,047 8,615 - Alternative asset portfolio 3,139 3,439 - Traded portfolio and Treasury 5,908 5,176 of which: Cash and Treasury assets 3,791 3,048 27 LGC: Strong alternative asset performance • Strong commitment to ESG-aligned investing, with proven asset expertise in clean energy, housing, digital infrastructure and SME finance • Unique and growing asset origination capabilities to support the levelling up agenda, climate change and housing shortages • Operating profit of £461m, up 68%, principally reflecting increased profits from our alternative asset portfolio – Alternative asset profits of £350m were driven by a bounce-back in the housebuilding market and the continued maturing of our earlier stage businesses (e.g. Pod Point and our VC platforms) – The alternative asset portfolio is up 10% to £3,439m (2020: £3,139m) – Net portfolio return of 8.5% (2020: (4.0)%) • Profit before tax £480m, resulting from strong alternative asset portfolio profits and equity market performance over the year, partially offset by early-stage investment costs • Over the next four years the ambition is to build our diversified alternative AUM to c.£5bn with a target blended portfolio return of 10-12% and to increase third party capital to over £25bn. We therefore expect to manage over £30bn of alternative AUM by 2025 and deliver £600-700m of operating profit
- 28. 28 LGC’s Alternatives business is generating attractive shareholder returns and creating valuable assets for us and for our clients 1 Capital deployment • c£450m of investment in asset creation opportunities including: ‒ a regeneration project in Sheffield ‒ the first acquisition by Suburban BTR ‒ initiation of the Oxford Life and Mind Building 2 Value generation • Strong valuation upsides recognised in Venture Capital from successful exits from portfolio companies • Strong trading returns from our wholly owned subsidiaries (e.g. CALA, Affordable Homes) • Multiple value creation proof points: MediaCity, Pod Point, Later Living and Current Health 3 Asset creation • Initial Affordable homes investment of £270m by LGRI to back annuity liabilities • Strong pipeline development not yet recognised in valuation (e.g. ID Manchester, Oxford JV) • Positive societal impact delivered across the portfolio (e.g. Build to Rent, Affordable, KAO, Pod Point)
- 29. • Operating profit up 4% to £422m, reflecting increased revenues from flows and robust cost management • AUM up 11% to £1.4tn ‒ International AUM of £479bn, 34% of total AUM ‒ A market leader in UK DC with £138bn of AUM, and 4.4m Workplace members ‒ Retail AUM at £49bn with gross inflows of £15bn. 2nd in gross UK retail sales² in 2021 • Continuing to make progress across our three strategic pillars: – Modernise: Further investment in our data and operating platform to deliver enhanced scalability – Diversify: Expanded our thematic ETF range, launched an ESG Paris aligned equity index fund for institutional investors in the UK and Europe, and a sustainable property fund for DC investors – Internationalise: Achieved €100bn AUM milestone in mainland Europe, further net flows in Japan and launch of our new US DC Retirement Income Strategy • Cost:income ratio of 58% reflects our careful cost control as we continue to invest in the business • LGIM continues to be a strong enabler and beneficiary of LGR growth, with internal revenue of £163m (2020: £148m) Financial Highlights 2020 2021 Asset management revenue1 (£m) 956 1,012 Asset management expenses1 (£m) (549) (590) Total LGIM operating profit (£m) 407 422 Closing AUM (£bn) 1,279 1,421 International AUM (£bn) 388 479 UK DC AUM (£bn) 113 138 Retail AUM (£bn) 42 49 Asset management cost:income ratio (%) 57 58 1. Revenue and expenses exclude income and costs of £32m in relation to the provision of 3rd party market data (2020: £27m) 2. Pridham Report Q4 2021 3. AUM in responsible investment strategies represents only the AUM from funds or client mandates that feature a deliberate and positive expression of ESG criteria, in the fund documentation for pooled fund structures or in a client’s Investment Management Agreement. Note: From 1 Jan 2021, the Workplace Savings administration business has transferred to LGRR. 2020 financials have been restated accordingly LGIM: Profit growth from continued International expansion 29 • Continue to build on credentials as a responsible investor and remain committed to addressing environmental and social challenges ‒ As at FY 2021, £290bn managed in responsible investment strategies explicitly linked to ESG criteria3 • Ambition is to grow cumulative profits in the range of 3% to 6% per annum, absent market shocks
- 30. 1,278.9 1,311.5 1,421.5 34.6 (2.1) 110.1 LGIM: Resilient AUM and positive flows underpinned by diverse asset exposure AUM progression from FY20 to FY21 (£bn) • Positive external net flows of £34.6bn driven by: – International flows of £29.5bn, representing 85% of the total, with broad-based contributions from the US, Europe, Asia and Japan – UK DC external net flows of £9.4bn with 87 scheme wins in 2021. The default strategy for the majority of schemes is multi-asset or target date funds – ETF net flows of £2.5bn, reflecting focus on thematic investing, including the launch of a new range of ESG- aligned ETFs – Strong UK DB flows into LDI/Active Fixed Income of £8.4bn, offset by outflows from Index as clients de- risked out of Index in favourable equity markets. Also includes clients moving to PRT with LGRI (58% of LGRI PRT wins in 2021 were from LGIM clients) FY 2021 FY 2020 Markets & Other Movements External Flows (9.3) 9.4 2.5 29.5 2.5 UK DB UK DC UK Retail International ETF 30 Internal Flows
- 31. • Rebound of ANNR in 2021, reflecting the focus on higher margin areas ahead of the quantum of flows, for example: ‒ £14m in multi-asset strategies through success in UK DC and positive contribution from Retail ‒ £8m from expanded ETFs range combined with increasing our European distribution footprint ‒ £5m from real assets reflecting launch of Secure Income Assets Fund (SIAF) and origination of assets for LGR portfolio • In addition, higher transaction fees in 2021, reflecting performance fees in Index and real assets, and execution fees on hedging activity • Diverse geographic spread of ANNR demonstrates growing international presence, one of our strategic pillars LGIM: Our focus on value over volume is starting to deliver results 6 13 2 2 5 UK Europe US Asia & Gulf Internal 1. ANNR represents Annualised Net New Revenue from Net Flows in the period 2020 2021 External and Internal net flows (£bn) 22.5 32.5 Annualised net new revenue (ANNR)1 (£m) 2 28 2021 ANNR breakdown by region (£28m) 31
- 32. Financial Highlights 2020 2021 Operating profit (£m) 189 268 - UK 205 320 - US (16) (52) Investment and other variances (£m) (459) 111 Profit before tax (£m) (270) 379 Annual premium (£m) 372 379 Gross written premium (£m) 2,849 2,902 - UK 1,756 1,849 - US 1,093 1,053 Solvency II New business value (£m) 254 262 - UK 160 149 - US 94 113 32 LGI: Continuing to support customers through difficult times • Operating Profit of £268m, up 42%, with 2020 and 2021 impacted by adverse mortality experience arising as a result of COVID-19 ‒ 2021 has seen strong new business surplus in UK Retail Protection in addition to a benefit from modelling refinements in the UK, partially offset by continuing adverse mortality in the US (in line with US peers) ‒ Total COVID-19 mortality claims of £185m, exceeding the £110m provision set-up at FY 20. In addition, a £57m provision is included to cover potential COVID claims in 2022 • Profit before tax up to £379m, with investment variance driven by the formulaic impact on reserves of rising government yields in both the UK and US • Annual premium up 2% to £379m. Gross written premium up 2% to £2.9bn (up 5% on a constant currency basis) • Solvency II NBV up 3% to £262m (up 6% on a constant currency basis), supported by strong sales in UK and US Retail Protection • $114m dividend paid by LGIA on 3rd March 2022 (2021: $111m)
- 33. 17.3 17.6 9.9 9.4 7.4 8.2 YE 2020 YE 2021 Own Funds Capital Requirement Surplus • Coverage ratio of 187% • Solvency II surplus of £8.2bn • Tier 1 Own funds of £13.7bn (78%) • Coverage ratio as at 7th March 2022 of 198% 33 Operating variances include the mortality release, impact of experience variances, changes to model calibrations, and management actions 187% Robust Solvency II Balance sheet Solvency II Balance Sheet (£bn) 175% Key Sensitivities (%) YE 2021 SII ratio 187% Rates +100bps Credit spread +100bps Risk Margin reduces 2/3rds Equities (25)% 206% (+19%) 200% (+13%) 194% (+7%) 184% (-3%)
- 34. 7,436 1,636 (1,063) 727 103 (354) (300) 8,185 Surplus YE 2020 Operational surplus generation External dividends (2020 Final + 2021 Interim) Market movements Operating variances & M&A New business Debt redemption Surplus YE 2021 175% 187% Solvency II surplus analysis of change 34
- 35. We continue to show strong year on year growth in cash and capital, making good progress against our ambitions Cumulative (£bn) 2020-2024 To Date Cash generation1 8.0-9.0 3.2 Capital generation2 8.0-9.0 3.1 Dividends3 5.6-5.9 2.1 • Over the period 2020-20244 our ambition is for: ‒ Cash & capital generation significantly to exceed dividends ‒ EPS to grow faster than dividends ‒ Net surplus generation (i.e. including new business strain) to exceed dividends • The 2021 full year dividend is 18.45p, up 5%. Our ambition is to achieve 3-6% annual growth in dividends declared to 2024, absent market shocks 1. Cash generation is Net release from continuing operations 2. Capital generation is Solvency II operational surplus generation from continuing operations 3. Dividends declared. The target range is based on a flat final 2020 dividend, and 3-6% annual growth thereafter 4. The ambition is based on the aggregate performance over a five-year period. Performance may vary from year to year and individual statements may not be met in each year on a standalone basis 35 Double-digit growth in 2021 cash and capital generation: • Cash generation1 up 12% year on year • Capital generation2 up 12% year on year Our Financial Ambitions & Progress to Date
- 36. In summary £2,262m Operating profit1 2020: £2,041m, +11% 2019: £2,131m, +6% £1.6bn SII operational surplus generation2 2020: £1.5bn, +12% 2019: £1.4bn, +17% 20.5% Return on equity 2020: 17.3% 2019: 20.4% 36 • We have delivered double- digit operating profit growth, and are confident in achieving our five year ambitions • Our balance sheet remains robust, with SII coverage at 187% at FY21 (and 198% as at 7th March). No defaults within our credit portfolio • We are well positioned to deliver further profitable growth. 2022 has started well, with good levels of new business and asset creation 187% Solvency II coverage ratio 2020: 175% 2019: 179% 1. Excludes mortality releases 2. Excludes discontinued operations
- 37. Sustainable, ambitious, inclusive Sir Nigel Wilson Chief Executive Officer
- 38. A compelling investment case 38 An established track record of consistent and profitable growth: between 2011-2021 we delivered 11% CAGR in EPS, 11% CAGR in DPS and 7% CAGR in Book Value per Share A highly synergistic, diversified and growth-oriented business model, driving c20% ROE, and strongly aligned to six long-term, macro growth drivers. Delivering domestic and international growth Long-term and predictable value creation: very long duration business (30-40 years), with earnings driven by a growing stock of accumulated assets A proven robust and resilient balance sheet: Solvency II coverage ratio of 198% as at 7th March. No defaults in 2021, with 99.8% of scheduled cash flows received from Direct Investments A clear purpose, a longstanding commitment to Inclusive Capitalism and a leader in ESHG, with a focus on execution and delivery Delivering on a clear set of growth ambitions with attractive annual growth in the dividend and ongoing investment in high quality new business. Significant associated valuation upside 1 2 3 4 5 6
- 39. Delivering profitable, sustainable and inclusive growth 2021 Full year results £2,657m Operating profit from divisions 2020: £2,422m, +10% 2019: £2,485m, +7% 34.19p Earnings per share 2020: 19.84p, +72% 2019: 28.66p, +19% 18.45p Full year dividend 2020: 17.57p, +5% 2019: 17.57p, +5% 20.5% Return on equity 2020: 17.3% 2019: 20.4%
- 40. CALA Homes: We have grown profits by 12x since 2013… CALA Homes has grown significantly since L&G’s first investment in March 2013 FY13 2021 850 2,904 Homes* Revenue £240m £11m Operating Profit £1.2bn £132m c.4,000 £1.7bn £270m 5-year Ambition 40 Proven track record of growth • CALA has grown from a medium sized housebuilder to 10th largest in the UK by revenue • Year on year profit improvement (FY13-19) driving core LGC performance • Strong rebound in 2021 following challenging trading conditions under Covid-19 Key differentiating factors • Experienced and capable management team • Strong landbank – 22,000 plots + 11,000 strategic plots • Excellent product and service to our customers with industry leading satisfaction scores Further supporting our 5-year ambition • Focus on scale, with the opportunity to increase growth from existing regional businesses • Profit increase driven by increased revenue and operating margin improvements (targeting a 16%+ operating margin and 20%+ ROCE) 2022 Ambition c.3,000 £1.3bn £170m * Per annum
- 41. Affordable Homes: Ambitious growth plans to be a £125m profit business by 2026 2019 2021 117 997 Homes Completed* Revenue £10m £1m Operating Profit £201m £26m 3,000+ £800m £125m 5-year Ambition 41 Proven track record of growth • From a standing start, Affordable homes now has over 1,600 homes in operation • Continuing to grow operating profit, delivering £26m in 2021, up from £1m in 2019 Key differentiating factors • Experienced and capable management team • Supported by 14 external housing management partners • In 2021, finalised a deal with LGR to support new PRT business, with further offtakes in the pipeline. Forecast asset creation of £1.7bn by 2025 Further supporting our 5-year ambition • Pipeline of c.7,000 homes across the country • LGAH is now a Homes England backed Strategic Partner, with £125m of funding approved by Government to support 2,100 homes. 2022 Ambition 1,500 £350m £45m * Per annum
- 42. Build to Rent: We are developing over 11,000 homes with a Gross Development Value close to £4bn In 2021 L&G: • Was the largest investor into UK BTR with c£700m committed (Source: CBRE) • Secured more lettings than any other BTR landlord with 1,985 households moving in (Source: Estates Gazette) • Now has over 3,000 residents • Started construction on 2,928 new BTR homes * Expected valuation post development for assets under construction 42 Urban BTR Status Homes GDV* (£m) Completed 2,732 937 Contracted / Under offer 2,909 1,222 Pipeline 3,367 1,016 Total Urban 9,008 3,175 Suburban BTR Division Homes GDV* (£m) Contracted / Under offer 351 118 Pipeline 1,995 488 Total Suburban 2,346 606 Total BTR Homes GDV* (£m) Total BTR 11,354 3,781
- 43. Pemberton continues successfully to raise funds and scale Committed AUM Proven track record of growth • Increased number of LPs from 11 in 2015 to 147 in 2021 • Developed core competencies to establish four strategies Key differentiating factors • Size and depth of our investment team • Local origination strategy • Institutional-backed platform • Dual-Track credit process • Credit rating system Further supporting our 2026 ambition • Launching Inventory Finance • Expansion into adjacent asset classes • International expansion into US and Asia Revenue EBITDA 43 Note: Pemberton MI, December 2021. Based on Euro to Sterling exchange rate of (0.84) as at 31 December 2021. This includes LP investments from LGC and other L&G entities. 2016 2021 £1.1bn £11.3bn £9.5m £5.9m £62m £16m £27bn £198m £100m 5-year Ambition 2022 Ambition £19bn £88m £26m
- 44. Salary Finance: 10x Revenue growth over the past 3 years Future growth underpinned by expansion in US and continued UK success Proven track record of growth • #19 in Deloitte’s UK Tech Fast 50 with 4 consecutive years of near 100% revenue growth • Clients include 20% of FTSE 100 • UK core business2 first profitable month in 2021 Key differentiating factors • Multiproduct and global: 5 live products in UK and 3 in US • Fantastic consumer endorsement: ~100% client retention rate, 80.5 client NPS, 4.7 out of 5 stars on Trustpilot • Integration capability with payroll providers Further supporting our 2026 ambition • UK core business2 profitable in 2022 • 4 new channel partnerships in the US • With F2F sales returning, SF expects to reach over 1m US employees by end of 2023 1. Gross revenue includes revenue generated in the group’s JV with Virgin Money 2. Core business, excludes investment spend 3. 48% undiluted, c41% diluted Employees Covered Loan Book Size 2018 0.7m £35m £3m 2021 4.1m £252m £30m Gross Revenue1 5-year Ambition 7.5m+ £1bn+ £130m+ 44
- 45. Whilst we have performed well relative to Blackrock (a respected competitor) our performance has not been reflected in valuation 12.42p 34.36p $12.56 $38.76 0 50 100 150 200 250 300 350 2011 2012 2013 2014 2015 2016 2017 2018 2019 2020 2021E EPS1 L&G (11% CAGR) Blackrock (12% CAGR) 45 86p £1.80 $181 $245 0 50 100 150 200 250 2011 2012 2013 2014 2015 2016 2017 2018 2019 2020 2021E BVPS1 L&G (8% CAGR) Blackrock (3% CAGR) 6.4p 18.40p $5.50 $16.52 0 50 100 150 200 250 300 350 2011 2012 2013 2014 2015 2016 2017 2018 2019 2020 2021E DPS1 L&G (11% CAGR) Blackrock (12% CAGR) 14.9% 20.6% 9.1% 16.7% 0.0 5.0 10.0 15.0 20.0 25.0 30.0 2011 2012 2013 2014 2015 2016 2017 2018 2019 2020 2021E RoE L&G Blackrock 8.3x 8.7x 15.3x 19.0x 6.0 10.0 14.0 18.0 22.0 2011 2012 2013 2014 2015 2016 2017 2018 2019 2020 2021E P/E L&G Blackrock 1.2x 1.6x 1.0x 3.1x 0.8 1.4 2.0 2.6 3.2 2011 2012 2013 2014 2015 2016 2017 2018 2019 2020 2021E P/B L&G Blackrock 1. Represents normalised growth for comparison purposes. Note: 2021E Bloomberg consensus figures as at 23.02.22. L&G 2021E EPS represents internally collated view of external market consensus Impact of Solvency II & Brexit Despite growing earnings and dividends at a similar rate of growth to Blackrock, coupled with faster growth in book value and a higher ROE, this has not been reflected in our valuation multiples…
- 46. L&G has comparable financial characteristics to Blackstone, but trades on a fraction of its valuation multiples 15.20p 34.36p $2.00 $8.14 0 100 200 300 400 500 2013 2014 2015 2016 2017 2018 2019 2020 2021e EPS1 L&G (11% CAGR) Blackstone (19% CAGR) 94p £1.80 $5.56 $7.85 0 50 100 150 200 250 2013 2014 2015 2016 2017 2018 2019 2020 2021e BVPS1 L&G (8% CAGR) Blackstone (4% CAGR) 9.30p 18.40p $1.34 $4.06 0 50 100 150 200 250 300 350 2013 2014 2015 2016 2017 2018 2019 2020 2021e DPS1 L&G (9% CAGR) Blackstone (15% CAGR) 16.1% 20.6% 19.9% 72.8% 0.0 20.0 40.0 60.0 80.0 2013 2014 2015 2016 2017 2018 2019 2020 2021e RoE L&G Blackstone 14.7x 8.7x 12.4x 25.5x 7.0 12.0 17.0 22.0 27.0 32.0 37.0 42.0 2013 2014 2015 2016 2017 2018 2019 2020 2021e P/E L&G Blackstone 2.3x 1.6x 5.7x 15.5x 1.0 6.0 11.0 16.0 21.0 2013 2014 2015 2016 2017 2018 2019 2020 2021e P/B L&G Blackstone 46 1. Represents normalised growth for comparison purposes. Note: 2021E Bloomberg consensus figures as at 23.02.22. L&G 2021E EPS represents internally collated view of external market consensus Impact of Solvency II & Brexit Despite growing earnings, book value and dividends, whilst delivering a 20%+ RoE, we are still trading at lower multiples than we did in 2013…
- 47. L&G has comparable characteristics to Brookfield, but trades on lower valuation multiples 12.42p 34.36p $1.30 $2.48 -50 0 50 100 150 200 250 300 2011 2012 2013 2014 2015 2016 2017 2018 2019 2020 2021E EPS1 L&G (11% CAGR) Brookfield (6% CAGR) 47 86p £1.80 $12 $26.91 0 50 100 150 200 250 2011 2012 2013 2014 2015 2016 2017 2018 2019 2020 2021E BVPS1 L&G (8% CAGR) Brookfield (8% CAGR) 6.4p 18.40p $0.20 $0.56 0 50 100 150 200 250 300 350 2011 2012 2013 2014 2015 2016 2017 2018 2019 2020 2021E DPS1 L&G (11% CAGR) Brookfield (9% CAGR) 14.9% 20.6% 12.5% 10.3% -5.0 0.0 5.0 10.0 15.0 20.0 25.0 30.0 2011 2012 2013 2014 2015 2016 2017 2018 2019 2020 2021E RoE L&G Brookfield 8.3x 8.7x 9.5x 22.2x 5.0 15.0 25.0 35.0 45.0 55.0 65.0 75.0 2011 2012 2013 2014 2015 2016 2017 2018 2019 2020 2021E P/E L&G Brookfield 1.2x 1.6x 1.0x 2.0x 0.8 1.4 2.0 2.6 3.2 2011 2012 2013 2014 2015 2016 2017 2018 2019 2020 2021E P/B L&G Brookfield 1. Represents normalised growth for comparison purposes. Note: 2021E Bloomberg consensus figures as at 23.02.22. L&G 2021E EPS represents internally collated view of external market consensus Impact of Solvency II & Brexit Despite growing book value at a similar rate of growth to Brookfield, coupled with faster growth in earnings and dividends and a higher ROE, this has not been reflected in our valuation multiples…
- 48. ESG at L&G: Ratings and collaborations 48 ESG ratings Year ended 31 December 2019 2020 2021 Sustainalytics1 17.5 (Low Risk) 16.0 (Low Risk) 16.5 (Low Risk) CDP B A- B DJSI / RobecoSAM 32nd percentile 74th percentile 79th percentile MSCI2 AA AA AAA Bloomberg Gender Equality Score 79% 79% 79% FTSE4Good 78th percentile 89th percentile 91st percentile Third party collaborations • Aldersgate Group • ClimateAction 100+ (LGIM) • Get Nature Positive • Glasgow Financial Alliance for Net Zero • UN Global Compact • UN Net Zero Asset Managers Initiative (LGIM) • UN Net-Zero Asset Owner Alliance • UN Principles for Responsible Investment • Race to Zero • Science-based targets initiative (SBTi) 1. Sustainalytics risk rating from 0 (negligible risk) to >40 (severe risk) 2. The use by Legal & General of any MSCI ESG Research LLGC or its affiliates (“MSCI”) data, and the use of MSCI logos, trademarks, service marks or index names herein, do not constitute a sponsorship, endorsement, recommendation, or promotion of Legal & General by MSCI. MSCI services and data are the property of MSCI or its information providers and are provided ‘as-is’ and without warranty. MSCI names and logos are trademarks or service marks of MSCI. Disclosure frameworks • Task Force on Climate-related Financial Disclosures (TCFD) • Global Reporting Initiative (GRI) • Sustainability Accounting Standards Board (SASB) The following slides provide a data-driven overview of environment, social and governance (ESG) activity at L&G. We demonstrate achievements to date, key metrics and some of our future commitments but these slides do not cover all ESG activity. Please refer to the Group’s Climate Report (published later in March) and Sustainability Report (published in May) for further details.
- 49. ESG at L&G: Journey to net zero 49 Environmental metrics Year ended 31 December 2019 2020 2021 Scope 1 and Scope 2 emissions (tCO2e)5 38,942 31,640 30,706 Balance sheet investments (tCO2e/£m)6 120 89 74 Business travel (tCO2e) 7,223 3,045 2,070 1. See Climate Report and Sustainability Report for full list of achievements to date and commitments in detail. 2. From a 2019 baseline. 3. This was driven in part by COVID-19 and market volatility impacts. In particular, the impact of COVID-19 on 2020 emissions is seen in the 2021 numbers due to the carbon data lag. We may see a partial reversal in future years. 4. LETI 2030 target: <300kgCO2/m2 Upfront carbon A1-5, excl sequestration. RIBA 2030 target: <625kgCO2/m2 Embodied carbon A1-5, B1-5, C1-4, incl sequestration. 5. Calculated using The Greenhouse Gas Protocol Corporate Accounting and Reporting Standard. Emission Factors are from the UK Government Emissions Conversion Factors for Greenhouse Gas Company reporting (BEIS 2020). 6. 2019 calculated using Enterprise Value (EV); 2020 and 2021 calculating using Enterprise Value including Cash (EVIC) on updated methodology and emissions dataset. Commitments1 Date Achievements to date Invest By the start of 2025, we will reduce portfolio greenhouse gas emission intensity by 18.5%2 and increase financing of low carbon technology and infrastructure. 2025 We reduced the greenhouse gas emission intensity of our proprietary assets by 17.0%3 compared to last year. We are targeting a net zero carbon footprint asset portfolio by 2050 and continue to evolve our interim targets against this objective. 2050 Coal exclusions extended, including avoiding investment in new coal mining, plant or business operations. Influence LGIM are committed to working in partnership with our clients to reach net zero greenhouse gas emissions by 2050 or sooner across all assets under management. 2050 We continue to develop investment solutions which support the low-carbon transition and a number of funds have set accelerated net zero targets. We continue to use our Climate Impact Pledge to drive change through engagement. Operate All homes delivered by CALA will be designed to meet the LETI and RIBA 2030 target for embodied carbon standards from 20254. 2025 CALA are already delivering new homes in Scotland which meet LETI and RIBA 2030 targets for embodied carbon4. We will set science-based targets in accordance with the Science Based Target initiative (SBTi) by the end of 2022 and publish them in 2023 (once SBTi verification has been achieved). 2022 We are building out our target metric suite, covering both our core operational and our proprietary investment-financed emissions.
- 50. ESG at L&G: Building a better society 50 Year ended 31 December Products 2019 2020 2021 Number of pension customers (‘000) 758 765 764 Life insurance payments (£m) 392 460 479 Percentage of life insurance claims paid (%) 97 97 98 Critical illness payments (£m) 224 203 209 Percentage of critical illness claims paid (%) 92 92 93 Number of employees of businesses whose lives we insure (m) 2.0 2.1 1.8 Amount paid to group protection customers who have died (£m) 232 243 252 Commitments1 Date We will measure social value across 20% of our property assets by value 2023 We will deliver 3,000 new affordable homes each year 2023 LGIM will engage with investee companies on themes that create more resilient societies, including diversity, income inequality and financial inclusion Ongoing What have we achieved so far Our affordable homes business now has a pipeline of 5,500 homes across the UK We established a multi-million pound charitable fund with the University College of London (UCL) to address UK health inequalities We support community causes, including educational programmes and charity partnerships, and continued to match employee charity funding 1. See Sustainability Report for full list of commitments.
- 51. ESG at L&G: Growing our business responsibly 51 Year ended 31 December Our people 2019 2020 2021 Number of employees 8,5071 10,099 10,743 UK employees on permanent contracts (%) 87.4 95.3 95.3 Female Board directors (%) 36 30 30 Female middle/senior management (%) 38 352 36 Difference in median hourly rate of pay between male and female employees (%) 28.5 26.6 24.1 Investment in UK employee learning and development (£m) 4.5 5.3 4.4 Employee satisfaction index (%) 72 77 76 Number of RIDDOR accidents 171 27 25 Commitments3 Date Continue to report progress on narrowing our gender pay gap Ongoing Continue to improve the data we hold on our people, including on ethnicity and other protected characteristics Ongoing As a signatory of the Women in Finance Charter, we have committed to achieving overall workforce gender balance by 2025; 40% female representation among managers and senior managers; and 33% female representation on our Board. 2025 1. Excludes employees of smaller LGC businesses. 2. 2020 impacted by the sale of our Mature Savings and General Insurance businesses, which had a more equal gender balance. 3. See Sustainability Report for full list of commitments. What have we achieved so far Our employee satisfaction score is 76, remaining above pre-pandemic levels We improved ethnic minority representation on our Board in response to the Parker Review We continue to make progress in narrowing the Gender Pay Gap to 24.1% (2020: 26.6%) We have improved the D&I data we hold on our employees, increasing the number of employees for whom we hold ethnicity data to 67.9% (2020: 52.6%)
- 52. ESG at L&G: Growing our business responsibly 52 Year ended 31 December 2019 2020 2021 Number of companies covered by our Climate Impact Pledge c.80 c.1,000 c.1,000 Number of company engagements from our Investment Stewardship team 739 891 773 Number of worldwide resolutions on which we voted1 50,900 66,037 67,551 Number of directors whose election we opposed due to governance concerns 4,055 4,700 5,379 Number of new responsible investment strategies launched 14 20 37 AUM in responsible investment strategies (£bn) 150 207 290 Exclusions • Coal and oil sands2 • Controversial weapons • UN Global Compact violation (LGIM) 1. Voting instructions for main FTSE pooled funds. 2. See our Climate Report for our coal and oil sands policy. LGIM Active Ownership Additional resources We release further details on ESG at L&G in our annual reporting, including our Climate Report (prepared in line with TCFD recommendations) and Gender Pay Gap Report (published later in March) and Sustainability Report (published later in the year). These can be found using the below links: • Results, reports and presentations • Sustainability reporting centre