SlideShare una empresa de Scribd logo
1 de 8
Lorem Ipsum Dolor Issue #, Date
Nordstrom,Inc.(JWN)
Business Description
June 8, 2015
In 1899, just two years after John W. Nordstrom had saved $13,000 from the Klondike in Alaska, he moved to Washington State. Soon after,
John decided to invest the savings with his good friend Carl Wallin, who owned a shoe-repair shop in Seattle. In 1901, they opened a small shoe store in
Seattle called Wallin & Nordstrom. John W. Nordstrom ran his shoe business based upon four core values; quality, selection, exceptional service and
value. As customers grew fond of Nordstrom’s values, Wallin & Nordstrom soon established a large loyal customer base. A second store was added in
1923, which was soon followed by John’s retirement. Sons of John W. Nordstrom, Everett and Elmer, had received their father’s share in the company.
Their other brother, Lloyd, had also joined the company shortly after when he acquired Carl Wallin’s share of the company in 1933. In 1960, Wallin &
Nordstrom was heralded as the largest shoe store in the country along with the largest independent shoe chain in America with its eight locations from
Washington to Oregon. In 1963 to 1966 women, men and children’s wear was added to the stores, preceding the transfer of Nordstrom to the third
generation in the family. Wallin & Nordstrom had been formally renamed to Nordstrom, Inc. after the company went public in 1971.
Nordstrom, Inc.’s values today are still based upon John Nordstrom’s original values of exceptional service, quality, value and selection.
Nordstrom, Inc. continues to be passed down in the Nordstrom family from one generation to another, and is currently overlooked by the fourth
generation. Nordstrom, Inc. is a leading competitor in the fashion retail industry. Nordstrom sells clothing, shoes, and accessories for children, men, and
woman, along with cosmetics. A majority of the products at Nordstrom are considered to be higher-end and consist of mostly brand names. There are
currently 292 stores located throughout 38 states in the U.S., 114 among which are “Nordstrom” full-branded stores and 178 that are discounted
merchandise stores called “Nordstrom Rack.” There are also Nordstrom two full-line stores in Canada. Nordstrom, Inc. has recently acquired a few
companies in the last four years. Nordstrom has purchased two luxurious Jeffrey boutiques along with Hautelook, which is an online website that holds
private sales. In 2014, Nordstrom also purchased Trunk Club, a personalized clothing service for men. Nordstrom, Inc currently ships to 96 different
countries via their online website, Nordstrom.com.
Highlights
• Projected $4.3 billion in capital expenditures over the next five years due to expansionary plans of 300 U.S. Nordstrom Rack stores by 2020,
three more Nordstrom-full line stores in Canada by 2017, and four more Nordstrom-full line U.S. stores by 2017
• Outperforms higher-end fashion retail competitors in inventory turnover, EBT % of sales, sales per square foot
• Risks include expanding into Canada, median age dropping to 38 to 40 years old, customers shifting shopping preferences online, and pressure
to remain innovative with technology
Alaina Goodey
Lorem Ipsum Dolor Issue #, Date
2
Nordstrom, Inc. was also a member of the credit card industry up until recently, when it decided to see its credit portfolio to TD Bank Group.
TD Bank Group is now the distributer of private label credit cards and Visa credit cards for Nordstrom’s stores in the U.S. Nordstrom is no longer
financing customers’ purchases, but still controls the issuing of Nordstrom debit cards and their reward program. A large portion of credit card profits
will continue go to Nordstrom, Inc., however a chunk of profits will go to TD Bank Group as well.
Nordstrom, Inc. implements an inverted pyramid structure in its management practices, which differentiates Nordstrom, Inc. from its
competitors. Starting from the top of the pyramid are the customers, followed by sales and support people, then department managers, then store
managers, buyers, regional managers, and general managers, and finally, the board of directors. All members of Nordstrom work to support each other
in order to work diligently as a team. Sales people are granted trust and empowerment when faced with a difficult situation with customers, in the sense
that they do what is best for the customer. Nordstrom offers healthy competition between employees by rewarding them with bonuses and commission,
and even public recognition for outstanding behavior. Nordstrom provides coaching and workshops for all employees to improve their interactions with
customers. Nordstrom’s executives and board of directors acknowledge that sales people have the most direct contact with customers, and therefore aim
to improve the behavior of salespeople in order to improve customers’ experience when shopping at Nordstrom stores.
Demographics
The projected median age in 2020 will be around 38 years, only to slowly increase to an expected age of 40 by 2030. The median age of U.S.
citizens is critical to Nordstrom, Inc., because they are continuously campaigning and advertising towards audiences who can afford a more expensive
taste, whom are women around fifty years of age. Another major trend, which has surfaced due to the recent recession, are shoppers buying cheap
appealing clothing. Shoppers are now thriftier with their money after the recession and are significantly less interested in spending much of their
disposable income on expensive clothing, which resulted in the idea of Nordstrom Rack. Nordstrom stores are located in heavier traffic areas since more
of an affluent population resides there, and in malls and specialty shopping districts, where other stores attract the same target audience as Nordstrom. A
majority of Nordstrom stores did not perform poorly during the recession since the wealthier population did not have to endure much financial difficulty.
However, this caused even the wealthier middle class to be a bit more sensitive when it came to their spending habits. The average shopper at Nordstrom
makes $100,000, which is about double the average American.
Nordstrom faces the challenge of catering to the customer needs of various regions. Specific fashion lines and products are held at various
Nordstrom locations due to distinctive climates and demographic trends. Nordstrom locations in California may have more swimwear and summer
clothing due the demand for clothing that suits warmer weather. As technology continues to advance and more mobile apps are being created, Nordstrom
faces the challenge to keep up the fashion trends and anticipate the evolution of these fashion trends. Nordstrom does not have a large inventory on hand
in Nordstrom full-line stores due to the changes in trends, requiring customers to order their items online more often.
The demand for vegan leather has dramatically risen in the past few years. Free People, a clothing brand carried by Nordstrom, reported that
their faux leather sales in jackets and vests have made more sales than their authentic leather items. This clothing brand has estimated that their sales for
vegan leather have nearly doubled since their first fashion line incorporated it in 2011. The advancement of technology combined with textile
improvements requires Nordstrom to pay attention to the demand for new materials and how these materials play a critical role in the fashion retail
industry.
Within the past few years, the gap separating low and high earning American citizens is at the largest it’s been since the Great Depression.
Demand for luxury is booming on one end and on the other, discount shopping is becoming more common. Nordstrom’s other businesses, Hautelook and
Nordstrom Rack, cover the popularity of the discount shopping aspect to this trend since they sell discounted merchandise from past seasons from
Nordstrom stores to those who are thriftier and may have a lower-income. On the other hand, with luxury shopping increasing, a more personalization
experience when shopping at Nordstrom should be considered. As the gap continues to grow between the rich and the poor, Nordstrom seems to be
covering both ends of the spectrum, which significantly benefits Nordstrom, Inc.
The fashion retail industry in 2013 generated sales of $3.08 trillion with women accounting for about
two thirds of these sales. Due to women contributing to a majority of sales in the fashion retail industry, about
fifty percent of sales are derived from women’s clothing. Men’s clothing contributes to about twenty percent of
retail sales, leaving children’s clothing to make up the last ten percent of fashion retail sales. Products in this
industry range from shoes, cosmetics, and undergarments to luxury designer handbags. Apparel companies were
presumably wholesalers and sold their products to retailers, but nowadays apparel companies operate as a retailer
and wholesaler. The fashion retail industry is very profitable due to new trends always appearing in fashion and a
large demand to buy these trends at various prices. Selling apparel is exceedingly seasonal, and requires a
majority of retailers to launch new season styles that are compatible with current trends. A new shift in fashion
retail is shifting towards e-commerce, encouraging more retail stores to develop apps and improve their online
website to attract more customers while improving upon the online shopping experience.
Industry Overview
The Fashion Retail Industry
Lorem Ipsum Dolor Issue #, Date
3
Financial AnalysisSales
Nordstrom has managed to continuously increase their net sales, going from $11,762 million in 2012 to $13,110 million in the fiscal year
ending in 2104. Although a majority of net sales are attributed to Nordstrom’s full-line stores in the U.S., the comparable sales growth and net sales for
full-line stores have decreased in the past two and three years respectfully (refer to table 1). As Nordstrom shoppers are changing their shopping
preferences to online, Nordstrom.com, Nordstromrack.com and Hautelook have maintained a comparable sales growth larger than 20% in the past three
years. As a large portion of U.S. shoppers have focused their attention towards discounted merchandise, Nordstrom Rack stores, Nordstromrack.com and
Hautelook have experienced continuous increases in their sales. In 2014, 27% of sales were attributed to Nordstrom, Inc.’s discounted fashion
merchandise segment (refer to table 2). If Nordstrom full-line stores are successful in Canada, there will probably be an increase in Nordstrom’s full-line
comparable store sales by about four percent, and significantly increase Nordstrom’s overall value and its stock price. However in the U.S. the fashion
retail segment Nordstrom full-line stores compete in what seems to be, a quite saturated market, and in five years or so I project that only one Nordstrom
full-line stores will open every other year, if that. Within the next five years I predict that the discount segment of Nordstrom will account for about 40%
of all net sales due to opening of 29 more Nordstrom Rack stores in the next few years. Nordstrom has spent over $864 million in capital expenditures
during 2014 for its expansion plan and plans to spend about $1,270 million in capital expenditures in the next five years. I can see at least a ten-dollar
increase in Nordstrom’s stock price within the next seven years if its expansion plan is successful, their discount segment continues to increase its net
sales and Nordstrom continues to expand on its variety of merchandise available to customers online and in stores.
Fiscal year2014 2013 2012 Nordstrom full-line stores - U.S.$7,682 $7,705$7,964
Nordstrom.com1,996 1,6221,269Nordstrom9,678 9,327 9,233Nordstrom Rack3,215 2,738 2,445Nordstromrack.com and
HauteLook360 295 236
Nordstrom vs. Competitors
*(chart 1)
)
Comparable sales increase (decrease) by channel2: 2014 2013 2012
Nordstrom full-line stores - U.S. (0.5% ) (2.1 %
)
3.9 %
Nordstrom.com 23.1 % 29.5 % 37.1 %
Nordstrom 3.6 % 2.3 % 7.5 %
Nordstrom Rack 3.8 % 2.7 % 7.4 %
Nordstromrack.com and HauteLook 22.1 % 27.3 % —
*(table 1)
At over one hundred years old, Nordstrom, Inc. has managed to flourish into a nationwide top selling fashion retail store. Over the past five years,
Nordstrom managed to have a 24% return on capital. Nordstrom does not compromise quality, selection, or value when it comes to the products it
sells. Nordstrom aims to target higher-end customers who can afford more luxurious brand-name items, leaving the lower-end retail stores to compete
for sales. Nordstrom had sales of $13.11 billion in 2014, a 9.3% increase from the previous fiscal year. Ranked number 204 out of 500 on Forbes 50 a
year ago, Nordstrom has earned significant recognition throughout the fashion retail industry in numerous magazine and magazines. Nordstrom is
now rated number nine most visited online fashion retail website with the acquisition of Hautelook and Trunk Club, when just over three years ago
Nordstrom was ranked 19. Nordstrom also differentiates itself from competitors in its ability to appeal to all audiences, even those who suffer from
disabilities. Nordstrom features famous bloggers and athletes that may have missing limbs and disabilities to communicate its support for all
community members. Nordstrom maintains a strong lead in the fashion retail industry as it was ranked within the top two positions for its selection of
merchandise, on how environmentally conscious it is, and its demonstration of customization of services for its customers. Nordstrom placed fourth
for its overall store operations (see chart 1).
Dillard’s, Bloomingdale’s, Saks Fifth Avenue, Neiman Marcus and Macy’s are
among the top competitors of Nordstrom. Nordstrom is unique in that it has a discount store
and online website that sells last season’s clothes, which have significantly increased sales for
Nordstrom. In 2014, Neiman Marcus had revenues of $4.48 billion and Nordstrom had
revenues of $13.51 billion while Bloomingdales had revenues of $1.072 billion. Financially
Nordstrom surpasses its competitors and is projected to have growth in revenues and sales in
the upcoming years. In 2014, Nordstrom outperformed the industry average. Nordstrom’s
revenues came to a total of $13.51 billion, which was significantly higher than the industry
average of $423.66 million. Nordstrom, Inc. also outperformed Neiman Marcus, when Neiman
Marcus had revenues of $4.84 billion and a net income of -$147.20 million while Nordstrom
had a net income of $720 million. Nordstrom, Inc. is planning on deriving about half of their
sales from its website, Hautelook and The Rack combined over the next five years. Nordstrom
is also teaming up with Like2Buy, which allows customers to purchase their items through
their Instagram page, and Twilio, which is a new app that allows salespeople to text Nordstrom
customers about new merchandise that may appeal to the customer.
*(table 2)
Nordstrom’s Position in the Industry
Nordstrom’s Competition
Lorem Ipsum Dolor Issue #, Date
4
Inventory Turnover
In respect to competitors Macy’s, TJX, Dillard’s and J.C. Penney, Nordstrom is one of the top performing retailers in the fashion retail
industry. In the high end of fashion retailing, Nordstrom overall outperforms all of its competitors. In the fiscal year of 2014, Nordstrom had an
inventory turnover of 5.15, once about every two and a half months while Macy’s and Dillard’s had an inventory turnover rate of 3.08 and 3.14
respectfully, once about every four months (refer to table 3). Nordstrom has spent millions of dollars investing and researching to offer products its
customers desire, and has continued to expand the variety of its merchandise in order to please more customers. However, looking at Nordstrom’s
historical turnover rate, it has steadily declined from 6.29 in 2011 to 5.15 in 2015 as a result from rapid expansion and a wider variety of products. It
is reasonable to expect the turnover rate to drop to about 4.6. to 4.8 over the next few years as more Nordstrom Rack stores open and Nordstrom full-
line stores are to open in Canada, a country which the merchandise offered hasn’t be completely tailored to the customer’s preferences yet. However,
even with a drop in inventory turnover, Nordstrom still has the highest inventory turnover in the higher-end of fashion retailing. On the other hand,
TJX has a large inventory turnover rate of 6.72, which is about once every month and a half, while J.C. Penney has the lowest inventory turnover of
2.86, less than once every four months. Nordstrom’s main competitors in the discount segment of the retail industry are stores such as Marshall’s and
TJ Maxx (part of TJX). Although Nordstrom’s inventory turnover is lower, they offer a wider and larger selection of designed discounted clothing,
since a majority of the clothing comes from Nordstrom full-line stores.
Comparable Sales
Nordstrom outperforms all of its competitors (those in table 3), except J.C. Penney, which has comparable sales increase of .4% more than
Nordstrom. Nordstrom’s comparable sales, also referred to as same-store sales, increase is mostly due to the high comparable sales increase of
Nordstrom.com, Nordstromrack.com and Hautelook.com (refer to table 2). The comparable sales should increase two to four percent during 2015
due expansion into Canada and throughout the U.S, remodeling of stores, and a third fulfillment center that will be opened later this year to process
online orders faster, especially for customers of the east coast. I expect Nordstrom’s comparable sales to hover around six percent the next few years
as the fulfillment center opens as well as other stores.
Sales per square foot
NordstromMacy’sTJXDillard’s J.C Penney Inventory Turnover Rate5.15
3.086.723.142.86Comparable Sales Increase4.0%1.4%3.0%1%4.4%Sales per Square Foot$493$158
$300$131$113
EBT (% of sales)8.778.512.217.53-6.10
20142013201220112011Comparable sales increase4%2.5%7.3%7.2%8.1%EBIT % of sales 10.1%11.1%11.4%11.9%12%Sales per square
foot$493$474$470$431$397Inventory turnover rate5.155.355.936.206.29
20142013201220112011Comparable sales increase4%2.5%7.3%7.2%8.1%EBIT % of sales 10.1%11.1%11.4%11.9%12%Sales per square
foot$493$474$470$431$397Inventory turnover rate5.155.355.936.206.29
Nordstrom, Inc. has the largest sales per square foot at $493 in
2014, while Macy’s, Dillard’s, J.C Penney all had sales from $113 to
$158, all a third or less of Nordstrom’s ratio. Nordstrom Rack stores had
sales per square foot of $552 while TJ Maxx and Marshall’s average
about $304 at the end 2014. I expect Nordstrom to continue to have high
sales per square foot since its merchandise is more expensive and does a
great job at offering a vast variety of merchandise that appeals to a wider
audience of discount shoppers. Mentioned earlier, one of Nordstrom’s
strong suit is offering designer prices at discounted prices for thriftier
shoppers while offering unique and more luxurious clothing for those
shoppers with a more flexible budget. From 2011 to 2014, Nordstrom
has managed to increase their sales per square foot from $397 to $493,
about a 20% increase (refer to table 4). It is reasonable to project sales
per square foot to be around $515 or more for the next few years as
Nordstrom continues to expand into Canada and Nordstrom Racks stores
continue to open.
2014 2013 2012 2011 2011
Comparabl
e sales
increase
4% 2.5% 7.3% 7.2% 8.1%
EBIT % of
sales
10.1
%
11.1
%
11.4
%
11.9
%
12%
Sales per
square foot
$493 $474 $470 $431 $397
Inventory
turnover
rate
5.15 5.35 5.93 6.20 6.29
* (Table 3 –ratios are in respect to the fiscal year ended in 2014)
EBT (% of sales)
Nordstrom’s EBT of 8.77% is higher than every competitor except
TJX, which has an EBT of 12.21%. Nordstrom’s EBT is lower than expected
in 2014 due an increase of $316 million in general and administrative
expenses from $3,272 million in 2013 to $3,588 million in 2014. Nordstrom’s
expenses are especially high right now since they just acquired Trunk Club,
are heavily investing in technology right now, and are rapidly expanding. After
the next five years, when Nordstrom’s expansion plans are almost finished, the
EBT will increase once again around 11% to 12%.
*(Table 4- Nordstrom’s Ratios)
Lorem Ipsum Dolor Issue #, Date
5
Key investment risks
• Expansion into Canada
• Median expected age is expected to be 38 to 40
• Higher online shopping preferences
• New acquisitions and partnerships that could negatively impact core business
• Technology and investments fail to perform as expected/poorly implemented
A major setback that could hurt Nordstrom, Inc. is its expansion into Canada. Although there is not much of a language barrier from U.S. to
Canada, there is a significant variance in government regulations, employee benefits, and supply chain. In addition, Nordstrom full-line stores may not
collect as much sales as planned due to higher tax rates Canadians have to pay on top of the expensive merchandise at Nordstrom full-line stores. Due to
the products being more expensive to purchase in Canada than the U.S., customers may potentially buy less merchandise and respond to such prices with
negative feedback. Nordstrom, Inc. plans to lose around $60 million before interest and taxes in Canada in 2015, an 88% increase from 2014. Nordstrom
full-line stores may struggle with sustaining sales and profits for the first few years of operating in Canada.
Another concern that arises when investing in Nordstrom, Inc. is the declining population among the age of fifty year olds. Nordstrom, Inc. has
been opening one to two full-line stores a year for about the past decade, and this growth may subside to about one store every year or every other year as
the projected median age will be 38 to 40 years of age until 2030. Within the last three years, six Nordstrom full-line stores have been closed with three
of its closures being more recent in 2014. Generation X and the baby boomers still value the “touch and feel” aspect to brick and mortar, however the
younger generations such as the millennials prefer to buy merchandise from online. Sales of Nordstrom’s full-line stores could potentially face a
downward trend in its sales, as its target market of age 50 decreases, resulting in the overall value of brick and mortar to weaken.
As Nordstrom’s shoppers are shifting their preferences to online shopping, Nordstrom faces pressure to keep up with the advancement in
technology in order to compete with other online retailers. Heavy investments in RD are upon one of the many necessities Nordstrom must do in order
to improve upon the online shopping experience for its customers and maintain its online retail sales. However, if new systems are not implemented
correctly, this will result in a loss of online sales and decrease in customer satisfaction. A loss in sales is also realized if investments do not go as
planned, and underperform.
Nordstrom, Inc. has reported that more customers are shifting their shopping preferences from in-store to online, which could potentially be a
major concern. Retail e-commerce in the U.S. is projected to grow 9.5% a year from 2013 to 2017, from about $260 billion to $435 billion. As e-
commerce continues to rapidly evolve, Nordstrom faces potential threats as the e-commerce environment become extremely competitive as more e-
commerce retail stores appear. Currently 35% of Nordstrom’s capital expenditures are for technology, however this percentage will most likely increase
about three to four percent in the upcoming years. Nordstrom’s capital expenditures are projected to jump from $803 billion in 2014 to $1136 by 2016.
Nordstrom, Inc. may have a loyal customer base, but faces hefty projected RD expenses as more e-commerce fashion retailers join the market.
If Nordstrom acquires companies that do not align with their strategic decisions and fail to benefit the overall company, significant losses can
be realized. New partnerships that are formed also can severely hurt Nordstrom’s financials and their reputation. If a partner of Nordstrom fails to
participate in morally acceptable behavior or is exploited for illegal activity, Nordstrom’s reputation can be sabotaged. Any relation to negative media
attention will cause Nordstrom’s’ stock value to drop and consequently sales will also decrease.
As Nordstrom’s shoppers are shifting their preferences to online shopping, Nordstrom faces pressure to keep up with advancement in
technology. Nordstrom has spent billions of dollars in capital expenditures in order to discover new advancements in technology and strategies to
increase customer satisfaction, especially for online shoppers. If implementation of new technology goes poorly, backlash from customers will occur,
severely damaging sales.
Valuation Analysis
Nordstrom, Inc. stock is performing incredibly well as it has risen from $19.69 on May 20, 2009 to $74.71 on May 18, 2015. After evaluating
Nordstrom by three different growth models, Nordstrom’s stock should be valued at $92.36.
Discount Cash Flow Models
Dividend Valuation Model:
The dividend model projected prices hover around $28 to $35, which is significantly lower than the other two models’ projected values of
Nordstrom’s stock, and the current stock price of $72.64. The cost of equity capital 8.8% used as the discount rate in the dividend model is
RF + (ERM - RF) Beta
which is equal to 4.5+(8.42 - 4.5)1.10 (refer to appendix for more information). The dividend model’s projection of Nordstrom’s stock price is severely
undervalued, and it not a great estimator of Nordstrom’s price . The projected stock price for Nordstrom should be at minimum price of $80, but there are
several factors that are not considered in the dividend growth equation. Nordstrom, Inc. has planned to buy back $1.323 billion of their stock back
Investment Risks
Multiples Approach
P/E Approach
The P/E approach, to arrive at Nordstrom’s stock price, is very close to the actual current stock price. The stock price according to the P/E
approach is $78.85 and the closing price on June 8,2015 for Nordstrom’s stock was $73.16. The P/E approach is derived from estimating the future P/E
ratio of Nordstrom, 19 and is multiplied by the forward EPS (analysts’ estimates of the forward EPS), 4.15. EPS have increased from $3.56 in 2012 to $3.71
in the fiscal year ending in 2014, which is an increase of about six percent, however with large expenses and capital expenditures due to Nordstrom’s
expansion, EPS are lower than future EPS. A growth of about ten percent is more plausible when calculating future EPS since large capital expenditures for
expansion will aid Nordstrom’s future revenues.
EV/EBITDA
The EV/EBITDA approach generated a price of $71.82, which is only a few dollars less than Nordstrom’s current stock price, but still
undervalues it. The future EBITDA of $1,995.79 is derived from the 2014 EBITDA value of $1,831 million multiplied by a growth rate of nine percent.
Nine percent is a logical multiplier since the six-year average annual increase in EBITDA is 9.8%, and Nordstrom will realize a higher EBITDA after
opening more Nordstrom Rack stores along with its expansion of Nordstrom full-line stores in Canada. The future EBITDA value is then multiplied by the
EV/EBITDA ratio of eight (average of EV/EBITDA ratio over the past six years).
Best Estimate
I think to most accurate estimator of the intrinsic price of Nordstrom, Inc.’s stock is a combination of the 2-stage and the 3-stage growth model of
free cash flows to the firm. Weighting the two-stage at forty percent and the three-stage at sixty percent, the price of Nordstrom, Inc.’s stock should be
($84.03(.4)+ $97.92 (.6)) which is $92.36. The FCFF shows how much money the company has available to both debt and equity holders, and is more
favorable than the FCFE since the debt levels fluctuate in Nordstrom, Inc.’s financial statements as they expand throughout the U.S. and Canada. The FCFE
model includes the subtraction of capital expenditures because it is a drain on cash. However 43% of Nordstrom’s capital expenditures are expansionary,
while 35% is used for technology. Expansionary and technology capital expenditures account for 78% of total expenditures, which should not be considered
a drain on cash because this investment will significantly increase the sales and profit for Nordstrom, Inc. in the future. In addition, the multiple approach of
the P/E ratio does not seem a good fit in determining the correct value for Nordstrom’s stock due to the abnormal P/E growth of 15.05 to 21.25 from 2012
to 2014. A majority of larger companies have a P/E that hovers around 11 to 13, and Nordstrom’s P/E ratio is unusually large at 21.25.
Dividend
Model
FCFF FCFE
Constant
Growth
$28.84 $58.70 $74.23
2-Stage $34.34 $84.03 $95.04
3-Stage $32.84 $97.92 $107.75
by 2016, about nine percent of their shares, which should increase the stock price by at least three percent. Also, the dividend valuation model fails to
acknowledge that Nordstrom’s dividends have increased almost every year, and at time more than a $.10 a year, making it difficult to forecast a value
from dividends that are constantly growing.
Free Cash Flows to the Firm:
The FCFF model is the best predictor of Nordstrom’s stock value (see table 5), as it generates a more realistic outlook on Nordstrom’s stock
compared to the dividend valuation model. The weighted average cost of capital equation used for the discount rate in the FCFF model is calculated as:
(We * Ke +Wd *[kd (1-T)])
, which are (.79*8.81%)+.21(3.04%(1-.3924)). The free cash flows to the firm for Nordstrom have steadily declined from 2010 to 2014 and have an
overall annual growth rate of -2.5%. Prices generated from the FCFF model are $58.70, $84.03, and $97.92 in respect to the constant growth, two-stage
growth and three-stage growth model. The equation below is used to arrive at the FCFF prices:
FCFF0/ (WACC-g)- MVD + Cash
,which is $2.84/(7.35%-3.50%)-$19.44+$4.34) (see appendix for more information).
Free Cash flow to Equity:
The FCFE model projection of Nordstrom’ stock prices are on average about twelve dollars higher than projections of Nordstrom’s prices from
the FCFF model (refer to graph 1). The estimated values of Nordstrom’s stock are $75.58, $95.04, and $107.75 in respect to the constant, two-stage and
three-stage growth model for the free cash flow to equity model. The values in the equation for the FCFE model
(FCFE1/( k-g) + Cash)
are $2.691/(7.59%-3.50%)+$4.34. The FCFE model has the same growth rates and time horizon of growth due to the similarities in EBIT and
EAT over the past few years.
*(Table 5)
Appendix
Dividend Valuation Model:
The growth rate used for the Constant Growth Dividend Model is 3.5%, the average GDP growth. The Value Line shows a significant increase
in annual dividends declared; from 2002 to 2008 the annual dividends per share have increased from $0.19 to $0.64, about a 30% increase. Since 2009,
the annual dividends declared per share continued to increase more than a dime each year, increasing from $0.64 in 2009 to $1.32 in 2014 with an
average annual growth of 9.70%. Nordstrom continues to reveal plans on opening Nordstrom Rack stores and Nordstrom full-line stores, increasing
future cash flows, and overall increasing the dividends to shareholders. The projected price of Nordstrom’s stock in this model is $28.84.
In the 2-Stage Growth Model for the dividend model, N is realistically close to seven years, with a first stage growth of 8.5% and the second
stage of growth to be five percent. Nordstrom, Inc. has released information stating that they aim to open about one hundred more Nordstrom Rack stores
by 2020, and about one to two Nordstrom full-line stores each year. Cash flows will increase significantly in this time since stores will be opening
continuously throughout the next five years, bring in millions of dollars in sales throughout this time, with a vast amount of cash being realized in the
years following the opening of stores. In addition, the Value Line projects future annual dividends to grow annually of an average of 9.5% until 2019,
which seems to be a more optimistic projection. The second growth of 3.5% percent is the same as the growth of the constant growth dividend model.
The two-stage growth model generated Nordstrom’s stock price to be $34.34.
In the 3-Stage Growth Model, the first growth’s duration is four years as it grows at 12%. As mentioned previously, Nordstrom is planning to
open 100 more Rack stores of their discount stores within the next five years in the U.S. In addition, four of their full-line Nordstrom stores are planned
to open by 2017 in Canada, which will contribute to a significant increase in sales in the upcoming four years. In the past ten years dividends have grown
18.5% and are projected to grow 9.5%, averaging out to 14%, making 12% a realistic growth for the next four years. The following growth of seven
years, as in the previous model, is plausible to grow at 7.5%. I arrived at 7.5% for the second annual growth rate since it is less than the growth in the
previous model, 8.5%, yet is larger than the third growth rate of 3.5%. The seven years following the first growth will have a smaller growth in sales.
Nordstrom will most likely take time to listen to customer demands in Canada and learn more about the demographics in Canada before expanding more
in the country. In addition, Nordstrom Rack openings may subside quite a bit, to prevent the issue of over-expanding too rapidly. The three-stage growth
model for Nordstrom’s stock price is $32.84, less than the two-stage growth model.
Free Cash Flows to the Firm Valuation Model:
In addition to the dividend model, 3.50% was used as the continuous growth rate for the FCFF model. The average of the average growth rates
of FCFF from 2009 to 2015 was 8.5%, but this included wide fluctuations in the average growth rates, -36% to 63.1%. The growth rate of 3.5% was used
because it is more plausible Nordstrom will grow at the GDP rate, and not any quicker, especially due to the saturation of higher-end fashion retail
market in the U.S. The price generated from the FCFF constant growth model is $58.66.
In the 2-Stage Growth Model for FCFF the first growth portion has a time horizon of six years at a growth rate of 8.5%. According to the Value
Line over the next five to six years earnings, cash flow, and sales are projected to grow at a minimum of eight percent to approximately nine percent. The
average of these projected growths came to 8.5%, a valid reason of using this percentage as the first growth rate. In addition, EAT  EBIT had close
averages of annual growths at 10.3% and 9.7% respectfully. Also, the average increase in capital expenditures from 2009 to 2014, less the difference
from 2012 to 2013, was close to 11%. As the averages in various aspects that make up FCFF hover near 8.5% to 11%, a growth of 8.5% as the first
growth rate in the 2-Stage Model is a valid prediction. For the reasons mentioned earlier, the second growth in the 2-Stage Model for the FCFF model is
3.50%. The price in the 2-Stage Growth Model for FCFF is $84.03.
The 3-Stage Growth Model growth grates for the first portion of growth, six years and second portion of growth, three years, are 9.50% and 7%
respectfully, with 3.50% as the constant growth. During the next six years Nordstrom, Inc. is quite busy expanding their stores throughout the U.S. and
Canada. In addition, Nordstrom may acquire other clothing businesses and online sites in the future, providing more profit and sales for Nordstrom, Inc.
However, Nordstrom, Inc. may slow down their opening of stores in Canada, as they look further into the demographics and ideal locations in Canada.
After the first six years, capital expenditures related to expansion are likely to decrease, leading to a reduction in future cash flows, reducing the EBIT
and EAT. The stock price for Nordstrom in this growth model is $97.92.
Free Cash Flows to Equity Valuation Model:
Used in the previous two models, the constant growth rate used for the FCFE model is 3.50%. In the FCFE model, the FCFE were extremely
volatile, especially from 2010 to 2011 where the FCFE increased by 1,214, a 157.3% increase. The average of the average growth rates of FCFE was
9.1%, which is too high to be the continuous growth rate, and it is more plausible to be 5.50%. Generally five percent would be the highest constant
growth considered, but Nordstrom’s position in the retail industry and future growth in Canada and in the U.S. proves that Nordstrom has a bright future
and will continue to be a strong leader in the fashion retail industry. The price for Nordstrom’s stock in this growth model is $74.23.
In the two-stage growth model of FCFE, the growth rate for the first six years is 8.5%, and the constant growth rate after this time period is
3.50%. The FCFE has the same time period and growth rates as the FCFF because both models involve a majority of the same financials aspects.
Nordstrom’s stock price is $95.04 in this growth model.
In the three -stage growth model of FCFF the growth rates were 9.5%, 7.0% and 3.50% in respect to the time horizons of six years, three years,
and forever. As mentioned earlier, the 9.5% seemed logical for the next six years because by 2021, at least one hundred Nordstrom Rack stores will be
opened throughout the U.S, six Nordstrom stores will be opened in Canada, and Nordstrom is able to acquire other smaller clothing businesses that will
benefit the corporation. After 2021 Nordstrom’s sales may decrease a bit if there is a mishap in the Nordstrom full-line stores in Canada, plus six
Nordstrom full-line stores have closed down in the past three years, and more could close down. The price generated from this model was $107.75.
Cost Of Equity Capital:
The equation of cost of equity capital is:
Risk Free Rate + (Expected Return on the Market – Risk Free Rate) *Beta
For the cost of equity capital, the Current Expectations Approach was more applicable and realistic. The market is still growing at a slower and steady
pace after the recession hit the U.S. a little over half of a decade ago, and is unlikely progress at a faster pace. The risk-free rate is used in this equation
is 4.5%, which is the SP500 geometric average of stock and T-bills from 1928-2014. The return on equity was 9.12% using the Historic Approach,
versus 8.812% using the Current Expectations Approach. For the expected return on the market of the ten-year time horizon of 2014 to 2023, I chose
8.42%, which expects the SP500 earnings to grow about six percent and the P/E ratio to decrease about 2.48% a year. The MRP using the historic
approach is 4.2% and the market risk premium that is more realistic is 3.92%, which is the current expectations approach. The market’s risk premium is
closer to 3.92% because interest rates are practically zero and major corporations in the SP500 are still recovering from the recession in 2008 and are
engaging in ways to sustain a healthy growth, reducing the market risk. The Historic Approach is not as appealing to me because the history in market
risk premium is the average of the past one ten decades, which is not a great indicator of how the future market will be in the next ten years.
4.5 + (8.42 - 4.5) 1.10 = 8.81%
Weighted Average Cost of Capital:
WACC Calculations:
Debt + Equity $17,631
Debt Component
Long Term Debt $3,693
Current portion of Long Term Debt $8.00
Total Debt $3,701
Pre-Tax Cost of LT Debt 3.04%
Effective Tax Rate 39.24%
Weight of Debt 21%
Equity Component
Market Capitalization $13,930
Risk Free Rate 4.50%
(*85 year average of t-bills and t-bonds)
Adjusted Beta 1.10
(*Value-Line Beta)
Market Risk Premium 3.92%
Weight of Equity 79%
Cost of Equity Capital 8.81%
WACC= Weight of Equity * Cost of Equity Capital + (Weight of Debt * [Pretax Cost of Debt (1-Corpotate Tax Rate)]
(.79% * 8.81%) + 21% (3.04%(1- 5.60%)) =7.36%

Más contenido relacionado

La actualidad más candente

Marketing Audit FINAL
Marketing Audit FINALMarketing Audit FINAL
Marketing Audit FINALLogan Stodart
 
Market intelligence ver1.0
Market intelligence ver1.0Market intelligence ver1.0
Market intelligence ver1.0Anil Kumar
 
Wal Mart Case Study by dhimant
Wal Mart Case Study by dhimantWal Mart Case Study by dhimant
Wal Mart Case Study by dhimant11121988
 
Topshop Presentation
Topshop PresentationTopshop Presentation
Topshop PresentationAndrew
 
Hibbett Sporting Goods Competitive Overview
Hibbett Sporting Goods Competitive OverviewHibbett Sporting Goods Competitive Overview
Hibbett Sporting Goods Competitive OverviewBrandon Thomson
 
Five Globally Successful Businesses
Five Globally Successful BusinessesFive Globally Successful Businesses
Five Globally Successful Businesseskimjashaw
 
Nordstrom 4Ps Samantha Casey
Nordstrom 4Ps Samantha CaseyNordstrom 4Ps Samantha Casey
Nordstrom 4Ps Samantha CaseySamantha Casey
 
AM101 Team 5 Project 2 Interim for Review-3
AM101 Team 5 Project 2 Interim for Review-3AM101 Team 5 Project 2 Interim for Review-3
AM101 Team 5 Project 2 Interim for Review-3Tara Tollett
 
Austin Reed SWOT
Austin Reed SWOTAustin Reed SWOT
Austin Reed SWOTZara Clark
 
Luxury retails-evolving-landscape
Luxury retails-evolving-landscapeLuxury retails-evolving-landscape
Luxury retails-evolving-landscapeVeena Srinath
 
DMEF Collegiate ECHO Challenge 2013 'Snip to be Cool with dELIA*s
DMEF Collegiate ECHO Challenge 2013 'Snip to be Cool with dELIA*sDMEF Collegiate ECHO Challenge 2013 'Snip to be Cool with dELIA*s
DMEF Collegiate ECHO Challenge 2013 'Snip to be Cool with dELIA*sJessica Dunning
 
Brand NOT Bland
Brand NOT BlandBrand NOT Bland
Brand NOT BlandAsiaV
 
Planning For A Miracle On 34th Street
Planning For A Miracle On 34th StreetPlanning For A Miracle On 34th Street
Planning For A Miracle On 34th StreetNivin Vinoi
 
Meeting the challenges of globalization3
Meeting the challenges of globalization3Meeting the challenges of globalization3
Meeting the challenges of globalization3Brian Berger
 
Nihar Patel - DKS HF Report
Nihar Patel - DKS HF ReportNihar Patel - DKS HF Report
Nihar Patel - DKS HF ReportNihar Patel
 
Luxury Goods Industry Analysis 2013
Luxury Goods Industry Analysis 2013Luxury Goods Industry Analysis 2013
Luxury Goods Industry Analysis 2013vy1230
 

La actualidad más candente (20)

Marketing Audit FINAL
Marketing Audit FINALMarketing Audit FINAL
Marketing Audit FINAL
 
Market intelligence ver1.0
Market intelligence ver1.0Market intelligence ver1.0
Market intelligence ver1.0
 
Macys Research
Macys ResearchMacys Research
Macys Research
 
Wal Mart Case Study by dhimant
Wal Mart Case Study by dhimantWal Mart Case Study by dhimant
Wal Mart Case Study by dhimant
 
Topshop Presentation
Topshop PresentationTopshop Presentation
Topshop Presentation
 
moosejaw final
moosejaw finalmoosejaw final
moosejaw final
 
Hibbett Sporting Goods Competitive Overview
Hibbett Sporting Goods Competitive OverviewHibbett Sporting Goods Competitive Overview
Hibbett Sporting Goods Competitive Overview
 
Five Globally Successful Businesses
Five Globally Successful BusinessesFive Globally Successful Businesses
Five Globally Successful Businesses
 
Nordstrom 4Ps Samantha Casey
Nordstrom 4Ps Samantha CaseyNordstrom 4Ps Samantha Casey
Nordstrom 4Ps Samantha Casey
 
AM101 Team 5 Project 2 Interim for Review-3
AM101 Team 5 Project 2 Interim for Review-3AM101 Team 5 Project 2 Interim for Review-3
AM101 Team 5 Project 2 Interim for Review-3
 
Austin Reed SWOT
Austin Reed SWOTAustin Reed SWOT
Austin Reed SWOT
 
Luxury retails-evolving-landscape
Luxury retails-evolving-landscapeLuxury retails-evolving-landscape
Luxury retails-evolving-landscape
 
DMEF Collegiate ECHO Challenge 2013 'Snip to be Cool with dELIA*s
DMEF Collegiate ECHO Challenge 2013 'Snip to be Cool with dELIA*sDMEF Collegiate ECHO Challenge 2013 'Snip to be Cool with dELIA*s
DMEF Collegiate ECHO Challenge 2013 'Snip to be Cool with dELIA*s
 
Brand NOT Bland
Brand NOT BlandBrand NOT Bland
Brand NOT Bland
 
Planning For A Miracle On 34th Street
Planning For A Miracle On 34th StreetPlanning For A Miracle On 34th Street
Planning For A Miracle On 34th Street
 
Meeting the challenges of globalization3
Meeting the challenges of globalization3Meeting the challenges of globalization3
Meeting the challenges of globalization3
 
Rwatkins 610 final
Rwatkins 610 finalRwatkins 610 final
Rwatkins 610 final
 
Nihar Patel - DKS HF Report
Nihar Patel - DKS HF ReportNihar Patel - DKS HF Report
Nihar Patel - DKS HF Report
 
Mm's
Mm'sMm's
Mm's
 
Luxury Goods Industry Analysis 2013
Luxury Goods Industry Analysis 2013Luxury Goods Industry Analysis 2013
Luxury Goods Industry Analysis 2013
 

Similar a Nordstrom Equity Analysis June 8

Nordstrom Retail Analysis
Nordstrom Retail AnalysisNordstrom Retail Analysis
Nordstrom Retail AnalysisJi Young Lee
 
Stock Project - Maisy L.
Stock Project - Maisy L.Stock Project - Maisy L.
Stock Project - Maisy L.Maisy Lam
 
textilesgarment.blogspot.com.pdf
textilesgarment.blogspot.com.pdftextilesgarment.blogspot.com.pdf
textilesgarment.blogspot.com.pdfMD. Alimam
 
Apparel Industry Linkedin
Apparel Industry LinkedinApparel Industry Linkedin
Apparel Industry LinkedinJulien Kang
 
Nordstrom vs. Bloomingdale's
Nordstrom vs. Bloomingdale'sNordstrom vs. Bloomingdale's
Nordstrom vs. Bloomingdale'sCallen Stapleton
 
A multifaceted future the jewelry industry in 2020
A multifaceted future the jewelry industry in 2020A multifaceted future the jewelry industry in 2020
A multifaceted future the jewelry industry in 2020Anil GROVER
 
Retail 2020: Reinventing Retailing - Once Again
Retail 2020: Reinventing Retailing - Once AgainRetail 2020: Reinventing Retailing - Once Again
Retail 2020: Reinventing Retailing - Once AgainIBM Software India
 
In November of 2013 Doug McMillon had just been named the CEO
In November of 2013 Doug McMillon had just been named the CEO In November of 2013 Doug McMillon had just been named the CEO
In November of 2013 Doug McMillon had just been named the CEO MalikPinckney86
 
Questionnaire Creation You will create a survey that will allo.docx
Questionnaire Creation You will create a survey that will allo.docxQuestionnaire Creation You will create a survey that will allo.docx
Questionnaire Creation You will create a survey that will allo.docxsimonlbentley59018
 
In November of 2013 Doug McMillon had just been named the CEO of Walma.docx
In November of 2013 Doug McMillon had just been named the CEO of Walma.docxIn November of 2013 Doug McMillon had just been named the CEO of Walma.docx
In November of 2013 Doug McMillon had just been named the CEO of Walma.docxsandraa52
 
Levis at Wal-Mart DARDEN叁 UVA-M-0711 BUSINESS PUBLISHI.docx
Levis at Wal-Mart DARDEN叁 UVA-M-0711 BUSINESS PUBLISHI.docxLevis at Wal-Mart DARDEN叁 UVA-M-0711 BUSINESS PUBLISHI.docx
Levis at Wal-Mart DARDEN叁 UVA-M-0711 BUSINESS PUBLISHI.docxsmile790243
 
nd8fashion.blogspot.com.pdf
nd8fashion.blogspot.com.pdfnd8fashion.blogspot.com.pdf
nd8fashion.blogspot.com.pdfMD. Alimam
 

Similar a Nordstrom Equity Analysis June 8 (16)

Nordstrom Retail Analysis
Nordstrom Retail AnalysisNordstrom Retail Analysis
Nordstrom Retail Analysis
 
Nordstrom 2
Nordstrom 2Nordstrom 2
Nordstrom 2
 
Stock Project - Maisy L.
Stock Project - Maisy L.Stock Project - Maisy L.
Stock Project - Maisy L.
 
Nordstrom
NordstromNordstrom
Nordstrom
 
Nordstrom
NordstromNordstrom
Nordstrom
 
textilesgarment.blogspot.com.pdf
textilesgarment.blogspot.com.pdftextilesgarment.blogspot.com.pdf
textilesgarment.blogspot.com.pdf
 
Apparel Industry Linkedin
Apparel Industry LinkedinApparel Industry Linkedin
Apparel Industry Linkedin
 
Capstone Project
Capstone ProjectCapstone Project
Capstone Project
 
Nordstrom vs. Bloomingdale's
Nordstrom vs. Bloomingdale'sNordstrom vs. Bloomingdale's
Nordstrom vs. Bloomingdale's
 
A multifaceted future the jewelry industry in 2020
A multifaceted future the jewelry industry in 2020A multifaceted future the jewelry industry in 2020
A multifaceted future the jewelry industry in 2020
 
Retail 2020: Reinventing Retailing - Once Again
Retail 2020: Reinventing Retailing - Once AgainRetail 2020: Reinventing Retailing - Once Again
Retail 2020: Reinventing Retailing - Once Again
 
In November of 2013 Doug McMillon had just been named the CEO
In November of 2013 Doug McMillon had just been named the CEO In November of 2013 Doug McMillon had just been named the CEO
In November of 2013 Doug McMillon had just been named the CEO
 
Questionnaire Creation You will create a survey that will allo.docx
Questionnaire Creation You will create a survey that will allo.docxQuestionnaire Creation You will create a survey that will allo.docx
Questionnaire Creation You will create a survey that will allo.docx
 
In November of 2013 Doug McMillon had just been named the CEO of Walma.docx
In November of 2013 Doug McMillon had just been named the CEO of Walma.docxIn November of 2013 Doug McMillon had just been named the CEO of Walma.docx
In November of 2013 Doug McMillon had just been named the CEO of Walma.docx
 
Levis at Wal-Mart DARDEN叁 UVA-M-0711 BUSINESS PUBLISHI.docx
Levis at Wal-Mart DARDEN叁 UVA-M-0711 BUSINESS PUBLISHI.docxLevis at Wal-Mart DARDEN叁 UVA-M-0711 BUSINESS PUBLISHI.docx
Levis at Wal-Mart DARDEN叁 UVA-M-0711 BUSINESS PUBLISHI.docx
 
nd8fashion.blogspot.com.pdf
nd8fashion.blogspot.com.pdfnd8fashion.blogspot.com.pdf
nd8fashion.blogspot.com.pdf
 

Nordstrom Equity Analysis June 8

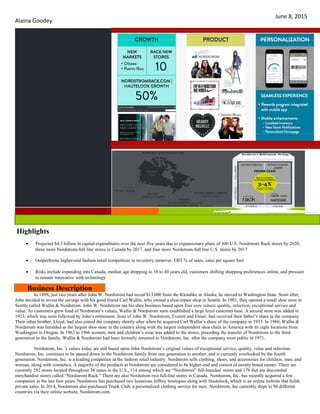
  • 1. Lorem Ipsum Dolor Issue #, Date Nordstrom,Inc.(JWN) Business Description June 8, 2015 In 1899, just two years after John W. Nordstrom had saved $13,000 from the Klondike in Alaska, he moved to Washington State. Soon after, John decided to invest the savings with his good friend Carl Wallin, who owned a shoe-repair shop in Seattle. In 1901, they opened a small shoe store in Seattle called Wallin & Nordstrom. John W. Nordstrom ran his shoe business based upon four core values; quality, selection, exceptional service and value. As customers grew fond of Nordstrom’s values, Wallin & Nordstrom soon established a large loyal customer base. A second store was added in 1923, which was soon followed by John’s retirement. Sons of John W. Nordstrom, Everett and Elmer, had received their father’s share in the company. Their other brother, Lloyd, had also joined the company shortly after when he acquired Carl Wallin’s share of the company in 1933. In 1960, Wallin & Nordstrom was heralded as the largest shoe store in the country along with the largest independent shoe chain in America with its eight locations from Washington to Oregon. In 1963 to 1966 women, men and children’s wear was added to the stores, preceding the transfer of Nordstrom to the third generation in the family. Wallin & Nordstrom had been formally renamed to Nordstrom, Inc. after the company went public in 1971. Nordstrom, Inc.’s values today are still based upon John Nordstrom’s original values of exceptional service, quality, value and selection. Nordstrom, Inc. continues to be passed down in the Nordstrom family from one generation to another, and is currently overlooked by the fourth generation. Nordstrom, Inc. is a leading competitor in the fashion retail industry. Nordstrom sells clothing, shoes, and accessories for children, men, and woman, along with cosmetics. A majority of the products at Nordstrom are considered to be higher-end and consist of mostly brand names. There are currently 292 stores located throughout 38 states in the U.S., 114 among which are “Nordstrom” full-branded stores and 178 that are discounted merchandise stores called “Nordstrom Rack.” There are also Nordstrom two full-line stores in Canada. Nordstrom, Inc. has recently acquired a few companies in the last four years. Nordstrom has purchased two luxurious Jeffrey boutiques along with Hautelook, which is an online website that holds private sales. In 2014, Nordstrom also purchased Trunk Club, a personalized clothing service for men. Nordstrom, Inc currently ships to 96 different countries via their online website, Nordstrom.com. Highlights • Projected $4.3 billion in capital expenditures over the next five years due to expansionary plans of 300 U.S. Nordstrom Rack stores by 2020, three more Nordstrom-full line stores in Canada by 2017, and four more Nordstrom-full line U.S. stores by 2017 • Outperforms higher-end fashion retail competitors in inventory turnover, EBT % of sales, sales per square foot • Risks include expanding into Canada, median age dropping to 38 to 40 years old, customers shifting shopping preferences online, and pressure to remain innovative with technology Alaina Goodey
  • 2. Lorem Ipsum Dolor Issue #, Date 2 Nordstrom, Inc. was also a member of the credit card industry up until recently, when it decided to see its credit portfolio to TD Bank Group. TD Bank Group is now the distributer of private label credit cards and Visa credit cards for Nordstrom’s stores in the U.S. Nordstrom is no longer financing customers’ purchases, but still controls the issuing of Nordstrom debit cards and their reward program. A large portion of credit card profits will continue go to Nordstrom, Inc., however a chunk of profits will go to TD Bank Group as well. Nordstrom, Inc. implements an inverted pyramid structure in its management practices, which differentiates Nordstrom, Inc. from its competitors. Starting from the top of the pyramid are the customers, followed by sales and support people, then department managers, then store managers, buyers, regional managers, and general managers, and finally, the board of directors. All members of Nordstrom work to support each other in order to work diligently as a team. Sales people are granted trust and empowerment when faced with a difficult situation with customers, in the sense that they do what is best for the customer. Nordstrom offers healthy competition between employees by rewarding them with bonuses and commission, and even public recognition for outstanding behavior. Nordstrom provides coaching and workshops for all employees to improve their interactions with customers. Nordstrom’s executives and board of directors acknowledge that sales people have the most direct contact with customers, and therefore aim to improve the behavior of salespeople in order to improve customers’ experience when shopping at Nordstrom stores. Demographics The projected median age in 2020 will be around 38 years, only to slowly increase to an expected age of 40 by 2030. The median age of U.S. citizens is critical to Nordstrom, Inc., because they are continuously campaigning and advertising towards audiences who can afford a more expensive taste, whom are women around fifty years of age. Another major trend, which has surfaced due to the recent recession, are shoppers buying cheap appealing clothing. Shoppers are now thriftier with their money after the recession and are significantly less interested in spending much of their disposable income on expensive clothing, which resulted in the idea of Nordstrom Rack. Nordstrom stores are located in heavier traffic areas since more of an affluent population resides there, and in malls and specialty shopping districts, where other stores attract the same target audience as Nordstrom. A majority of Nordstrom stores did not perform poorly during the recession since the wealthier population did not have to endure much financial difficulty. However, this caused even the wealthier middle class to be a bit more sensitive when it came to their spending habits. The average shopper at Nordstrom makes $100,000, which is about double the average American. Nordstrom faces the challenge of catering to the customer needs of various regions. Specific fashion lines and products are held at various Nordstrom locations due to distinctive climates and demographic trends. Nordstrom locations in California may have more swimwear and summer clothing due the demand for clothing that suits warmer weather. As technology continues to advance and more mobile apps are being created, Nordstrom faces the challenge to keep up the fashion trends and anticipate the evolution of these fashion trends. Nordstrom does not have a large inventory on hand in Nordstrom full-line stores due to the changes in trends, requiring customers to order their items online more often. The demand for vegan leather has dramatically risen in the past few years. Free People, a clothing brand carried by Nordstrom, reported that their faux leather sales in jackets and vests have made more sales than their authentic leather items. This clothing brand has estimated that their sales for vegan leather have nearly doubled since their first fashion line incorporated it in 2011. The advancement of technology combined with textile improvements requires Nordstrom to pay attention to the demand for new materials and how these materials play a critical role in the fashion retail industry. Within the past few years, the gap separating low and high earning American citizens is at the largest it’s been since the Great Depression. Demand for luxury is booming on one end and on the other, discount shopping is becoming more common. Nordstrom’s other businesses, Hautelook and Nordstrom Rack, cover the popularity of the discount shopping aspect to this trend since they sell discounted merchandise from past seasons from Nordstrom stores to those who are thriftier and may have a lower-income. On the other hand, with luxury shopping increasing, a more personalization experience when shopping at Nordstrom should be considered. As the gap continues to grow between the rich and the poor, Nordstrom seems to be covering both ends of the spectrum, which significantly benefits Nordstrom, Inc. The fashion retail industry in 2013 generated sales of $3.08 trillion with women accounting for about two thirds of these sales. Due to women contributing to a majority of sales in the fashion retail industry, about fifty percent of sales are derived from women’s clothing. Men’s clothing contributes to about twenty percent of retail sales, leaving children’s clothing to make up the last ten percent of fashion retail sales. Products in this industry range from shoes, cosmetics, and undergarments to luxury designer handbags. Apparel companies were presumably wholesalers and sold their products to retailers, but nowadays apparel companies operate as a retailer and wholesaler. The fashion retail industry is very profitable due to new trends always appearing in fashion and a large demand to buy these trends at various prices. Selling apparel is exceedingly seasonal, and requires a majority of retailers to launch new season styles that are compatible with current trends. A new shift in fashion retail is shifting towards e-commerce, encouraging more retail stores to develop apps and improve their online website to attract more customers while improving upon the online shopping experience. Industry Overview The Fashion Retail Industry
  • 3. Lorem Ipsum Dolor Issue #, Date 3 Financial AnalysisSales Nordstrom has managed to continuously increase their net sales, going from $11,762 million in 2012 to $13,110 million in the fiscal year ending in 2104. Although a majority of net sales are attributed to Nordstrom’s full-line stores in the U.S., the comparable sales growth and net sales for full-line stores have decreased in the past two and three years respectfully (refer to table 1). As Nordstrom shoppers are changing their shopping preferences to online, Nordstrom.com, Nordstromrack.com and Hautelook have maintained a comparable sales growth larger than 20% in the past three years. As a large portion of U.S. shoppers have focused their attention towards discounted merchandise, Nordstrom Rack stores, Nordstromrack.com and Hautelook have experienced continuous increases in their sales. In 2014, 27% of sales were attributed to Nordstrom, Inc.’s discounted fashion merchandise segment (refer to table 2). If Nordstrom full-line stores are successful in Canada, there will probably be an increase in Nordstrom’s full-line comparable store sales by about four percent, and significantly increase Nordstrom’s overall value and its stock price. However in the U.S. the fashion retail segment Nordstrom full-line stores compete in what seems to be, a quite saturated market, and in five years or so I project that only one Nordstrom full-line stores will open every other year, if that. Within the next five years I predict that the discount segment of Nordstrom will account for about 40% of all net sales due to opening of 29 more Nordstrom Rack stores in the next few years. Nordstrom has spent over $864 million in capital expenditures during 2014 for its expansion plan and plans to spend about $1,270 million in capital expenditures in the next five years. I can see at least a ten-dollar increase in Nordstrom’s stock price within the next seven years if its expansion plan is successful, their discount segment continues to increase its net sales and Nordstrom continues to expand on its variety of merchandise available to customers online and in stores. Fiscal year2014 2013 2012 Nordstrom full-line stores - U.S.$7,682 $7,705$7,964 Nordstrom.com1,996 1,6221,269Nordstrom9,678 9,327 9,233Nordstrom Rack3,215 2,738 2,445Nordstromrack.com and HauteLook360 295 236 Nordstrom vs. Competitors *(chart 1) ) Comparable sales increase (decrease) by channel2: 2014 2013 2012 Nordstrom full-line stores - U.S. (0.5% ) (2.1 % ) 3.9 % Nordstrom.com 23.1 % 29.5 % 37.1 % Nordstrom 3.6 % 2.3 % 7.5 % Nordstrom Rack 3.8 % 2.7 % 7.4 % Nordstromrack.com and HauteLook 22.1 % 27.3 % — *(table 1) At over one hundred years old, Nordstrom, Inc. has managed to flourish into a nationwide top selling fashion retail store. Over the past five years, Nordstrom managed to have a 24% return on capital. Nordstrom does not compromise quality, selection, or value when it comes to the products it sells. Nordstrom aims to target higher-end customers who can afford more luxurious brand-name items, leaving the lower-end retail stores to compete for sales. Nordstrom had sales of $13.11 billion in 2014, a 9.3% increase from the previous fiscal year. Ranked number 204 out of 500 on Forbes 50 a year ago, Nordstrom has earned significant recognition throughout the fashion retail industry in numerous magazine and magazines. Nordstrom is now rated number nine most visited online fashion retail website with the acquisition of Hautelook and Trunk Club, when just over three years ago Nordstrom was ranked 19. Nordstrom also differentiates itself from competitors in its ability to appeal to all audiences, even those who suffer from disabilities. Nordstrom features famous bloggers and athletes that may have missing limbs and disabilities to communicate its support for all community members. Nordstrom maintains a strong lead in the fashion retail industry as it was ranked within the top two positions for its selection of merchandise, on how environmentally conscious it is, and its demonstration of customization of services for its customers. Nordstrom placed fourth for its overall store operations (see chart 1). Dillard’s, Bloomingdale’s, Saks Fifth Avenue, Neiman Marcus and Macy’s are among the top competitors of Nordstrom. Nordstrom is unique in that it has a discount store and online website that sells last season’s clothes, which have significantly increased sales for Nordstrom. In 2014, Neiman Marcus had revenues of $4.48 billion and Nordstrom had revenues of $13.51 billion while Bloomingdales had revenues of $1.072 billion. Financially Nordstrom surpasses its competitors and is projected to have growth in revenues and sales in the upcoming years. In 2014, Nordstrom outperformed the industry average. Nordstrom’s revenues came to a total of $13.51 billion, which was significantly higher than the industry average of $423.66 million. Nordstrom, Inc. also outperformed Neiman Marcus, when Neiman Marcus had revenues of $4.84 billion and a net income of -$147.20 million while Nordstrom had a net income of $720 million. Nordstrom, Inc. is planning on deriving about half of their sales from its website, Hautelook and The Rack combined over the next five years. Nordstrom is also teaming up with Like2Buy, which allows customers to purchase their items through their Instagram page, and Twilio, which is a new app that allows salespeople to text Nordstrom customers about new merchandise that may appeal to the customer. *(table 2) Nordstrom’s Position in the Industry Nordstrom’s Competition
  • 4. Lorem Ipsum Dolor Issue #, Date 4 Inventory Turnover In respect to competitors Macy’s, TJX, Dillard’s and J.C. Penney, Nordstrom is one of the top performing retailers in the fashion retail industry. In the high end of fashion retailing, Nordstrom overall outperforms all of its competitors. In the fiscal year of 2014, Nordstrom had an inventory turnover of 5.15, once about every two and a half months while Macy’s and Dillard’s had an inventory turnover rate of 3.08 and 3.14 respectfully, once about every four months (refer to table 3). Nordstrom has spent millions of dollars investing and researching to offer products its customers desire, and has continued to expand the variety of its merchandise in order to please more customers. However, looking at Nordstrom’s historical turnover rate, it has steadily declined from 6.29 in 2011 to 5.15 in 2015 as a result from rapid expansion and a wider variety of products. It is reasonable to expect the turnover rate to drop to about 4.6. to 4.8 over the next few years as more Nordstrom Rack stores open and Nordstrom full- line stores are to open in Canada, a country which the merchandise offered hasn’t be completely tailored to the customer’s preferences yet. However, even with a drop in inventory turnover, Nordstrom still has the highest inventory turnover in the higher-end of fashion retailing. On the other hand, TJX has a large inventory turnover rate of 6.72, which is about once every month and a half, while J.C. Penney has the lowest inventory turnover of 2.86, less than once every four months. Nordstrom’s main competitors in the discount segment of the retail industry are stores such as Marshall’s and TJ Maxx (part of TJX). Although Nordstrom’s inventory turnover is lower, they offer a wider and larger selection of designed discounted clothing, since a majority of the clothing comes from Nordstrom full-line stores. Comparable Sales Nordstrom outperforms all of its competitors (those in table 3), except J.C. Penney, which has comparable sales increase of .4% more than Nordstrom. Nordstrom’s comparable sales, also referred to as same-store sales, increase is mostly due to the high comparable sales increase of Nordstrom.com, Nordstromrack.com and Hautelook.com (refer to table 2). The comparable sales should increase two to four percent during 2015 due expansion into Canada and throughout the U.S, remodeling of stores, and a third fulfillment center that will be opened later this year to process online orders faster, especially for customers of the east coast. I expect Nordstrom’s comparable sales to hover around six percent the next few years as the fulfillment center opens as well as other stores. Sales per square foot NordstromMacy’sTJXDillard’s J.C Penney Inventory Turnover Rate5.15 3.086.723.142.86Comparable Sales Increase4.0%1.4%3.0%1%4.4%Sales per Square Foot$493$158 $300$131$113 EBT (% of sales)8.778.512.217.53-6.10 20142013201220112011Comparable sales increase4%2.5%7.3%7.2%8.1%EBIT % of sales 10.1%11.1%11.4%11.9%12%Sales per square foot$493$474$470$431$397Inventory turnover rate5.155.355.936.206.29 20142013201220112011Comparable sales increase4%2.5%7.3%7.2%8.1%EBIT % of sales 10.1%11.1%11.4%11.9%12%Sales per square foot$493$474$470$431$397Inventory turnover rate5.155.355.936.206.29 Nordstrom, Inc. has the largest sales per square foot at $493 in 2014, while Macy’s, Dillard’s, J.C Penney all had sales from $113 to $158, all a third or less of Nordstrom’s ratio. Nordstrom Rack stores had sales per square foot of $552 while TJ Maxx and Marshall’s average about $304 at the end 2014. I expect Nordstrom to continue to have high sales per square foot since its merchandise is more expensive and does a great job at offering a vast variety of merchandise that appeals to a wider audience of discount shoppers. Mentioned earlier, one of Nordstrom’s strong suit is offering designer prices at discounted prices for thriftier shoppers while offering unique and more luxurious clothing for those shoppers with a more flexible budget. From 2011 to 2014, Nordstrom has managed to increase their sales per square foot from $397 to $493, about a 20% increase (refer to table 4). It is reasonable to project sales per square foot to be around $515 or more for the next few years as Nordstrom continues to expand into Canada and Nordstrom Racks stores continue to open. 2014 2013 2012 2011 2011 Comparabl e sales increase 4% 2.5% 7.3% 7.2% 8.1% EBIT % of sales 10.1 % 11.1 % 11.4 % 11.9 % 12% Sales per square foot $493 $474 $470 $431 $397 Inventory turnover rate 5.15 5.35 5.93 6.20 6.29 * (Table 3 –ratios are in respect to the fiscal year ended in 2014) EBT (% of sales) Nordstrom’s EBT of 8.77% is higher than every competitor except TJX, which has an EBT of 12.21%. Nordstrom’s EBT is lower than expected in 2014 due an increase of $316 million in general and administrative expenses from $3,272 million in 2013 to $3,588 million in 2014. Nordstrom’s expenses are especially high right now since they just acquired Trunk Club, are heavily investing in technology right now, and are rapidly expanding. After the next five years, when Nordstrom’s expansion plans are almost finished, the EBT will increase once again around 11% to 12%. *(Table 4- Nordstrom’s Ratios)
  • 5. Lorem Ipsum Dolor Issue #, Date 5 Key investment risks • Expansion into Canada • Median expected age is expected to be 38 to 40 • Higher online shopping preferences • New acquisitions and partnerships that could negatively impact core business • Technology and investments fail to perform as expected/poorly implemented A major setback that could hurt Nordstrom, Inc. is its expansion into Canada. Although there is not much of a language barrier from U.S. to Canada, there is a significant variance in government regulations, employee benefits, and supply chain. In addition, Nordstrom full-line stores may not collect as much sales as planned due to higher tax rates Canadians have to pay on top of the expensive merchandise at Nordstrom full-line stores. Due to the products being more expensive to purchase in Canada than the U.S., customers may potentially buy less merchandise and respond to such prices with negative feedback. Nordstrom, Inc. plans to lose around $60 million before interest and taxes in Canada in 2015, an 88% increase from 2014. Nordstrom full-line stores may struggle with sustaining sales and profits for the first few years of operating in Canada. Another concern that arises when investing in Nordstrom, Inc. is the declining population among the age of fifty year olds. Nordstrom, Inc. has been opening one to two full-line stores a year for about the past decade, and this growth may subside to about one store every year or every other year as the projected median age will be 38 to 40 years of age until 2030. Within the last three years, six Nordstrom full-line stores have been closed with three of its closures being more recent in 2014. Generation X and the baby boomers still value the “touch and feel” aspect to brick and mortar, however the younger generations such as the millennials prefer to buy merchandise from online. Sales of Nordstrom’s full-line stores could potentially face a downward trend in its sales, as its target market of age 50 decreases, resulting in the overall value of brick and mortar to weaken. As Nordstrom’s shoppers are shifting their preferences to online shopping, Nordstrom faces pressure to keep up with the advancement in technology in order to compete with other online retailers. Heavy investments in RD are upon one of the many necessities Nordstrom must do in order to improve upon the online shopping experience for its customers and maintain its online retail sales. However, if new systems are not implemented correctly, this will result in a loss of online sales and decrease in customer satisfaction. A loss in sales is also realized if investments do not go as planned, and underperform. Nordstrom, Inc. has reported that more customers are shifting their shopping preferences from in-store to online, which could potentially be a major concern. Retail e-commerce in the U.S. is projected to grow 9.5% a year from 2013 to 2017, from about $260 billion to $435 billion. As e- commerce continues to rapidly evolve, Nordstrom faces potential threats as the e-commerce environment become extremely competitive as more e- commerce retail stores appear. Currently 35% of Nordstrom’s capital expenditures are for technology, however this percentage will most likely increase about three to four percent in the upcoming years. Nordstrom’s capital expenditures are projected to jump from $803 billion in 2014 to $1136 by 2016. Nordstrom, Inc. may have a loyal customer base, but faces hefty projected RD expenses as more e-commerce fashion retailers join the market. If Nordstrom acquires companies that do not align with their strategic decisions and fail to benefit the overall company, significant losses can be realized. New partnerships that are formed also can severely hurt Nordstrom’s financials and their reputation. If a partner of Nordstrom fails to participate in morally acceptable behavior or is exploited for illegal activity, Nordstrom’s reputation can be sabotaged. Any relation to negative media attention will cause Nordstrom’s’ stock value to drop and consequently sales will also decrease. As Nordstrom’s shoppers are shifting their preferences to online shopping, Nordstrom faces pressure to keep up with advancement in technology. Nordstrom has spent billions of dollars in capital expenditures in order to discover new advancements in technology and strategies to increase customer satisfaction, especially for online shoppers. If implementation of new technology goes poorly, backlash from customers will occur, severely damaging sales. Valuation Analysis Nordstrom, Inc. stock is performing incredibly well as it has risen from $19.69 on May 20, 2009 to $74.71 on May 18, 2015. After evaluating Nordstrom by three different growth models, Nordstrom’s stock should be valued at $92.36. Discount Cash Flow Models Dividend Valuation Model: The dividend model projected prices hover around $28 to $35, which is significantly lower than the other two models’ projected values of Nordstrom’s stock, and the current stock price of $72.64. The cost of equity capital 8.8% used as the discount rate in the dividend model is RF + (ERM - RF) Beta which is equal to 4.5+(8.42 - 4.5)1.10 (refer to appendix for more information). The dividend model’s projection of Nordstrom’s stock price is severely undervalued, and it not a great estimator of Nordstrom’s price . The projected stock price for Nordstrom should be at minimum price of $80, but there are several factors that are not considered in the dividend growth equation. Nordstrom, Inc. has planned to buy back $1.323 billion of their stock back Investment Risks
  • 6. Multiples Approach P/E Approach The P/E approach, to arrive at Nordstrom’s stock price, is very close to the actual current stock price. The stock price according to the P/E approach is $78.85 and the closing price on June 8,2015 for Nordstrom’s stock was $73.16. The P/E approach is derived from estimating the future P/E ratio of Nordstrom, 19 and is multiplied by the forward EPS (analysts’ estimates of the forward EPS), 4.15. EPS have increased from $3.56 in 2012 to $3.71 in the fiscal year ending in 2014, which is an increase of about six percent, however with large expenses and capital expenditures due to Nordstrom’s expansion, EPS are lower than future EPS. A growth of about ten percent is more plausible when calculating future EPS since large capital expenditures for expansion will aid Nordstrom’s future revenues. EV/EBITDA The EV/EBITDA approach generated a price of $71.82, which is only a few dollars less than Nordstrom’s current stock price, but still undervalues it. The future EBITDA of $1,995.79 is derived from the 2014 EBITDA value of $1,831 million multiplied by a growth rate of nine percent. Nine percent is a logical multiplier since the six-year average annual increase in EBITDA is 9.8%, and Nordstrom will realize a higher EBITDA after opening more Nordstrom Rack stores along with its expansion of Nordstrom full-line stores in Canada. The future EBITDA value is then multiplied by the EV/EBITDA ratio of eight (average of EV/EBITDA ratio over the past six years). Best Estimate I think to most accurate estimator of the intrinsic price of Nordstrom, Inc.’s stock is a combination of the 2-stage and the 3-stage growth model of free cash flows to the firm. Weighting the two-stage at forty percent and the three-stage at sixty percent, the price of Nordstrom, Inc.’s stock should be ($84.03(.4)+ $97.92 (.6)) which is $92.36. The FCFF shows how much money the company has available to both debt and equity holders, and is more favorable than the FCFE since the debt levels fluctuate in Nordstrom, Inc.’s financial statements as they expand throughout the U.S. and Canada. The FCFE model includes the subtraction of capital expenditures because it is a drain on cash. However 43% of Nordstrom’s capital expenditures are expansionary, while 35% is used for technology. Expansionary and technology capital expenditures account for 78% of total expenditures, which should not be considered a drain on cash because this investment will significantly increase the sales and profit for Nordstrom, Inc. in the future. In addition, the multiple approach of the P/E ratio does not seem a good fit in determining the correct value for Nordstrom’s stock due to the abnormal P/E growth of 15.05 to 21.25 from 2012 to 2014. A majority of larger companies have a P/E that hovers around 11 to 13, and Nordstrom’s P/E ratio is unusually large at 21.25. Dividend Model FCFF FCFE Constant Growth $28.84 $58.70 $74.23 2-Stage $34.34 $84.03 $95.04 3-Stage $32.84 $97.92 $107.75 by 2016, about nine percent of their shares, which should increase the stock price by at least three percent. Also, the dividend valuation model fails to acknowledge that Nordstrom’s dividends have increased almost every year, and at time more than a $.10 a year, making it difficult to forecast a value from dividends that are constantly growing. Free Cash Flows to the Firm: The FCFF model is the best predictor of Nordstrom’s stock value (see table 5), as it generates a more realistic outlook on Nordstrom’s stock compared to the dividend valuation model. The weighted average cost of capital equation used for the discount rate in the FCFF model is calculated as: (We * Ke +Wd *[kd (1-T)]) , which are (.79*8.81%)+.21(3.04%(1-.3924)). The free cash flows to the firm for Nordstrom have steadily declined from 2010 to 2014 and have an overall annual growth rate of -2.5%. Prices generated from the FCFF model are $58.70, $84.03, and $97.92 in respect to the constant growth, two-stage growth and three-stage growth model. The equation below is used to arrive at the FCFF prices: FCFF0/ (WACC-g)- MVD + Cash ,which is $2.84/(7.35%-3.50%)-$19.44+$4.34) (see appendix for more information). Free Cash flow to Equity: The FCFE model projection of Nordstrom’ stock prices are on average about twelve dollars higher than projections of Nordstrom’s prices from the FCFF model (refer to graph 1). The estimated values of Nordstrom’s stock are $75.58, $95.04, and $107.75 in respect to the constant, two-stage and three-stage growth model for the free cash flow to equity model. The values in the equation for the FCFE model (FCFE1/( k-g) + Cash) are $2.691/(7.59%-3.50%)+$4.34. The FCFE model has the same growth rates and time horizon of growth due to the similarities in EBIT and EAT over the past few years. *(Table 5)
  • 7. Appendix Dividend Valuation Model: The growth rate used for the Constant Growth Dividend Model is 3.5%, the average GDP growth. The Value Line shows a significant increase in annual dividends declared; from 2002 to 2008 the annual dividends per share have increased from $0.19 to $0.64, about a 30% increase. Since 2009, the annual dividends declared per share continued to increase more than a dime each year, increasing from $0.64 in 2009 to $1.32 in 2014 with an average annual growth of 9.70%. Nordstrom continues to reveal plans on opening Nordstrom Rack stores and Nordstrom full-line stores, increasing future cash flows, and overall increasing the dividends to shareholders. The projected price of Nordstrom’s stock in this model is $28.84. In the 2-Stage Growth Model for the dividend model, N is realistically close to seven years, with a first stage growth of 8.5% and the second stage of growth to be five percent. Nordstrom, Inc. has released information stating that they aim to open about one hundred more Nordstrom Rack stores by 2020, and about one to two Nordstrom full-line stores each year. Cash flows will increase significantly in this time since stores will be opening continuously throughout the next five years, bring in millions of dollars in sales throughout this time, with a vast amount of cash being realized in the years following the opening of stores. In addition, the Value Line projects future annual dividends to grow annually of an average of 9.5% until 2019, which seems to be a more optimistic projection. The second growth of 3.5% percent is the same as the growth of the constant growth dividend model. The two-stage growth model generated Nordstrom’s stock price to be $34.34. In the 3-Stage Growth Model, the first growth’s duration is four years as it grows at 12%. As mentioned previously, Nordstrom is planning to open 100 more Rack stores of their discount stores within the next five years in the U.S. In addition, four of their full-line Nordstrom stores are planned to open by 2017 in Canada, which will contribute to a significant increase in sales in the upcoming four years. In the past ten years dividends have grown 18.5% and are projected to grow 9.5%, averaging out to 14%, making 12% a realistic growth for the next four years. The following growth of seven years, as in the previous model, is plausible to grow at 7.5%. I arrived at 7.5% for the second annual growth rate since it is less than the growth in the previous model, 8.5%, yet is larger than the third growth rate of 3.5%. The seven years following the first growth will have a smaller growth in sales. Nordstrom will most likely take time to listen to customer demands in Canada and learn more about the demographics in Canada before expanding more in the country. In addition, Nordstrom Rack openings may subside quite a bit, to prevent the issue of over-expanding too rapidly. The three-stage growth model for Nordstrom’s stock price is $32.84, less than the two-stage growth model. Free Cash Flows to the Firm Valuation Model: In addition to the dividend model, 3.50% was used as the continuous growth rate for the FCFF model. The average of the average growth rates of FCFF from 2009 to 2015 was 8.5%, but this included wide fluctuations in the average growth rates, -36% to 63.1%. The growth rate of 3.5% was used because it is more plausible Nordstrom will grow at the GDP rate, and not any quicker, especially due to the saturation of higher-end fashion retail market in the U.S. The price generated from the FCFF constant growth model is $58.66. In the 2-Stage Growth Model for FCFF the first growth portion has a time horizon of six years at a growth rate of 8.5%. According to the Value Line over the next five to six years earnings, cash flow, and sales are projected to grow at a minimum of eight percent to approximately nine percent. The average of these projected growths came to 8.5%, a valid reason of using this percentage as the first growth rate. In addition, EAT EBIT had close averages of annual growths at 10.3% and 9.7% respectfully. Also, the average increase in capital expenditures from 2009 to 2014, less the difference from 2012 to 2013, was close to 11%. As the averages in various aspects that make up FCFF hover near 8.5% to 11%, a growth of 8.5% as the first growth rate in the 2-Stage Model is a valid prediction. For the reasons mentioned earlier, the second growth in the 2-Stage Model for the FCFF model is 3.50%. The price in the 2-Stage Growth Model for FCFF is $84.03. The 3-Stage Growth Model growth grates for the first portion of growth, six years and second portion of growth, three years, are 9.50% and 7% respectfully, with 3.50% as the constant growth. During the next six years Nordstrom, Inc. is quite busy expanding their stores throughout the U.S. and Canada. In addition, Nordstrom may acquire other clothing businesses and online sites in the future, providing more profit and sales for Nordstrom, Inc. However, Nordstrom, Inc. may slow down their opening of stores in Canada, as they look further into the demographics and ideal locations in Canada. After the first six years, capital expenditures related to expansion are likely to decrease, leading to a reduction in future cash flows, reducing the EBIT and EAT. The stock price for Nordstrom in this growth model is $97.92. Free Cash Flows to Equity Valuation Model: Used in the previous two models, the constant growth rate used for the FCFE model is 3.50%. In the FCFE model, the FCFE were extremely volatile, especially from 2010 to 2011 where the FCFE increased by 1,214, a 157.3% increase. The average of the average growth rates of FCFE was 9.1%, which is too high to be the continuous growth rate, and it is more plausible to be 5.50%. Generally five percent would be the highest constant growth considered, but Nordstrom’s position in the retail industry and future growth in Canada and in the U.S. proves that Nordstrom has a bright future and will continue to be a strong leader in the fashion retail industry. The price for Nordstrom’s stock in this growth model is $74.23. In the two-stage growth model of FCFE, the growth rate for the first six years is 8.5%, and the constant growth rate after this time period is 3.50%. The FCFE has the same time period and growth rates as the FCFF because both models involve a majority of the same financials aspects. Nordstrom’s stock price is $95.04 in this growth model. In the three -stage growth model of FCFF the growth rates were 9.5%, 7.0% and 3.50% in respect to the time horizons of six years, three years, and forever. As mentioned earlier, the 9.5% seemed logical for the next six years because by 2021, at least one hundred Nordstrom Rack stores will be opened throughout the U.S, six Nordstrom stores will be opened in Canada, and Nordstrom is able to acquire other smaller clothing businesses that will benefit the corporation. After 2021 Nordstrom’s sales may decrease a bit if there is a mishap in the Nordstrom full-line stores in Canada, plus six Nordstrom full-line stores have closed down in the past three years, and more could close down. The price generated from this model was $107.75.
  • 8. Cost Of Equity Capital: The equation of cost of equity capital is: Risk Free Rate + (Expected Return on the Market – Risk Free Rate) *Beta For the cost of equity capital, the Current Expectations Approach was more applicable and realistic. The market is still growing at a slower and steady pace after the recession hit the U.S. a little over half of a decade ago, and is unlikely progress at a faster pace. The risk-free rate is used in this equation is 4.5%, which is the SP500 geometric average of stock and T-bills from 1928-2014. The return on equity was 9.12% using the Historic Approach, versus 8.812% using the Current Expectations Approach. For the expected return on the market of the ten-year time horizon of 2014 to 2023, I chose 8.42%, which expects the SP500 earnings to grow about six percent and the P/E ratio to decrease about 2.48% a year. The MRP using the historic approach is 4.2% and the market risk premium that is more realistic is 3.92%, which is the current expectations approach. The market’s risk premium is closer to 3.92% because interest rates are practically zero and major corporations in the SP500 are still recovering from the recession in 2008 and are engaging in ways to sustain a healthy growth, reducing the market risk. The Historic Approach is not as appealing to me because the history in market risk premium is the average of the past one ten decades, which is not a great indicator of how the future market will be in the next ten years. 4.5 + (8.42 - 4.5) 1.10 = 8.81% Weighted Average Cost of Capital: WACC Calculations: Debt + Equity $17,631 Debt Component Long Term Debt $3,693 Current portion of Long Term Debt $8.00 Total Debt $3,701 Pre-Tax Cost of LT Debt 3.04% Effective Tax Rate 39.24% Weight of Debt 21% Equity Component Market Capitalization $13,930 Risk Free Rate 4.50% (*85 year average of t-bills and t-bonds) Adjusted Beta 1.10 (*Value-Line Beta) Market Risk Premium 3.92% Weight of Equity 79% Cost of Equity Capital 8.81% WACC= Weight of Equity * Cost of Equity Capital + (Weight of Debt * [Pretax Cost of Debt (1-Corpotate Tax Rate)] (.79% * 8.81%) + 21% (3.04%(1- 5.60%)) =7.36%