SlideShare una empresa de Scribd logo
1 de 104
Descargar para leer sin conexión
Master of Science Thesis
Wake Dynamics Study of an H-type Vertical
Axis Wind Turbine
Chenguang He
August 12, 2013
Faculty of Aerospace Engineering · Delft University of Technology
Wake Dynamics Study of an H-type Vertical
Axis Wind Turbine
Master of Science Thesis
For obtaining the degree of Master of Science in Aerospace Engineering
at Delft University of Technology
Chenguang He
August 12, 2013
Faculty of Aerospace Engineering · Delft University of Technology
Copyright c Chenguang He
All rights reserved.
Delft University Of Technology
Department Of
Aerodynamics and Wind Energy
The undersigned hereby certify that they have read and recommend to the Faculty of Aerospace
Engineering for acceptance a thesis entitled “Wake Dynamics Study of an H-type Vertical
Axis Wind Turbine” by Chenguang He in partial fulfillment of the requirements for the
degree of Master of Science.
Dated: August 12, 2013
Head of department:
Prof. dr. G.J.W. van Bussel
Supervisor:
Dr. ir. C.J. Simao Ferreira
Reader:
Dr. Daniele Ragni
Reader:
Dr. Marios Kotsonis
Summary
Recent developments in wind energy have identified vertical axis wind turbines as a favored
candidate for megawatt-scale offshore systems. Compared with the direct horizontal axis
competitors they poss higher potentials for scalability and mechanical simplicity.
The wake dynamics of an H-type vertical axis wind turbine is investigated using Particle Image
Velocimetry (PIV). The experiments are conducted in an open jet wind tunnel with a turbine
model of 1 m diameter constituted of 2 straight blades generated from a NACA0018. The
turbine model is operated at a tip speed ratio of 4.5 and at a maximum chord Reynolds of
210,000. Two-component planar PIV measurements at the mid-span plane focus on vorticity
shedding and horizontal wake expansion. Stereoscopic PIV measurements at 7 cross-stream
vertical planes are performed to study tip vortex dynamics and evolution of 3D wake structures.
Measurement at the turbine mid-span plane shows that the roll-up of shed vortex is triggered
by wake interactions. Vorticity decay is asymmetrical with the faster decay rate at the leeward
side. The faster windward wake expansion is attributed to the windward deflection of the
tower wake. Wake recovery has not been observed in the horizontal measurement plane up
to 4R downstream of the rotor.
Experimental results on the vertical planes show that the tip vortex is stronger than the shed
vortex in the horizontal plane. The strongest tip vortex is produced near the turbine axial
plane (y/R = 0), and the in-rotor vorticity decay accounts for 60% - 90% of the overall decay.
Near y/R = 0, tip vortices move inboard behind the rotor, whereas the turbine tower and
the horizontal struts obstruct the inboard motion within the rotor swept volume. The rate
of inboard motion is proportional to the vorticity strength. Due to weak vortex strength and
strong blade blockage, tip vortices move outboard at two sides of the rotor primarily towards
the windward side. Roll-over of vortex pairs contributes to the breakdown of vortical structure
behind the rotor. Vertical wake recovery begins 4R downstream of the rotor, and the fastest
recovery is observed near y/R = 0.
v
Acknowledgements
Hereby, I would express my sincere gratitude to my supervisor Dr. Carlos Sim˜ao Ferreira for
your continuous support and encouragement throughout the project. Also I would like to
thank my daily supervisors Dr. Daniele Ragni, Giuseppe Tescione and Dr. Artur Palha. Your
guidances and supports were vital to the success of this project. Thanks Prof. Fulvio Scarano
for your valuable suggestions on my thesis work. I would also like to thank the members of
my graduation committee, Prof. Gerard van Bussel and Dr. Marios Kotsonis for your helpful
advice and suggestions in general.
Thanks to my office roommates, Chidam, Lento, Mark, Rob for the laugh we shared in the past
ten months. And thanks to all my Chinese and International friends for being the surrogate
family during my five years of stay in Holland, and making me feel at home thousands miles
away from China.
Finally a sincere thanks to my girlfriend Nuo, and my families. Without your understanding,
great patience and endless love I would not be able to accomplish all these.
vii
Contents
List of Figures xii
List of Tables xiii
Nomenclature xv
1 Project Outline 1
2 Vertical Axis Wind Turbine - A Brief Introduction 3
2.1 VAWT vs. HAWT . . . . . . . . . . . . . . . . . . . . . . . . . . . . . . . . 5
3 Fundamental Aspects of VAWT Wake Aerodynamics 7
3.1 Definitions and Notations . . . . . . . . . . . . . . . . . . . . . . . . . . . . 7
3.2 Generation of Vorticity . . . . . . . . . . . . . . . . . . . . . . . . . . . . . 9
3.3 Vorticity and Energy Considerations . . . . . . . . . . . . . . . . . . . . . . 11
4 Particle Image Velocimetry 13
4.1 Fundamentals of 2C-PIV . . . . . . . . . . . . . . . . . . . . . . . . . . . . 13
4.2 Stereoscopic PIV (SPIV) . . . . . . . . . . . . . . . . . . . . . . . . . . . . 15
4.2.1 Working principle . . . . . . . . . . . . . . . . . . . . . . . . . . . . 15
4.2.2 Translational and rotational configurations . . . . . . . . . . . . . . . 16
4.2.3 Image reconstruction . . . . . . . . . . . . . . . . . . . . . . . . . . 18
5 Experimental Set-up and Image Processing 19
5.1 Wind Tunnel . . . . . . . . . . . . . . . . . . . . . . . . . . . . . . . . . . . 19
5.2 Turbine Model . . . . . . . . . . . . . . . . . . . . . . . . . . . . . . . . . . 20
5.3 Operational Conditions . . . . . . . . . . . . . . . . . . . . . . . . . . . . . 20
5.4 PIV Equipment . . . . . . . . . . . . . . . . . . . . . . . . . . . . . . . . . 21
5.5 PIV Set-up . . . . . . . . . . . . . . . . . . . . . . . . . . . . . . . . . . . . 21
5.6 System of Reference and Field of View . . . . . . . . . . . . . . . . . . . . . 23
5.7 Image Processing . . . . . . . . . . . . . . . . . . . . . . . . . . . . . . . . 24
ix
x Contents
6 2D Wake Dynamics 27
6.1 Experimental Results . . . . . . . . . . . . . . . . . . . . . . . . . . . . . . 27
6.2 Simulation Results . . . . . . . . . . . . . . . . . . . . . . . . . . . . . . . . 29
6.3 In-rotor Vorticity Shedding . . . . . . . . . . . . . . . . . . . . . . . . . . . 29
6.3.1 Evaluation method . . . . . . . . . . . . . . . . . . . . . . . . . . . 29
6.3.2 On path tracking of wake circulation . . . . . . . . . . . . . . . . . . 32
6.4 Blade-wake and Wake-wake Interaction . . . . . . . . . . . . . . . . . . . . . 34
6.5 Vortex Dynamics Along the Wake Boundary . . . . . . . . . . . . . . . . . . 36
6.5.1 Determination of vortex core position and peak vorticity . . . . . . . 36
6.5.2 Vortex trajectory and vortex pitch distance . . . . . . . . . . . . . . . 38
6.5.3 Evolution of peak vorticity . . . . . . . . . . . . . . . . . . . . . . . 39
6.6 Wake Circulation . . . . . . . . . . . . . . . . . . . . . . . . . . . . . . . . 40
6.7 Wake Geometry . . . . . . . . . . . . . . . . . . . . . . . . . . . . . . . . . 41
6.8 Induction and Wake Velocity Profile . . . . . . . . . . . . . . . . . . . . . . 43
6.8.1 Stream-wise velocity profiles . . . . . . . . . . . . . . . . . . . . . . 43
6.8.2 Cross-stream velocity profiles . . . . . . . . . . . . . . . . . . . . . . 45
7 3D Wake Dynamics 47
7.1 Experimental Results . . . . . . . . . . . . . . . . . . . . . . . . . . . . . . 47
7.2 Tip Vortex Dynamics . . . . . . . . . . . . . . . . . . . . . . . . . . . . . . 53
7.2.1 Azimuthal variation of tip vortex circulation . . . . . . . . . . . . . . 53
7.2.2 Determination of tip vortex core position and peak vorticity . . . . . 56
7.2.3 Tip vortex motions in the xz-plane . . . . . . . . . . . . . . . . . . . 57
7.2.4 Stream-wise evolution of tip vorticity . . . . . . . . . . . . . . . . . . 60
7.3 3D Wake Geometry . . . . . . . . . . . . . . . . . . . . . . . . . . . . . . . 63
7.3.1 Wake geometry in the xy-plane . . . . . . . . . . . . . . . . . . . . . 63
7.3.2 Wake geometry in the yz-plane . . . . . . . . . . . . . . . . . . . . . 63
7.4 Stream-wise Wake Velocity Profiles . . . . . . . . . . . . . . . . . . . . . . . 63
8 Uncertainty Analysis 67
8.1 Free-stream Velocity . . . . . . . . . . . . . . . . . . . . . . . . . . . . . . . 68
8.2 Model Uncertainty . . . . . . . . . . . . . . . . . . . . . . . . . . . . . . . . 69
8.2.1 Model imperfections . . . . . . . . . . . . . . . . . . . . . . . . . . . 69
8.2.2 Operational conditions . . . . . . . . . . . . . . . . . . . . . . . . . 70
8.3 Measurement Uncertainty . . . . . . . . . . . . . . . . . . . . . . . . . . . . 71
8.4 Data Processing . . . . . . . . . . . . . . . . . . . . . . . . . . . . . . . . . 72
9 Conclusions and Recommendations 73
9.1 Conclusions . . . . . . . . . . . . . . . . . . . . . . . . . . . . . . . . . . . 73
9.1.1 2D wake dynamics . . . . . . . . . . . . . . . . . . . . . . . . . . . 73
9.1.2 3D wake dynamics . . . . . . . . . . . . . . . . . . . . . . . . . . . 74
9.2 Recommendations . . . . . . . . . . . . . . . . . . . . . . . . . . . . . . . . 75
References 77
A Image stitching Function 81
List of Figures
2.1 Examples of VAWT . . . . . . . . . . . . . . . . . . . . . . . . . . . . . . . 4
3.1 Schematic of 2D VAWT division . . . . . . . . . . . . . . . . . . . . . . . . 8
3.2 CP -TSR diagram . . . . . . . . . . . . . . . . . . . . . . . . . . . . . . . . 9
3.3 Free body diagram of inflow vector . . . . . . . . . . . . . . . . . . . . . . . 9
3.4 2D characteristics, without induction . . . . . . . . . . . . . . . . . . . . . . 10
3.5 2D characteristics, with induction . . . . . . . . . . . . . . . . . . . . . . . 11
3.6 Schematic of tip vortex release along blade trajectory . . . . . . . . . . . . . 12
3.7 Schematics of wake vortex sheets . . . . . . . . . . . . . . . . . . . . . . . . 12
4.1 Schematics of PIV set-up [35] . . . . . . . . . . . . . . . . . . . . . . . . . . 14
4.2 Multi-pass vs. single-pass . . . . . . . . . . . . . . . . . . . . . . . . . . . . 15
4.3 Schematics of stereo camera arrangement . . . . . . . . . . . . . . . . . . . 16
4.4 Configurations PIV systems [31] . . . . . . . . . . . . . . . . . . . . . . . . 17
4.5 Effect of Scheimpflug adapter [1] . . . . . . . . . . . . . . . . . . . . . . . . 17
4.6 Multi-level Calibration Plate [32] . . . . . . . . . . . . . . . . . . . . . . . . 18
5.1 Schematics of OJF [3] . . . . . . . . . . . . . . . . . . . . . . . . . . . . . . 19
5.2 Lift characteristics of the airfoil . . . . . . . . . . . . . . . . . . . . . . . . . 20
5.3 Configuration of horizontal measurements . . . . . . . . . . . . . . . . . . . 22
5.4 Configuration of vertical measurements . . . . . . . . . . . . . . . . . . . . . 22
5.5 Schematics of measurement windows of horizontal plane . . . . . . . . . . . 23
5.6 Schematics of measurement windows of vertical planes . . . . . . . . . . . . 24
5.7 Example of raw images and processed image . . . . . . . . . . . . . . . . . . 25
6.1 Contour of wake velocity and wake vorticity, 2D phase-locked experimental
results . . . . . . . . . . . . . . . . . . . . . . . . . . . . . . . . . . . . . . 28
6.2 Contour of wake velocity and wake vorticity, 2D phase-locked simulation results 30
6.3 Change of bound circulation vs. vorticity shedding . . . . . . . . . . . . . . . 31
6.4 Schematics of integration window . . . . . . . . . . . . . . . . . . . . . . . . 31
6.5 Sensitivity analysis of box length . . . . . . . . . . . . . . . . . . . . . . . . 32
xi
xii List of Figures
6.6 On path circulation tracking . . . . . . . . . . . . . . . . . . . . . . . . . . 32
6.7 Maximum circulation position . . . . . . . . . . . . . . . . . . . . . . . . . . 33
6.8 Illustration of Blade-Wake Interaction . . . . . . . . . . . . . . . . . . . . . 35
6.9 Vorticity strengthening due to wake-wake interaction . . . . . . . . . . . . . 35
6.10 Velocity distribution at vortex core . . . . . . . . . . . . . . . . . . . . . . . 36
6.11 Vorticity distribution at vortex core . . . . . . . . . . . . . . . . . . . . . . . 37
6.12 Schematics of vortex core center . . . . . . . . . . . . . . . . . . . . . . . . 38
6.13 Vortex pitch . . . . . . . . . . . . . . . . . . . . . . . . . . . . . . . . . . . 39
6.14 RMS of absolute velocity . . . . . . . . . . . . . . . . . . . . . . . . . . . . 39
6.15 Peak vorticity distribution . . . . . . . . . . . . . . . . . . . . . . . . . . . . 40
6.16 Wake circulation . . . . . . . . . . . . . . . . . . . . . . . . . . . . . . . . . 41
6.17 Schematics of the wake geometry . . . . . . . . . . . . . . . . . . . . . . . . 42
6.18 Wake geometry . . . . . . . . . . . . . . . . . . . . . . . . . . . . . . . . . 43
6.19 Phase-locked stream-wise velocity profile . . . . . . . . . . . . . . . . . . . . 44
6.20 Peak velocity deficit of horizontal mid-span plane . . . . . . . . . . . . . . . 44
6.21 Schematic of wake stream-wise velocity distribution . . . . . . . . . . . . . . 45
6.22 Schematics 3D induction due to tip vortex . . . . . . . . . . . . . . . . . . . 45
6.23 Simulated wake development until 16R downwind of the turbine . . . . . . . 46
6.24 Cross-stream velocity profile . . . . . . . . . . . . . . . . . . . . . . . . . . . 46
7.1 Contour of wake velocity and wake vorticity, 3D phase-locked experimental
results . . . . . . . . . . . . . . . . . . . . . . . . . . . . . . . . . . . . . . 51
7.2 Illustration of the influence of misalignment angle on uy . . . . . . . . . . . 52
7.3 Illustration of bound circulation of a skewed measurement plane . . . . . . . 53
7.4 Sensitivity analysis of the background cutoff criteria . . . . . . . . . . . . . . 55
7.5 Azimuthal variation of tip vortex strength . . . . . . . . . . . . . . . . . . . 56
7.6 Vorticity distribution at the vortex core . . . . . . . . . . . . . . . . . . . . . 57
7.7 Vorticity distribution away from the vortex core . . . . . . . . . . . . . . . . 57
7.8 Tip vortex trajectory in the xz-plane . . . . . . . . . . . . . . . . . . . . . . 58
7.9 Schematics of vortex inboard motion . . . . . . . . . . . . . . . . . . . . . . 59
7.10 Illustration of vortex pair roll-over, y/R = 0 . . . . . . . . . . . . . . . . . . 60
7.11 Stream-wise variation of tip vorticity . . . . . . . . . . . . . . . . . . . . . . 61
7.12 Decay of tip vorticity . . . . . . . . . . . . . . . . . . . . . . . . . . . . . . 61
7.13 Wake geometry in the xy-plane . . . . . . . . . . . . . . . . . . . . . . . . . 64
7.14 Wake geometry in the yz-plane . . . . . . . . . . . . . . . . . . . . . . . . . 64
7.15 Wake velocity profile in xy-plane . . . . . . . . . . . . . . . . . . . . . . . . 65
7.16 Peak velocity deficit of 3D vertical planes . . . . . . . . . . . . . . . . . . . 66
8.1 Convergence of the mean flow . . . . . . . . . . . . . . . . . . . . . . . . . 68
8.2 Schematic of blade deformation (exaggerated) . . . . . . . . . . . . . . . . . 70
A.1 Standard window alignment patterns . . . . . . . . . . . . . . . . . . . . . . 81
A.2 Possible window alignment patterns . . . . . . . . . . . . . . . . . . . . . . 82
A.3 Standard window alignment patterns . . . . . . . . . . . . . . . . . . . . . . 82
List of Tables
8.1 Uncertainty of image calibration . . . . . . . . . . . . . . . . . . . . . . . . 71
A.1 Converting operation to standard window alignment pattern . . . . . . . . . 83
xiii
Nomenclature
Latin Symbols
B Number of blade [-]
CPmax maximum power coefficient [-]
c Blade chord [m]
H Blade span [m]
N Number of samples [-]
p∞ Static pressure [pa]
R Rotor radius [m]
t0 Vortex core radius [m]
Rec Chord based Reynolds number [-]
Rconst specific gas constant [J/(kg·K)]
t Vortex age [s]
T Temperature [K]
u Velocity vector [m/s]
ub Blade velocity [m/s]
ures Local inflow velocity [m/s]
uv Vorticity sheet convective velocity [m/s]
u∞ Free-stream velocity [m/s]
w Width of vorticity sheet [m]
xv
xvi Nomenclature
Greek Symbols
α Angle of attack [rad]
Γ Blade circulation [m2/s]
˙γ Pitching rate [rad/s]
θ Blade azimuthal angle [deg]
λ Tip speed ratio [-]
ρ Density [kg/m3]
σ Blade solidity [-]
ψ Misalignment angle [rad]
ω Vorticity vector [1/s]
Acronyms
2D Two dimensional
3D Three dimensional
2C-PIV Two Components PIV
AoA Angle of Attack
BWI Blade-Wake Interaction
CFD Computational Fluid Dynamics
DUWIND Wind Energy Research Group
HAWT Horizontal Axis Wind Turbine
OJF Open Jet Facility
PTU Processing Time Unit
PIV Particle Image Velocimetry
SPIV Stereoscopic PIV
TSR Tip Speed Ratio
TU Delft Delft University of Technology
VAWT Vertical Axis Wind Turbine
WWI Wake-Wake Interaction
xvii
Chapter 1
Project Outline
The re-merging interests on Vertical Axis Wind Turbine (VAWT) for urban or off-shore appli-
cations require an improved understanding of rotor aerodynamics for performance optimization
and wind farm design. The present project investigated the wake development of an H-type
VAWT using Particle Image Velocimetry (PIV). Phase-locked flow properties were measured
at a fixed tip speed ratio of 4.5. Two types of PIV measurements were conducted: a two-
component planar PIV measurement at the horizontal mid-span plane, and a three-component
stereoscopic PIV measurement at vertical measurement planes (aligned with free-stream). The
study aims to:
• Identifying main characteristics of three dimensional (3D) wake development of an H-
type VAWT, both in detailed vortex scale and in global wake scale.
• Validating the two dimensional (2D) unsteady inviscid panel code using measurement
results at turbine mid-span plane.
Based on the obtained measurement data, detailed flow analyses were performed with the
focus on following aspects.
At horizontal mid-span plane:
• Circulation of wake vorticity sheets.
• Blade-wake interaction and wake-wake interaction, investigating the triggering mecha-
nism of vortical structures roll-up.
• Shed vortex dynamics along wake shear layer, focusing on vortex convective trajectory
and vorticity evolution.
• Wake geometry at mid-span position, with specific attention to asymmetrical wake
expansion.
• Induction field and stream-wise evolution of wake velocity profiles.
At vertical measurement planes:
1
2 Project Outline
• Azimuthal variation of tip vortex strength.
• Tip vortex motion in vertical planes, focusing on the cross-stream variation of vortex
motions and vortex pair roll-over behind the rotor swept volume.
• Stream-wise vorticity decay, with a comparison with simple theoretical vortex model.
• 3D wake geometry.
• Evolution of stream-wise velocity profile in vertical planes.
Chapter 2
Vertical Axis Wind Turbine - A Brief
Introduction
Based on the alignment of rotational axis, two types of wind turbines are distinguished:
Horizontal Axis Wind Turbine (HAWT) with rotational axis lying parallel to the ground, and
Vertical Axis Wind Turbine (VAWT) with rotational axis standing vertically. Besides their
different appearances, the underlying working principle is same. Wind turbine extracts kinetic
energy from the wind, converting it into mechanical energy in the form of rotational motion;
through built-in electricity generator, the mechanical energy is converted into electric energy
which is delivered to electric networks.
VAWTs are divided into two streams: drag-driven type and lift-driven type. The drag-driven
type is propelled by the drag difference between the upstream and the downstream part of
rotor blade. A famous example of drag-driven VAWT is the Savonius rotor (Figure 2.1(a))
named after Finish engineer Sigurd Savonius who invented it in 1925 [34]. Structural simplicity
and relatively high reliability make drag-driven VAWTs particularly suitable for applications
such as wind-anemometers and Flettner Ventilators. The former ones are commonly seen on
the building rooftop whereas the latter ones are typically used as the cooling system of road
vehicles. Despite their simplicity, the Savonius rotors, as with other variants of drag-driven
VAWTs, have generally low operational efficiency (CPmax =0.17) when compared with their
horizontal axis competitors (CPmax =0.59).
Another Typology of VAWT is driven by lift. One famous example is the so-called Darrieus
turbine (Figure 2.1(b)) patented by American Engineer Georges Darrieus in 1931 [29]. In
theory Darrieus turbines are the most efficient VAWT, achieving an optimal power coefficient
of CP =0.42 [26]. Since turbine blades are curved into an egg-beater shape (to reduce the
stress induced by centrifugal force), Darrieus turbines are also known as the egg-beater rotors.
In 1970s and 1980s, this configuration was extensively studied in Canada and the United
States. In particular, the research work at Sandia National Laboratories proved the feasibility
of large scale Darrieus turbines [30]. In 1984, the completion of Eole C (Figure 2.1(b)), the
largest VAWT ever built [11], marked the culmination of a decade research efforts. In the
3
4 Vertical Axis Wind Turbine - A Brief Introduction
end of 1980s, the shrinkage of North America market cut down research funding, resulting
in a research stop for almost 15 years. In the following decades commercial development
took over, companies like FloWind launched massive implementations of Darrieus turbines. In
its full development during 1987, the power output of all FloWind VAWTs could supply the
electricity use of nearly 20,000 California families. However, the glorious commercial success
was not sustained as series of fatigue-related failures finally dragged down FloWind at the end
of 2004 [17][30][39].
To overcome the structural deficiency of Darrieus turbines, a number of design concepts were
explored since 1980s. Among them, the H-type VAWT or H-rotor (Figure 2.1(c)) stand out for
its simplicity and efficiency. The use of straight blade reduces the difficulty of manufacturing
curved blade; and the use of inherent blade stall characteristic removes the need of speed-
break mechanism [30]. H-rotor researches during 1980s produced famous prototypes like
VAWT-850, which is the largest H-rotor in Europe [27]. In 1990s, years of research efforts
were transformed into commercial developments. Companies like Solwind of New Zealand,
Ropatec of Italy, Neuh¨aususer of Germany designed and produced a range of H-rotors [16].
(a) Savonius type VAWT [5] (b) Darrieus turbines (Eole C) [30]
(c) H-rotor [30]
Figure 2.1: Examples of VAWT
2.1 VAWT vs. HAWT 5
2.1 VAWT vs. HAWT
As an omni-directional machine, VAWT eliminates the need of pitching system hence reduces
mechanical complexity [22]. VAWTs are generally quieter than HAWTs, making them suit-
able for densely populated areas [19]. The ground-based equipment (e.g. transmission and
electrical generation, etc.) makes VAWTs lighter, and easier for maintenance [12]. In offshore
applications, low center of gravity allows an enhanced floating stability and a reduced gravi-
tational load. The possibility of under-water electric generator further decreases the size and
cost of the floating support structure.
VAWTs have great potentials in wind farm operations. As the power output of a wind turbine
is proportional to blade swept area, growing demand of power output has pushed the size
of HAWTs to limit. Larger wind turbine size results in higher centrifugal force and bending
stresses. Longer turbine blade requires larger turbine spacing hence lower wind farm density
[30]. On the other hand, the size of VAWT can be extended vertically without a significant
increase of occupied area. Recent researches showed that the wake recovery of a VAWT is
faster, allowing for clustered array and increases wind farm power output [12][25].
However VAWT has its problems. Besides the well-known self-starting problem, the occurrence
of dynamics stall at low rotational speed also shortens the turbine life. The inherent rotor
asymmetry and unsteady operation of VAWTs lead to complicated blade loading and flow
phenomena, which challenge blade designs and flow analyses [10].
Chapter 3
Fundamental Aspects of VAWT
Wake Aerodynamics
The wake of a VAWT is inherently unsteady. The unsteadiness originates from periodical
change of local Angle of Attack (AoA) at the blade level and from blade-wake interactions
at the rotor level. Flow phenomena due to this unsteadiness include time varying vorticity
shedding, unsteady wake evolution, blade vortex interaction, etc. Wake dynamics of VAWTs
is further complicated by the strong asymmetry between the advancing and receding sides of
the rotor [36]. Decades of research discontinuity leads to a limited understanding of these
complicated phenomena.
In the past few years, wake aerodynamics of an H-rotor was extensively studied in the
Wind Energy Research Group (DUWIND) of Delft University of Technology (TU Delft). An
inviscid unsteady panel code has been developed to simulate time dependent wake evolution
[14]. Recently, the development of hybrid code has started, coupling Computational Fluid
Dynamics (CFD) solver at turbine blades and vortex method at turbine wakes. Both methods
are grid-free, making them insensitive to numerical dissipation hence well suitable for vortical
flow simulation. In parallel to the numerical works, a range of experimental studies (e.g. smoke
visualization, hot-wire and PIV measurement, etc.) were performed to validate numerical
codes [36][37][38].
This chapter addresses fundamental aspects of the H-rotor wake dynamics, focusing on the
generation and spatial distribution of vorticity within the rotor swept volume. The evolution
of the vortical structures downstream of the rotor will be discussed in Chapter 6 and Chapter 7
in combined with the discussion of experimental results.
3.1 Definitions and Notations
The wake of a VAWT can be divided into a region within the rotor swept volume and a region
behind the rotor. Traditional momentum-based streamtube models treated a turbine rotor as
7
8 Fundamental Aspects of VAWT Wake Aerodynamics
two half cups to adapty classical momentum theories [28]. Although this division accurately
predicts integral forces, its capability in capturing the details of vortex dynamics is limited.
The inefficiency lies in its incomplete treatment of the regions between upwind and downwind
half of the rotor. These two regions, commonly referred to as the windward and the leeward,
are essential to vorticity shedding and energy extraction of a VAWT. A better way of rotor
division is proposed in [36]:
• Upwind 45◦ < θ < 135◦
• Leeward 135◦ < θ < 225◦
• Downwind 225◦ < θ < 315◦
• Windward 315◦ < θ < 360◦ ∪ 0◦ < θ < 45◦
With θ being the azimuthal angle and θ = 90◦ being the most upwind. Figure 3.1 display a
schematics of this division. The Cartesian reference system is origined at the turbine center,
x-axis directs positively downwind of the turbine, y-axis points windward and z-axis points
upwards. Counter-clockwise rotation is defined positive seen from above.
In the following context, x-direction is referred to as the stream-wise direction and y-direction
is referred to as the cross-stream directions. The turbine axial plane is the plane y/R = 0.
In the horizontal direction, inboard refers to the direction of decreasing |y/R|, and outboard
refers to the direction of increasing |y/R|. In the vertical direction, inboard refers to the
direction of decreasing |z/H|, and outboard refers the direction of increasing |z/H|.
x
y
R
θ = 0˚
θ = 45˚
θ = 270˚θ = 90˚
θ = 180˚
θ = 135˚ θ = 225˚
θ = 315˚
u∞ ω
Upwind
Windward
Leeward
Downwind
Figure 3.1: Schematic of 2D VAWT division
Like other rotational machines, two parameters are important for VAWTs. Blade Solidity σ
describes the percentage of the rotor area covered by solid blades:
σ =
Bc
R
(3.1)
Where B is the number of blade, c blade chord and R rotor radius. Large blade solidity creates
strong rotor blockage hence large flow induction. The Tip Speed Ratio (TSR) λ determines
3.2 Generation of Vorticity 9
turbine rotational frequency and is crucial to the power output:
λ =
ωR
u∞
(3.2)
Where ω is the rotor angular velocity in radius per second and u∞ is the free-stream velocity.
According to a typical CP -TSR diagram (Figure 3.2) the peak power is found at the medium
range of TSR. Low TSR tends to trigger dynamic stall, which postpones the occurrence of
normal stall but intensifies unsteady blade loading, whereas high TSR results in low AoA, both
compromising turbine efficiency.
1 2 3 4 5 6 7 8
0
0.1
0.2
0.3
0.4
TSR
C
P
Re=150,000
Re=300,000
Figure 3.2: CP -TSR diagram
3.2 Generation of Vorticity
The wake of VAWTs consist of shed and trailed vorticities. Due to unsteady blade motions,
the release and distribution of vorticity are time dependent.
x
y
R
u∞
λu∞ ueff ω
θ
u∞
Figure 3.3: Free body diagram of inflow vector
Based on the schematics of Figure 3.3, the geometrical AoA α can be derived as a function
10 Fundamental Aspects of VAWT Wake Aerodynamics
of blade azimuthal angle θ:
α = tan−1 − cos θ
λ − sin θ
(3.3)
Time variations of AoA and inflow velocity lead to a periodically varying bound circulation,
which, according to the Kelvin’s theorem [23] generates shed vorticity proportional to the
negative change rate of bound circulation Γ:
ωshed (t, z) = −
∂Γ (t, z)
∂t
(3.4)
The bound circulation can be derived using the unsteady formulation of the KuttaJoukowski
theorem [23]:
Γ = Γinflow + Γpitching
= cπ uresα +
c
2
1
2
− a ˙γ
(3.5)
Where ures the local inflow velocity, a the distance from rotation center to the leading edge
of airfoil, and ˙γ the pitching rate. The first right-hand-side term measures the circulation due
to inflow velocity, and the second term specifies the additional circulation of blade pitching
motions.
The magnitude of trailed vorticity is determined by the spatial gradient of bound circulation
in the z-direction:
ωtrailed (t, z) = −
∂Γ (t, z)
∂z
(3.6)
Shed vorticity aligns with the blade trailing edge, and trailed vorticity is orientated perpen-
dicular to the blade trailing edge. Two types of vorticity have a phase difference of 90◦.
0 45 90 135 180 225 270 315 360
−30
−20
−10
0
10
20
30
θ°
α°
λ = 3
λ = 4
λ = 5
(a) Geometrical AoA
0 45 90 135 180 225 270 315 360
−1
−0.5
0
0.5
1
θ°
Γ/Γ
θ=90
°
,λ=3
λ = 3
λ = 4
λ = 5
(b) Normalized bound circulation
0 45 90 135 180 225 270 315 360
−1
−0.5
0
0.5
1
θ°
ω/ω
θ=0
°
,λ=5
λ = 3
λ = 4
λ = 5
(c) Normalized shed vorticity
Figure 3.4: 2D characteristics, without induction
Figure 3.4 displays the azimuthal variation of the geometrical AoA, bound circulation and
vorticity shedding at three TSRs. The greatest AoAs are found at the leeward side around
θ = 130◦ and θ = 230◦ (varying with TSR). Increasing TSR causes a drop of AoA, which
reduces the likelihood of dynamics stall. Result shows that bound circulation is independent
of TSR. The strongest circulations are observed at the most upwind and downwind sides of
the rotor; whereas the greatest changes rate of bound circulation (i.e. the strongest vorticity
3.3 Vorticity and Energy Considerations 11
shedding) occurs at the most windward and leeward sides. Shed vorticity plot (Figure 3.4(c))
shows that vorticity shedding increases with TSR since the change rate of bound circulation
becomes higher.
The analysis so far has not considered the effect of flow induction. In reality, vorticity distribu-
tion is non-symmetrical at two sides of the rotor. This is primary due to the asymmetrical flow
induction as the windward advancing blade has different inflow conditions from the leeward
receding blade. In the stream-wise direction, wake induction of the upwind blade passage re-
duces the inflow velocity hence vorticity shedding downwind of the rotor, therefore the global
wake dynamics is mainly determined by the wake generated at the upwind half of the rotor.
Figure 3.5 displays the effective AoA and vorticity shedding from 2D simulation.
0 45 90 135 180 225 270 315 360
−5
0
5
10
15
20
θ°
α
°
(a) Effective AoA
0 45 90 135 180 225 270 315 360
−1
−0.5
0
0.5
1
θ°
ω/ωmax
(b) Normalized shed vorticity
Figure 3.5: 2D characteristics, with induction
Trailed vortex is generated along the finite span of a 3D VAWT. The strongest trailed vortex,
known as the tip vortex, is released at the blade tip where the spatial gradient of the circulation
is the highest. Neglecting ground effects and gravitational forces, the distribution of tip vortex
is symmetrical with respect to the turbine axial plane y/R = 0. Figure 3.6 shows a schematic
of tip vortex releasing along blade trajectory. Curved arrow represents the direction of vortex
roll-up; plus and minus signs indicate pressure and suction sides of the blade. Tip vorticity
changes its orientation at the most windward and leeward sides of the rotor, as a result of the
sign change of bound circulation (Figure 3.4(b)). The production of trailed vorticity is weaker
at the downwind part of the rotor due to reduced bound circulation. As shedding vorticity
is determined by the time variation of bound circulation, the strongest vorticity shedding
concentrates at the turbine mid-span where bound circulation is usually the highest.
3.3 Vorticity and Energy Considerations
Assuming the energy extraction of a wind turbine can be measured by the Bernoulli constant
∇H, it can be shown that ∇H is determined by the local flow velocity u and the vorticity
field ω [23]:
∇H = ρ (u × ω) (3.7)
12 Fundamental Aspects of VAWT Wake Aerodynamics
+ -
-+
0˚
180˚
90˚ 270˚
u∞
Figure 3.6: Schematic of tip vortex release along blade trajectory
where vorticity is related to the curl of blade force by:
Dω
Dt
=
1
ρ
∇ × f
=
1
ρ
∂fx
∂z
j −
∂fx
∂y
k
(3.8)
For 2D VAWT spatial derivatives and force terms in z-direction are omitted, implying vorticity
shedding and energy exchange occur at azimuthal positions where
∂fy
∂x − ∂fx
∂y is non-zero.
To extract power in 3D, both shed and trailed vorticity are essential. Figure 3.7 shows a
simplified schematic of a VAWT wake consisting of an array of vortex sheets. Shed vortices
form the red sheets perpendicular to the inflow direction, and trailed vortices form the blue
sheets parallel to the incoming flow. Two types of vortex sheet form a square wake tube which
deforms along its convection.
u∞
(a) Shedding vorticity sheets
u∞
(b) Trailing vorticity sheets
Figure 3.7: Schematics of wake vortex sheets
Chapter 4
Particle Image Velocimetry
Particle Image Velocimetry (PIV) is a non-intrusive flow diagnostic technique allowing flow
field measurements. Comparing with intrusive flow measurement techniques like hot wire
anemometer or pressure tube, PIV eliminates the need of instrumental intrusions by using
non-intrusive laser light and tracer particles. Using Two Components PIV (2C-PIV) technique
two velocity components within a planar interrogation window are obtained, and by using
Stereoscopic PIV (SPIV) a third velocity component normal to the measurement plane can
be resolved. Recently, the development of Tomographic PIV [15] extends the measurement
range to a 3D volume.
Fundamentals of 2C-PIV measurements are discussed in Section 4.1. A brief introduction to
SPIV technique is presented in Section 4.2. If not stated otherwise, the content of 2C-PIV
is based on the lecture notes of the course Flow Measurement Techniques of TU Delft [35],
PIV lecture slides of A. James Clark School of Engineering, University of Maryland [24] and
the book Particle Image Velocimetry - A Practical Guide [32]. The content of SPIV is based
on the paper of Arroyo and Greated [8] and the review paper of Prasad [31].
4.1 Fundamentals of 2C-PIV
A typical 2C-PIV set-up consists of following components: a laser generator producing light
sheet for particle illumination, a camera capturing the particle scattered light, and a PIV
software for image acquisition and data processing. Figure 4.1 shows a basic PIV set-up. Key
components are discussed in the following context.
Tracer particles
PIV measures flow velocity by cross correlating tracer particle positions of two consecutive
image frames. Tracer particles must be small enough to faithfully trace the fluid motion;
in the meanwhile, the size of the tracer particle should be large enough to scatter adequate
13
14 Particle Image Velocimetry
Figure 4.1: Schematics of PIV set-up [35]
light. The contradictory requirements make it non-trivial to select a proper particle size. Small
particles are excellent flow tracer (due to low mass inertia) but are not good scatter (due to
limited size); whereas the situation is opposite for large particles. For micro-metric particles
used in PIV measurements, light scattering occurs at Mie regime where particle diameter is
comparable or larger than the laser wavelength. In this regime, the strongest scattering occurs
at 0◦ and 180◦ with respect to the incoming light, while the weakest scattering concentrates
in the direction normal to the camera viewing direction. Since the contrast of PIV image is
strongly determined by the scattering intensity, it is preferred to use the largest possible tracer
particles without interfering flow properties. The diameter of typical tracer particles is about
1-3 µm in air flow measurement.
Integration window
Average particle displacement of interrogation window is derived using cross correlation. For
statistically significant results, it is important to have a sufficient number of tracer particles;
in the meanwhile over-seeding should also be avoided to prevent multi-phase flow. Typically,
a desired particle concentration lie within the range from 109 to 1012 particles/m3 and each
integration window should contain at least 10 particles.
If large velocity variation presents in the measurement domain, the selection of a proper
window size becomes difficult. A small window tends to cause particle loss, whereas large
window size inevitably averages out flow details. To overcome this difficulty, the so-called
multi-pass technique is developed. Starting with large window, this approach pre-shifts smaller
interrogation windows (of the next pass) by using the distance estimated at the current pass.
This process continues until the smallest window size is reached. Figure 4.2 demonstrates an
example of applying single pass and multi-pass operations to a same measurement area. It is
4.2 Stereoscopic PIV (SPIV) 15
clear that multi-pass operation is capable of resolving flow field with large velocity contrast
between the vortex region and the background free-stream region, which is impossible by using
single-pass operation.
Single-pass
window size 24×24
Multi-pass
min. window size 24×24
Figure 4.2: Multi-pass vs. single-pass
Overlap between neighboring interrogation windows is often preferred to increase the use of
measurement data. Since particles near the edge of windows are less likely to be captured
in both frames, the processed image tends to be less accurate around window edges. By
overlapping, these data are replaced by the data of neighboring window which does not lies
at the edge. 20-30% overlap is common in practice.
PIV acquisition and processing software
The complicity of PIV measurement requires a real-time control of mutual dependent sub-
systems. Modern PIV softwares (e.g. LaVision, PIVtec, TSI, etc) integrate control of various
sub-systems (e.g. laser, cameras, etc.) into a central control unit which supports online
processing in parallel to measurements.
4.2 Stereoscopic PIV (SPIV)
4.2.1 Working principle
Stereoscopic PIV determines the velocity component normal to the measurement plane by
using two synchronized cameras viewing from different angles. In a single camera set-up
(Figure 4.4(a)), out-of-plane velocity is projected onto the object plane causing perspective
errors. Using two off-axis cameras, the perspective error is converted into information about
out-of-plane velocity components.
Figure 4.3 shows the 2D schematic of a stereoscopic camera arrangement. Velocity compo-
16 Particle Image Velocimetry
u
ux
ux1
ux2
uz
CAM1 CAM2
α1
α2
X
z
Y
Object plane
Figure 4.3: Schematics of stereo camera arrangement
nents in x-, y- and z- directions can be derived as:
ux =
ux1 tan α2 + ux2 tan α1
tan α1 + tan α2
uy =
uy1 tan β2 + uy2 tan β1
tan β1 + tan β2
uz =
ux1 − ux2
tan α1 + tan α2
=
uy1 − uy2
tan β1 + tan β2
(4.1)
Where α and β represent camera viewing angle with respect to yz- and xz-plane. To avoid
singularity as α and β approaches zero, Equation 4.1 can be modified to:
ux =
ux1 + ux2
2
+
uz
2
(tan α1 − tan α2)
uy =
uy1 + uy2
2
+
uz
2
(tan β1 − tan β2)
(4.2)
4.2.2 Translational and rotational configurations
Based on camera arrangements, two SPIV configurations are distinguished. A translational
configuration consists of two parallel standing cameras with lens axes normal to the light sheet
(Figure 4.4(b)). This configuration allows for uniform magnification and good image focus,
but its resolution is restricted by viewing angle θ (or camera off-axis angle). It can be shown
that the accuracy of out-of-plane displacement is inversely proportional to viewing angle [43]:
σ∆z
σ∆x
=
1
tan α
(4.3)
Where σ∆z and σ∆x represent the errors of out-of-plane and in-plane velocity components.
With increasing viewing angle, the viewing axis deviates from lens design specification, causing
substantial performance decay.
The restriction on viewing angle is removed with a rotational configuration (Figure 4.4(c)).
Since lens axes align with the viewing directions, the viewing angle can be increased without
4.2 Stereoscopic PIV (SPIV) 17
104
(a) Planar PIV (b) SPIV - Translational system
(c) SPIV - Rotational system
Figure 4.4: Configurations PIV systems [31]
(a) Before using Scheimpug
adapter
(b) After using Scheimpug
adapter
Figure 4.5: Effect of Scheimpflug adapter [1]
18 Particle Image Velocimetry
compromising lens performance, thereby allowing higher accuracy of out-of-plane velocity
components. Rotating cameras bring the drawback of non-uniform image magnification. To
retrieve uniform magnification cameras have to be mounted according to the Scheimpflug
condition [6], which requires a co-linear alignment of object plane, lens plane and image
plane. Without proper alignment the resulting image has only a narrow band of focused
region as shown in Figure 4.5(a). A practical solution is to add a Scheimpug adapter between
lens and CCD chip. By manually adjusting the orientation of Scheimpug adapter, a broader
focus range can be achieved as shown in Figure 4.5(b) [1].
Although increasing off-axis angle improves measurement accuracy, an excessively large angle
should be avoided to prevent strongly distorted image. In practice, the optimal measurement
quality is obtained as camera opening angle approaches 90◦.
4.2.3 Image reconstruction
To obtain displacement vectors in the object plane, the data of image plane is projected back
using mapping function. This process is known as image reconstruction.
If the complete geometry of PIV system is known, geometrical reconstruction can be used
to link the image plane data x to the object plane data X. Since this approach requires a
complete knowledge of imaging parameters, its practical use is limited.
A more useful method, known as calibration-based reconstruction, reconstructs the mapping
function through a calibration process. A typical mapping function reads:
x = f (X) (4.4)
Where f is usually a polynomial function with undetermined coefficients. Since the number
of calibration points often exceeds the number of unknown coefficients, the polynomial coef-
ficients are commonly determined using least square approximations. Calibration is performed
using a calibration target, typically a rectangular metal plate with prescribed grid marker
(cross, dots, etc.). For the calibration of a 2C-PIV set-up, a single image of the calibration
plate is sufficient; for the calibration of a SPIV set-up, a second image is required at a known
distance offset the laser sheet. Most commonly, a multi-level calibration plate (Figure 4.6) is
used for the calibration of SPIV configuration.
Figure 4.6: Multi-level Calibration Plate [32]
Chapter 5
Experimental Set-up and Image
Processing
5.1 Wind Tunnel
The PIV experiments have been performed in the Open Jet Facility (OJF) of TU Delft. The
OJF is a closed-circuit, open-jet wind tunnel with an octagonal cross-section of 2.85 × 2.85
m2 and a contraction ratio of 3:1. The tunnel jet is free to expand in a 13.7 × 6.6 × 8.2 m3
test section. Driven by a 500 kW electric motor, the OJF delivers free stream velocity range
from 3 m/s to 34 m/s with a flow uniformity of ±0.5% and a turbulence level of 0.24% [2].
A 350 kW heat exchanger maintains a constant temperature of 20◦C in the test section. A
schematic of the wind tunnel is shown in Figure 5.1.
Figure 5.1: Schematics of OJF [3]
19
20 Experimental Set-up and Image Processing
5.2 Turbine Model
The testing model is a two bladed H-type VAWT (H-rotor) with a rotor radius of 0.5 m. The
rotor blades are generated by straight extrusion of a NACA0018 airfoil to 1 m span and 6 cm
chord. Both sides of the blade are tripped with span-wise zig zag tapes, approximately 10%
chord from the blade leading edge. Each blade is supported by two aerodynamically profiled
struts (0.5 m) mounted at 0.2R inboard of blade tips, giving an aspect ratio of 1.8 and a
blade solidity of 0.11. The entire turbine model, including blades, struts and supporting shaft
is painted in black to reduce laser reflections.
The wind turbine is supported by a 3 m steel shaft connected to a Faulhaber R
brushless
DC Motor at the bottom. With the maximum output power of 202 W, this motor drives the
turbine at low wind speeds and maintains constant rotational speed. A Faulhaber gearbox with
5:1 gear ratio is coupled to the electrical engine to obtain sufficient torque at the operating
regimes. An optical trigger is mounted on the shaft to synchronize the PIV system for the
phased-lock acquisition.
5.3 Operational Conditions
The turbine was operated at a fixed TSR of λ =4.5. The operational TSR was determined
by a CP -TSR diagram similar to the one of Figure 3.2. Simulation shows λ = 4.5 yields the
optimal power output (CP = 0.4) for the testing turbine.
At a rotational speed of 800 RPM, the chord-based Reynolds Rec number is computed:
Rec =
ρωRc
µ
= 175, 000
Considering free-stream velocity and flow inductions, the actual chord-based Reynolds number
varied between 130, 000 to 210, 000.
0 5 10 15
0
0.2
0.4
0.6
0.8
1
1.2
1.4
1.6
1.8
2
Angle of attack α
°
CL
NACA0018, Re=∞
NACA0018, Re=130,000
NACA0018, Re=210,000
NACA0003, Re=∞
αmax
=12.5o
(a) Lift polar
0 5 10 15
0
0.02
0.04
0.06
0.08
0.1
0.12
0.14
Angle of attack α°
dCL
/dα
NACA0018, Re=∞
NACA0018, Re=130,000
NACA0018, Re=210,000
NACA0003, Re=∞
αmax
=12.5o
(b) Slope of lift polar
Figure 5.2: Lift characteristics of the airfoil
5.4 PIV Equipment 21
Both lift coefficient and lift slope are important for VAWTs. The former one specifies the
magnitude of bound circulation hence the strength of tip vortex, whereas the latter one
determines unsteady vorticity shedding hence the power efficiency of the turbine. Since one
of objectives is to validate vorticity shedding at the mid-span plane of the 2D simulation,
it is more important to use an airfoil with comparable lift slope as the viscous NACA0018
airfoil used in the experiment. The lift polar and lift slope of a NACA0018 airfoil are given
in Figure 5.2. Since the lift slope reduces in viscous flow, a thinner airfoil (NACA0003,
dCL
dα = 0.1) was used in the inviscid simulation to ensure the same performance of VAWT.
Noted although the lift characteristics of inviscid NACA0003 airfoil are closer to the viscous
NACA0018 airfoil, its higher lift slope is still an important cause of discrepancies in latter
comparisons. Neglecting flow inductions, the maximum angle of attack of 12.5◦ is highlighted
by the vertical dashed line in Figure 5.2.
5.4 PIV Equipment
The tracer particle was produced by a SAFEX R
twin fog generator placed downstream of
the rotor. This generator produces Diethyl glycol-based seeding particles of 1 µm median
diameter with a relaxation time of less than 1 µs [33]. Uniform mixing in the test section was
ensured by the wind tunnel closed loop.
A Quantel Evergreen R
double pulsed Nd:YAG laser system was used as the light source.
With the emitting power of 200 mJ per pulse, this system provides green light of wavelength
532 nm creating laser sheet of approximately 2 mm width and 40×30 cm2 illuminating area.
The pulsed laser energy, repetition rate and time delay between pulses were controlled by a
Processing Time Unit (PTU) and a sychnozation box called the Standford box.
Two LaVision R
Imager pro LX 16M cameras were used for image acquisition. The cameras
have a resolution of 4870×3246 pixels2 with the pixel size of 7.4×7.4 µm2. Each camera was
equipped with a Nikon R
lens with focal length varying with desired Field of View (FOV) and
image resolution (see Section 5.5 for details). Day light filter was added to reduce ambient
light. Camera acquisition was synchronized to the laser shooting using the DaVis acquisition
software.
5.5 PIV Set-up
The measurements were conducted with PIV system in two set-ups: a 2C-PIV measurements
at the horizontal plane and a SPIV measurements at the vertical planes.
The first set-up investigated horizontal measurement plane at the rotor mid-span position
(Figure 5.3). Given vertical symmetry of the rotor and that no relevant out of plane velocity
component has been detected across the mid-span plane, a planar PIV setup has been used
by combining two cameras into a single field of view. These two cameras were mounted on an
horizontal beam, side by side at 1.3 m beneath the horizontal laser sheet. Each camera was
equipped with an f = 105 mm Nikon lens, with a measuring aperture of f/4 and magnification
factor of M = 0.09. The Field of View (FOV) of single camera was 266 × 399 mm2, and the
combined FOV was 266 × 755 mm2 with an overlap of 44 mm in the y-direction.
22 Experimental Set-up and Image Processing
In the second set-up, measurements were taken in the vertical planes of 7 cross-stream posi-
tions (Figure 5.4). The SPIV set-up had two rotational cameras at two ends of a horizontal
beam; a laser generator in middle of the beam produced vertical laser sheet to illuminate the
measurement region. The cameras, mounted about d = 2.0 m from the measurement plane,
were equipped with f = 180 mm Nikon lenses (f/4) with a relative viewing angle of δ = 96◦
and a magnification factor of M = 0.07. The resulting FOV was 365 × 430 mm2.
Figure 5.3: Configuration of horizontal measurements
Figure 5.4: Configuration of vertical measurements
5.6 System of Reference and Field of View 23
5.6 System of Reference and Field of View
To synchronize the motion of cameras and laser, a two degrees-of-freedom traversing system
was used, providing a stream-wise range of 1.4 m and a cross-stream range of 1.0 m.
The horizontal measurements covers the rotor swept area and the wake region up to 4R
downstream of the rotor. The positions of measurement window were optimized to minimize
blade and tower shadows. To cover the target measurement domain, the traversing system
was placed at two stream-wise positions. The first traversing system position covered the
measurement range of x/R = [−1.88, 1.38], y/R = [−1.34, 1.35] and the second position
covers the range of x/R = [1.13, 4.43], y/R = [−1.77, 1.77]. Figure 5.5 shows a schematic
of the measurement domain. Each interrogation window is labeled with a unique ID, with
the first digit indicating the number of traversing system position and the second alphabet
indicating the window sequence. In the stream-wise direction windows were overlap by 7.1%
to 19.9% of window width, in the cross-stream direction window overlap was constant and
equaled to 21.6%. Between the first and second traversing system positions, two overlapped
windows (1N, 2H) were measured for alignment. Convergence of the averaged phase-locked
velocity was ensured with 150 images taken at θ = 90◦.
0 3 4
0
wind
Figure 5.5: Schematics of measurement windows of horizontal plane
The vertical measurements covered the stream-wise range from x/R = −1.10 to x/R = 6.00
at 7 cross-stream positions, y/R = -1.0, -0.8, -0.4, 0, +0.4, +0.8, +1.0. Measurement
windows were placed at three height of z/H = 0.18, 0.50, 0.75, capturing flow behaviors in
the vertical range from z/H = −0.07 to z/H = 1.01. Figure 5.6 shows the side view and
the top view of the measurement domain. The stream-wise window overlap ranged from
19.0-43.6% of the window size. Between neighboring traversing system positions, overlapped
windows were measured to determine their relative positions. To reduce blade shadows, phase-
locked measurements were performed at θ = 0◦, with 150 images taken at each interrogation
window.
24 Experimental Set-up and Image Processing
0 2 3 4 5 6 7
0 TS4TS4TS4
4H
TS4
4I
TS4
4L
TS4
TS6TS6TS6TS6TS6TS6TS6
TS7TS7TS7TS7TS7TS7TS7
TS5TS5TS5TS5TS5TS5TS5
TS9TS9TS9
wind
x/R
z/H
(a) Side view
0 2 3 4 5 6 7
0 y/R=0
wind
x/R
y/R
(b) Top view
Figure 5.6: Schematics of measurement windows of vertical planes
5.7 Image Processing
LaVision R
Davis software was used for image processing. Data processing includes 3 major
steps: pre-processing, processing and post-processing.
In the pre-processing phase, background noise was removed by subtracting the minimum
average; a 3 × 3 Gaussian filter was used to ensure Gaussian profile shape and to reduce the
effect of peak locking; spatial disparities of image intensity were excluded by removing the
sliding background.
The images were processed with a multi-pass correlation with the minimal window size of
32 × 32 pixels2 and an overlap ratio of 50%. The cross-correlation was sped up with built-in
GPU mode of DaVis, using NVIDIA GeForce R
GTX 570 GPU (480 cores, 1405.4 GFlops in
double precision and 152.0 GB/s memory bandwidth) [4].
In the post-processing phase outliers of cross-correlation results were removed by applying
a median filter. Final results were exported as DAT-files, which includes the following scale
quantities:
• Velocity field: ux, uy, uz, |u|
• Standard deviation: σux , σuy , σuz , σ|u|
• Reynold stress: τxy, τxz, τyz, τxx, τyy, τzz
5.7 Image Processing 25
Figure 5.7 gives an example of a raw image and the corresponding pre-processed and processed
images.
(a) Raw image (b) Pre-processed image (c) Processed image
Figure 5.7: Example of raw images and processed image
Since the DaVis exported data is based on local coordinates, it is essential to stitch individual
images using global coordinates. Details of the stitching function can be found in Appendix A.
At overlap regions, the interrogation window with better image quality was used. Averaging
or image interpolation was not applied.
Chapter 6
2D Wake Dynamics
The study of 2D wake dynamics at the turbine mid-span plane focuses on 6 aspects:
• Vorticity shedding within the rotor swept area (Section 6.3)
• Blade-wake and wake-wake interaction (Section 6.4)
• Vortex dynamics along the wake boundary (Section 6.5)
• Wake circulation behind the rotor swept area (Section 6.6)
• Wake geometry (Section 6.7)
• Wake induction and velocity profiles (Section 6.8)
Experimental and simulation results are displayed in Section 6.1 and Section 6.2. Detailed
analyses based on these results are presented from Section 6.3 to Section 6.8.
6.1 Experimental Results
Measurement results of the mid-span plane are presented in Figure 6.1. Figure 6.1(a) and
Figure 6.1(b) show the contour plots of stream-wise velocity ux and cross-stream velocity
uy, respectively. Figure 6.1(c) shows the out-of-plane vorticity contour ωz. The results were
averaged over a phased-locked sampling of 150 images when blades were at the most upwind
and downwind positions. Spatial coordinates are non-dimensionalized with the turbine radius
R; velocity components are non-dimensionalized with the free-stream velocity u∞ and vorticity
is non-dimensionalized with u∞
c . The wind came from the left and the turbine rotated in the
counter-clockwise direction. Turbine blades, its trajectory, supporting struts and turbine tower
are indicated in black, while the shadow blocked areas are blanked.
Experimental results show asymmetrical wake expansion with faster expansion at the windward
side. Velocity deficit induced by energy extraction is visible in the stream-wise velocity plot.
The highest velocity gradients are observed in the most upwind and downwind blade positions,
27
28 2D Wake Dynamics
(a) Non-dimensionalized stream-wise velocity
(b) Non-dimensionalized cross-stream velocity
(c) Non-dimensionalized out-of-plane vorticity
Figure 6.1: Contour of wake velocity and wake vorticity, 2D phase-locked experimental
results
6.2 Simulation Results 29
when blade circulation is respectively maximum in positive (counter clockwise) and negative
(clockwise) signs.
Due to periodic blades motion, shed vorticity sheets follow curved trajectories. The down-
stream convection of the curved vorticity sheets form a U-shape wake geometry (Figure 6.1(c)).
Defining vorticity sheet released over one turbine period as a complete wake cycle, each wake
cycle consists of a convex upwind segment and a downwind concave segment. Wake geometry
at the mid-span xy-plane is characterized by downstream transport of convex wake segments
within the rotor swept area and downstream transport of concave wake segments behind the
rotor. Windward and leeward counter-rotating vortical structure resemble a K´arm´an vortex
street behind a cylinder. Near wake vortex roll-ups and interactions with neighboring vortices
cause vortex deformation along its convection. Further downstream, vorticity strength reduces
under diffusion and the concentrated vortex spreads to a broader area.
6.2 Simulation Results
Results presented in this section are produced by the 2D version of the in-house developed
unsteady inviscid free wake panel code. In the simulation, two airfoil are discretized using
constant sources and doublet elements, with their strengths are determined by the Kutta
condition imposed at trailing edges. The wake is modeled as a lattice of straight vortex
filament and is free to evolve under mutual inductions. Direct computation of wake induction
is accelerated by parallelization on GPU. Vortex elements are modeled as Rankine-type vortex,
representing free vortex at the outer radius (potential flow) and rigid body rotation at the
inner radius. Viscous diffusion is not accounted in the current version of the simulation code.
An Adam-Bashforth second order time scheme is used for time marching.
To investigate fully developed wake flow, the simulation ran until the convergence of integral
force parameter (e.g. CT ), which corresponded to 15 rotations with a wake extension of 25R
downstream of the turbine. The phase-locked results shown in Figure 6.2 were obtained by
averaging instantaneous flow fields of 1◦ azimuthal step over 10 turbine rotations.
6.3 In-rotor Vorticity Shedding
Vorticity shedding is a result of unsteady aerodynamics at the blade level, and is crucial to wake
development and energy extraction of an H-rotor. Examining the vorticity sheet emanating
from the blade (Figure 6.1(c)), counter-rotating vorticity sheets are clearly visible as a result
of non-sharp trailing edge.
6.3.1 Evaluation method
According to the Kelvin’s theorem [23], the magnitude of shed vorticity equals to the negative
change rate of blade bound circulation Γ. Deriving vorticity using this relation requires a
time sequence of measurements over a blade enclosed domain. Unfortunately light blockages
30 2D Wake Dynamics
(a) Normalized stream-wise velocity
(b) Normalized cross-stream velocity
(c) Normalized out-of-plane vorticity
Figure 6.2: Contour of wake velocity and wake vorticity, 2D phase-locked simulation results
6.3 In-rotor Vorticity Shedding 31
of rotor blades and other supporting structures often result in discontinuous measurement
contour.
An alternative way of determining the magnitude of the shed vorticity is by considering a finite
domain near the blade trailing edge. As shown in Figure 6.3, the vorticity ω that are released
in infinitesimal time interval δt is related to the change in bound circulation δΓ by:
δΓ = ω · (wδs′
)
Where δs′
= δsb − δsv = (ub − uv)δt
(6.1)
Where w is the local width of vorticity sheet, ub is the velocity of blade motion and uv is the
convective velocity of the vorticity sheet.
δsb
δsv
Γ
t
t+δt
Γ+δΓ
u
Figure 6.3: Change of bound circulation vs. vorticity shedding
l
d
wt
Figure 6.4: Schematics of integration window
Although the underlying principle is straightforward, the aforementioned method is difficult
in practice. First, the finite window length implicitly introduces uncertainties by summing up
the vorticity released at earlier time instances. To reduce this uncertainty, it is preferred to
minimize the window length l, and to shorten the distance between the window and the blade
trailing edge d. However, it is difficult to have the domain very close to the blade trailing
edge as blade edge laser reflections often leads to a larger masked area than the actual size of
the blade. Also an excessively small domain size cannot guarantee improved accuracy. Strong
velocity gradient confined within the thin layer of vorticity sheet makes precise capturing
difficult using standard multi-pass correlation. Assuming the wake sheet just emanated from
the blade is 1 mm wide (comparable to the thickness of blade trailing edge), and considering
the camera scale is approximately 10 pixels/mm, the resulting resolution in the direction of
wake width is only 10 vectors. This is apparently insufficient to resolve dynamic flow behavior
within the wake sheet. Second, a precise estimation of vorticity convective distance δsv is
often difficult due to the non-uniform convective velocity of vorticity sheets. A sensitivity
analysis near blade trailing edge shows that the computed circulation varies significantly with
the change of domain size, therefore it is not feasible to use this approach to the wake sheets
just released from the blade.
32 2D Wake Dynamics
6.3.2 On path tracking of wake circulation
Although the experimental resolution does not allow to resolve the vorticity release close to the
blade trailing edge, the method outlined in the last section is applicable to the wake segment
further away from the blade. Viscous diffusion and wake sheet expansion reduce sharp velocity
gradients, making the application less sensitive to the size of integration window.
0 0.02 0.04 0.06 0.08
−0.8
−0.75
−0.7
−0.65
−0.6
−0.55
Box length
ωc/u∞
Figure 6.5: Sensitivity analysis of box length
The on path circulation is computed using integration windows along the wake sheet. Each
window is orientated such that the window length l (short edge) aligns with tangential direction
of the vorticity sheet. Window lengths are non-uniform and are determined based on a similar
sensitive analysis as shown Figure 6.5. Results show that an overly small window length results
in large fluctuations due to the the uncertainty on image processing. The smallest length that
produces steady circulation is chosen as the window length. Window widths w (long edge)
vary along the wake curve. In order to eliminate the influence of background vorticity, window
width is chosen to be the local width of vorticity sheet t (Figure 6.4).
0 0.5 1 1.5 2 2.5
−0.6
−0.5
−0.4
−0.3
−0.2
−0.1
0
0.1
s/R
Γ/Lu∞
EXP
SIM, NACA0018
SIM, NACA0003
(a) Wake of upwind blade
0.511.522.5
0
0.1
0.2
0.3
0.4
0.5
0.6
0.7
s/R
Γ/Lu∞
EXP
SIM, NACA0018
SIM, NACA0003
(b) Wake of downwind blade
Figure 6.6: On path circulation tracking
Figure 6.6 displays the results of on path wake circulation. Horizontal axis represents the path
coordinate along the wake, with the origin defined at the blade trailing edge (Figure 6.7);
6.3 In-rotor Vorticity Shedding 33
vertical axis measures the circulation per unit length, which is non-dimensionalized by the free-
stream velocity u∞. The y-axis of Figure 6.6(a) and the x-axis of Figure 6.6(b) are reversed
for easy comparison. Comparing two simulation results shows that the wake circulation trailed
from a NACA0018 airfoil is stronger due to the larger lift slope, as expected in Section 5.3.
Figure 6.6(a) compares the measured windward wake circulation with the result of 2D simu-
lation. Simulation predicted circulations are generally higher owing to the higher lift slopes.
Agreement between the measurement and the simulation is reasonable from s/R = 0 to
s/R = 1.5. Assuming limited wake convection, this part of wake corresponds to the vorticity
shed from θ = 0◦ to θ = 90◦, where the decreasing change rate of bound circulation results
in a steady decline of wake strength towards the upwind side of the rotor. Both simulation
and experimental results observe two circulation peaks with the measured peaks lying more
upwind. The measured upwind peak (at around s/R = 1.4) is partially blocked by the tower
shadow. The positions of peak circulation are highlighted by black circles in Figure 6.7. Wake
circulation reduces dramatically downstream of the peaks due the induction of upwind wakes.
Fluctuations of the measured result might result from a number of factors including variations
of data quality, sensitivity of integration window sizes and residual background noises.
s/R
s/R
(a) Experiments
s/R
s/R
(b) Simulation, NACA0018
s/R
s/R
(c) Simulation, NACA0003
Figure 6.7: Maximum circulation position
The wake strength at the leeward side of the rotor is presented in Figure 6.6(b). The experi-
mental circulation shows an increase from the large s/R (upwind part), climbing to its peak
values (leeward part) in the middle range of s/R and drops drastically from the peak onward
(downwind part). Although the simulation predicts a similar trend, the discrepancies in detail
are different. First, the simulation predicted upwind circulation is much higher. Second, three
local peaks are are observed in the simulation results, whereas only one peak is observed in the
measured results. In contrast to the windward side, the measured leeward peak shifts down-
wind with respect to the simulation results. In average the leeward observed peak circulation
is 20% higher than the peak circulation at the windward wake.
The variation of wake circulation is determined by three factors:
• Strength of newly released wake
• Vorticity convection along the curved wake segment
• Vorticity strengthening due to wake interactions
34 2D Wake Dynamics
The convection velocity of the vorticity sheets is determined by viscous blade dragging and
local velocity field. In general vorticity convection along the path is relatively slower than
the downstream wake transport. Since wake interactions only causes local modifications of
wake circulation, the global difference of upwind circulation is most likely attributed to the
circulation difference just released from the blade. It seems that the numerical simulation
predicts the windward wake circulation reasonably well, whereas it tends to overestimate at
the leeward side. Comparing with a nominal shed vorticity distribution (Figure 3.5(b)), the
increase of circulation presented in Figure 6.6 is more abrupt. Since most circulation peaks
correspond to the positions of wake crossing, the strengthening of local vorticity field is most
likely caused by wake interactions which also shift the position of the peak circulation. Detailed
effects of wake interaction are discussed in the next section.
6.4 Blade-wake and Wake-wake Interaction
Blade-Wake Interaction (BWI) arise when a downwind turbine blade crosses the wake segments
generated by the other blades or generated by the blade itself during previous revolutions.
Wake-Wake Interaction (WWI) occur when different wake segments cross each other. For
VAWTs, BWI and WWI have two major implications:
• On blades: BWI changes the local velocity field, which alters pressure distribution and
blade loading of downwind blades.
• On wakes: BWI and WWI cause local change of wake vorticity, which triggers the roll-up
of vortical structure.
Using moving interrogation windows the phenomenon of BWI and WWI were captured. Fig-
ure 6.8(a) displays the flow field at three time instances separated by 25◦ azimuthal angles
(corresponding to 5.2 ms). Blade crossing occurs at approximately θ = 185◦ and the box
in the bottom image highlights the wake segment influenced by the interaction. Different
wake segment can be distinguished by locations and intensities. Corresponding 2D simulation
results are presented in Figure 6.8(b). Comparing the location of the boxes shows that the
measured influenced region is more downwind and more inboard of the rotor.
To understand how BWI and WWI triggers the roll-up of vortical flow structure, the on path
circulation is computed. Figure 6.9 presents the results in 3D: the vorticity contour lies on
the 2D plane; the lower curve indicates the trajectory on which the circulation is evaluated;
and the height between the upper and lower curve represents the circulation strength. The
evaluation method is similar to the one introduced in Section 6.3.1.
Results show that circulation increase at the position of BWI. At the crossing point the
vorticity is transferred from the newly released vorticity sheet to the weaker wake segment,
creating a region of higher vorticity gradients. In case of BWI, the examined wake segment of
Figure 6.9 corresponds to the weak one. After crossing, the strengthened local vorticity field
leads to a counter-clockwise flow rotation, which rolls up the wake segment into large vortical
structures (i.e. shed vortices). The mechanism of WWI is similar although the intensity of
wake interaction is lower due to more diffused vorticity content.
6.4 Blade-wake and Wake-wake Interaction 35
(a) Experimental result (b) Numerical result
Figure 6.8: Illustration of Blade-Wake Interaction
Γ/(L u∞
)=0.63
Γ/(L u∞
)=0.25
(a) Experimental result
Γ/(L u∞
)=0.84
Γ/(L u∞
)=0.42
Γ/(L u∞
)=0.61
Γ/(L u∞
)=0.23
(b) Numerical result
Figure 6.9: Vorticity strengthening due to wake-wake interaction
36 2D Wake Dynamics
The measured circulation is generally lower than the simulation prediction, coherently with the
observations in Section 6.3. Simulation predicts multiple circulation peaks induced by BWI
or WWI, while the WWI induced circulation peak is almost undetectable in the measurement
results. This difference might be explained by the effect of viscous diffusion which reduces
wake strength and intensity of wake interaction. Moreover, the effect of diffusion tends
to remove strong vorticity gradients (results from wake interaction), leading to flattened
circulation peaks.
The number of circulation peaks has substantial impacts on the vortex roll-up downwind of the
rotor. Single circulation peak triggers single vortex roll-up, which produces concentrated shed
vortex in the experimental result (Figure 6.1(c)); in contrast, multiple peaks trigger vortex
roll-up at multiple spatial locations, which gives rise to a more scattered vortical structure in
the simulation result (Figure 6.2(c)).
6.5 Vortex Dynamics Along the Wake Boundary
Shed vortices are generated by BWIs and WWIs discussed in the last section. The down-
stream convections of the vortical structure have strong influences on the wake development
at horizontal planes. Vortex trajectory defines wake geometry, and induction of shed vorticity
is crucial to wake velocity field.
6.5.1 Determination of vortex core position and peak vorticity
(a) The cuts
1.1 1.15 1.2 1.25 1.3 1.35 1.4
−0.1
0
0.1
0.2
0.3
0.4
x/R
u
y
/u
∞
(b) uy along horizontal cut
1 1.1 1.2 1.3 1.4
−0.6
−0.5
−0.4
−0.3
−0.2
−0.1
0
0.1
y/R
ux
/u∞
(c) ux along vertical cut
Figure 6.10: Velocity distribution at vortex core
Important vortex properties include vortex core position, vortex core radius, vorticity distri-
bution, and vortex circulation strength. For studying time varying vortex properties, flow
measurements at different phase angles are required. With available phase-locked results, we
exploit the periodical wake characteristic to bypass the difficulty of not having phase varying
data. Assuming wake flow repeats itself every integer numbers of turbine rotational period T,
studying consecutive released vortices can be considered equivalent to the tracking of single
vortex over a sequence of time instances separated by T. Although this approach works well
with isolated vortex, it becomes less capable when connected vortices are encountered (see for
instance Figure 6.1(c) and Figure 6.2(c)). Interference of neighboring vortices makes the anal-
ysis sensitive to the definition of vortex domain. Consequently, the following analysis would
6.5 Vortex Dynamics Along the Wake Boundary 37
not focus on domain dependent properties such as vortex core radius and circulation strength,
instead, domain independent properties such as peak vorticity and vortex core position are
discussed.
Studying peak vorticity evolution allows a quantitative measurement of the change rate of
shed vorticity. An accurate determination of peak vorticity is, however, impeded by low
particle densities at the vortex core (due to centrifugal forces). To evaluate the effect of
reduced particles, velocity distributions is plot along a vertical cut and a horizontal cut passing
through the vortex core. The orthogonal cuts and corresponding velocity profiles are displayed
in Figure 6.10. Both profiles show continuous velocity distribution in the region between
velocity peaks, implying data quality of the vortex core is not significantly affected by the
reduction of particle density (probably due to relatively low vorticity). Similar results are
observed at other vortices.
1.1 1.15 1.2 1.25 1.3 1.35 1.4
−1.5
−1
−0.5
0
0.5
1
xpeak
x/R
ωz
c/u∞
(a) ωz along horizontal cut
1 1.1 1.2 1.3 1.4
−1.5
−1
−0.5
0
0.5
ypeak
y/R
ω
z
c/u
∞
ypeak
(b) ωz along vertical cut
Figure 6.11: Vorticity distribution at vortex core
Since vorticity is the strongest at vortex core, the vortex core location is assumed identical to
the location of the peak vorticity. Two methods are used to determine the location of the peak
vorticity. The first method makes use of the vorticity plot along the cuts of Figure 6.10(a).
Although the vorticity field is more oscillating, comparable oscillation amplitude between the
vortex core and the surrounding flow region suggests that the observed fluctuations are not a
result of low data quality but are induced by flow unsteadiness. Since it is difficult to match
the observed asymmetrical vorticity field with an axial-symmetrical vortex model, the vorticity
profile is fitted with a polynomial function (dashed line). The stream-wise and cross-stream
positions of the maximum vorticity correspond to the locations of peak vorticity in the x- and
y-direction. The second method determines the vortex core position (¯x, ¯y) by using weighted
average over an iso-vorticity contour:
¯x =
xi,jωi,jdA
ωi,jdA
, ¯y =
yi,jωi,jdA
ωi,jdA
(6.2)
Where ωi,j is the vorticity of vortex particle, xi,j and yi,j are spatial coordinates of the vortex
particle and dA is the pixel size.
In order to examine the sensitivity of the cutoff limit, different cutoff limits are tested. Results
show that the difference between two methods are negligible (maximum 1.6%). For simplicity,
the first method was used.
38 2D Wake Dynamics
Peak vorticity is determined by averaging the (absolute) maximum vorticity along two orthog-
onal cuts which pass through the vortex core.
6.5.2 Vortex trajectory and vortex pitch distance
Figure 6.12 displays a schematic of shed vortex positions downstream of the rotor. Two groups
of vortices are distinguished: the 1st, 3th and 5th vortices are released from one blade and the
2nd, 4th and 6th vortices are generated by the other blade. The × signs and ⋆ signs indicate the
position of vortex core in the windward and leeward sides respectively. Non-dimensionalized
vorticity field with an absolute cutoff limit of 0.3 is added to the background for reference.
Vortices of the same ID number show one-to-one correspondences between the simulation and
measured results. As discussed in Section 6.4, the simulated vorticity field is less concentrated
due to multiple vortex roll-ups.
−1 0 1 2 3 4
−1.5
−1
−0.5
0
0.5
1
1.5
wind
x/R
y/R
ωz
c/u∞
−1.2
−0.8
−0.4
0
0.4
0.8
1.2
2 3 4 5 6
2
43
1
5 6
(a) Experimental results
−1 0 1 2 3 4
−1.5
−1
−0.5
0
0.5
1
1.5
wind
x/R
y/R
ωz
c/u∞
−1.2
−0.8
−0.4
0
0.4
0.8
1.2
21 3 4 5
21
3 4 65
(b) Simulation results
Figure 6.12: Schematics of vortex core center
Vortex convective velocity is measured by the variation of vortex pitch, which is defined
as the distance that a vortex is transported during one blade rotation. Assuming vortices
released from two blades are identical, the average distances of neighboring vortices are used
to compute vortex pitch in half rotation. The vortex pitches are plotted at the midpoints
of neighboring vortices (Figure 6.13). The measured vortex pitches are comparable at two
sides of the rotor, whereas the simulation predicted vortex pitches are larger at the windward
side. Higher wake velocity (see Section 6.8.1) yields the simulation predicted pitch distance
generally larger than the measured one.
The plot of cross-stream vortex pitch (Figure 6.13(b)) shows that the outboard vortex motion
is faster at the windward side. With increasing downstream distance, the pitch distance
reduces with the slowing down of wake expansion. Results show reasonable agreement between
the measurement and the simulation at the leeward side, while the discrepancy is large at
the windward side. Stronger windward expansion explains the larger pitch distance in the
experimental results.
6.5 Vortex Dynamics Along the Wake Boundary 39
1 1.5 2 2.5 3 3.5 4
0.4
0.5
0.6
0.7
0.8
x/R
ux
/u∞ windward, EXP
leeward, EXP
windward, SIM
leeward, SIM
(a) Stream-wise pitch
1 1.5 2 2.5 3 3.5 4
−0.2
−0.1
0
0.1
0.2
x/R
u
y
/u
∞
windward, EXP
leeward, EXP
windward, SIM
leeward, SIM
(b) Cross-wise pitch
Figure 6.13: Vortex pitch
6.5.3 Evolution of peak vorticity
The vorticity variation is determined by the combined effect of vortex roll-up and viscous. In
the near wake, the roll-up of inboard released vortex particles locally strengthens the vortex
circulation; but the roll-up does not necessarily increase the vorticity of individual vortex par-
ticle. For instance, if weaker vortex particle is rolled into the vortex core, the total circulation
will increase but the mean vorticity will decrease. In the meanwhile, strong velocity gradients
are removed by viscosity, resulting in a reduced vorticity peak and an expanded vortex core.
Vorticity is further reduced by the turbulent diffusion through flow mixing and kinetic energy
cascade. The growing magnitude of turbulent diffusion is demonstrated in the standard devi-
ation plot of Figure 6.14. As shown, the influence of turbulence is low in the near wake but
grows rapidly with increasing x/R. Comparing two sides of the rotor, the turbulence induced
uncertainty is stronger at the windward side. Although turbulence diffusion scheme is not
explicitly included in the simulation, the propagation of small numerical error resembles the
growing effect of turbulence diffusion.
Figure 6.14: RMS of absolute velocity
Figure 6.15 illustrates the variation of peak vorticity in the stream-wise direction. Negative
40 2D Wake Dynamics
windward vorticity is shown in red and the positive leeward vorticity is shown in blue. The error
bars represent the uncertainty in estimating the phase-averaged results using instantaneous
measurements (based on Figure 6.14).
The windward and leeward measured shed vorticity have comparable strength just released
from the rotor, but their downstream evolution becomes different. Vorticity of windward side
increases from x/R = 1.5 to x/R = 2.3, suggesting viscous diffusion is locally overcome by
vortex roll-up. Further downstream, the roll-up strength decreases and vorticity decays under
diffusion. Overall, peak vorticity reduces to 30% of its original strength (at x/R = 1.3) at
3.6R behind the rotor. The decay of leeward vorticity is almost linear, resulting in a total
vorticity decrease of 70% at 3.5R behind the rotor. Interestingly, decay rate downstream of
x/R = 2.3 is approximately the same between the windward and the leeward sides.
0.5 1 1.5 2 2.5 3 3.5 4
−2.5
−2
−1.5
−1
−0.5
0
0.5
1
1.5
2
2.5
x/R
Peakvorticityωz
c/u∞
windward, EXP
leeward, EXP
windward, SIM
leeward, SIM
Figure 6.15: Peak vorticity distribution
The differences between experimental and simulation results are large. At the windward side
the simulation predicted peak vorticity is in average 40% lower than the measured result;
whereas at the leeward side the simulation overestimates the vorticity by 15%. This discrep-
ancy might be explained by different wake expansion pattern that will be discussed in detail in
Section 6.7. In the experiment, the windward deflected wake squeezes the shear layer along the
wake boundary, resulting in an increased velocity gradient hence a locally enhanced vorticity
field; conversely, the stretched leeward shear layer causes a decrease of vorticity. Examining
Figure 6.1(a) it is clear that the windward shear layer is thinner than the leeward one. Since
the simulation predicts an opposite wake expansion pattern, the squeezing and stretching
effects are reversed.
As shown in Figure 6.15, the rate of vorticity decay are almost identical at the two sides of
the rotor. The numerical simulation underestimates the decay rate by 10%, which might be
traced back to the absence of diffusion scheme.
6.6 Wake Circulation
Due to the difficulty of specifying vortex domains, circulations of a bound vortex contour is
not computed; instead, the circulation of equally spaced sub-domains moving downstream is
6.7 Wake Geometry 41
evaluated. Circulation at windward (y/R > 0) and leeward (y/R < 0) regions are derived
separately.
Figure 6.16(a) displays the wake circulation as a function of the stream-wise position x/R.
Results show strong fluctuations near vortex cores, which reduces with increasing downstream
distance. Detailed differences between the experimental and the simulation results (e.g. the
shift of stream-wise peak circulation, etc.) are consistent with the discussion of vortex dy-
namics in the last section.
To reduce vortex induced fluctuations, accumulated circulation is plotted. In Figure 6.16(b),
the value at a certain x/R corresponds to the total circulation summed over all sub-domains
upstream of this position. Linear circulation increase are observed at both sides of the rotor,
which implies the total circulation is conserved. Results from the 2D simulation show a similar
evolution trend but it overestimates the circulation by 10%.
Summing up the windward and leeward wake circulation, the total circulation is represented
by the black curves in Figure 6.16(b). As seen, the total wake circulation is conserved and
equals to zero. Since the circulation of the complete rotor system (rotor+wake) is zero, this
observation implies the circulation of the rotor is zero.
1 1.5 2 2.5 3 3.5 4
−2.5
−2
−1.5
−1
−0.5
0
0.5
1
1.5
2
2.5
x/R
Γ
z
/Lu
∞
windward, EXP
leeward, EXP
windward, SIM
leeward, SIM
(a) Circulation
1 1.5 2 2.5 3 3.5 4
−1.5
−1
−0.5
0
0.5
1
1.5
x/R
Γz
/Lu∞
windward, EXP
leeward, EXP
windward+leeward, EXP
windward, SIM
leeward, SIM
windward+leeward, SIM
(b) Accumulated circulation
Figure 6.16: Wake circulation
6.7 Wake Geometry
Wake geometry defines global wake shape and provides important reference scale for wind
farm designs. Conventionally wake geometry is defined by using streamline that corresponds
to certain velocity cutoff or by using vortex trajectory [41]. Determining streamlines requires
time-averaged results which are not available to the current study, thus the following context
analyzes the horizontal wake geometry based on the convective trajectory of shed vortices.
Figure 6.17 displays the wake geometry obtained by least square fitting of vortex core positions.
For reference the streamline that corresponds to 99% free-stream velocity of time-averaged
simulation results is added to the plot. Both experimental and simulation results show the
42 2D Wake Dynamics
−1 0 1 2 3 4
−1.5
−1
−0.5
0
0.5
1
1.5
x/R
y/R
wind
Exp
SIM
SIM, 99% u
∞
streamline
Figure 6.17: Schematics of the wake geometry
horizontal wake expansion as a result of energy extraction. In comparison the experiment
observes a faster expansion at the windward side while the simulation predicts a more sym-
metrical expansion. In average the measured wake expansion angle is 8◦ at the windward side
and 5◦ at the leeward side. The corresponding simulation predicted expansion angles are 4◦
and 5◦ respectively.
Comparing with the wake geometry defined by the streamline, the geometry obtained using
vortex trajectory lies slightly inboard since vortex induction increases the stream-wise velocity
outboard of the vortex core.
The asymmetrical wake expansion is also demonstrated in the wake centerline plot of Fig-
ure 6.18(a). The measured wake centerline lies around y/R = 0.1 and moves towards the
windward side with an angle of circa 0.7◦. In contrast the simulation predicted wake center-
line, which lies close to y/R = 0, shifts windward with an angle of 0.3◦. This observation is
consistent with the asymmetric wake expansion discussed above.
The presence of the turbine tower is probably the main cause of measured asymmetrical
wake expansion. In Figure 6.1(a), tower wake is represented by the yellow expanding region
behind the turbine tower. With flow passing the rotating tower, a leeward pointing lift force
is generated; the reaction of this force deflects the tower wake to the windward side of the
rotor, which steers the expansion of turbine wake to the same side.
To analyze global wake expansion, the cross-stream wake diameter Dw is computed. As
shown in Figure 6.18(b), the measured wake diameter increases 41% at 3.5R downstream of
the turbine, whereas the wake diameter predicted by the simulation increases 35% at the same
downstream distance. Since wake expansion is a direct consequence of energy extraction, the
faster measured wake expansion is most probably attributed to the larger velocity deficit that
will be discussed in the next section.
6.8 Induction and Wake Velocity Profile 43
1.5 2 2.5 3 3.5
−0.4
−0.2
0
0.2
0.4
x/R
Wakecenterlinepositiony/R
EXP
SIM
(a) Wake centerline position
1 1.5 2 2.5 3 3.5
1
1.2
1.4
x/R
WakediameterDw
/2R
EXP
SIM
(b) Wake diameter
Figure 6.18: Wake geometry
6.8 Induction and Wake Velocity Profile
Knowledge of wake inductions and wake velocity profiles is crucial to the understanding of
wake recovery of a wind turbine. According to Kinze [25], VAWTs exhibit favorable velocity
recovery characteristics in comparison to similar sized HAWTs. In the following section,
we testify this statement by investigating stream-wise wake velocity profiles in the mid-span
plane of the turbine model. The cross-stream velocity profile is also discussed to facilitate the
understanding of asymmetrical wake expansion.
Comparing with time-averaged results the phase-locked wake velocity profiles are more im-
portant for VAWTs. First, cyclic blade loading and extreme loading conditions of downwind
rotors are determined by the instantaneous wake velocity of upwind rotors. Second, the kinetic
energy perceived by the downwind rotor is time varying. Decomposition the time dependent
flow into mean, periodic and randomly fluctuating components [21], it can be shown that
the kinetic energy of the time dependent flow is usually higher than the kinetic energy of the
mean flow.
6.8.1 Stream-wise velocity profiles
Figure 6.19(a) shows the stream-wise wake velocity profiles at 6 positions x/R =1.5, 2.0, 2.5,
3.0, 3.5, and 4.0. The results of phase-locked 2D simulation are plotted in Figure 6.19(b).
The measured stream-wise velocity profiles are non-symmetric with respect to y/R = 0. Faster
windward expansion shifts the velocity profiles to the windward side. Between y/R = −0.7
and y/R = 0.9, velocity deficits are high and velocity gradients dux
dy are low; outboard of this
region ux increases rapidly. The shapes of the phase-locked velocity profile are similar to all
stream-wise positions. Along the shed vortex trajectory, vortex induced fluctuations are visible
at the windward region from y/R = 0.5 to y/R = 1.2 and leeward region from y/R = −0.8
to y/R = −1.0. In the stream-wise direction, the influence of vortex induction diminishes and
the velocity profiles become smoother with increasing x/R.
The simulation result shows a more symmetrical profile. The maximum velocity deficit is
found at y/R = −0.2 and remains at this position with increasing downstream distance.
The peak velocity deficit, a non-dimensional number defined by 1 − uxmin /u∞, is presented
in Figure 6.20. The figure shows no indication of wake recovery until 4R downstream of the
44 2D Wake Dynamics
0 0.2 0.4 0.6 0.8 1
−1.5
−1
−0.5
0
0.5
1
1.5
u
x
/u
∞
y/R
x/R=1.5
x/R=2.0
x/R=2.5
x/R=3.0
x/R=3.5
x/R=4.0
(a) Experimental results
0 0.2 0.4 0.6 0.8 1
−1.5
−1
−0.5
0
0.5
1
1.5
u
x
/u
∞
y/R
x/R=1.5
x/R=2.0
x/R=2.5
x/R=3.0
x/R=3.5
x/R=4.0
(b) Simulation results
Figure 6.19: Phase-locked stream-wise velocity profile
turbine. The peak deficits predicted by the 2D simulation are in average 20% lower than the
experimental observed values.
1.5 2 2.5 3 3.5 4
50
60
70
80
90
100
x/R
Peakvelocitydeficit[100%]
EXP
SIM
Figure 6.20: Peak velocity deficit of horizontal mid-span plane
To understand aforementioned observations, the variation of wake velocity behind a generalized
wind turbine is plotted in Figure 6.21. Immediately behind the rotor, wake velocity decreases
as a result of energy extraction. Wake velocity reaches its minimum of (1 − 2a)u∞ at xcrit,
with a being the flow induction factor. Further downstream, flow re-energirization takes place
and the wake velocity starts to recover. The observed growing wake deficit suggests that wake
recovery has not yet started until x/R = 4.0.
The discrepancy of the measured and the simulation results might be traced to two possible
sources:
• Wake of the turbine tower
• Absence of tip vortex induction in 2D simulation
As already mentioned in Section 6.7, the presence of the rotating turbine tower is an important
cause of wake asymmetry, thus it also contributes to the asymmetrical velocity distribution
in Figure 6.19(a). Additionally, the downwind transport of the tower wake also reduces the
wake velocity along its path.
6.8 Induction and Wake Velocity Profile 45
x
ux
xcrit
Turbine
plane
(1-2a)u∞
Figure 6.21: Schematic of wake stream-wise velocity distribution
In the 2D simulations, the wake velocity at the mid-span horizontal plane is solely determined
by the induction of in-plane shed vorticity. In reality the wake velocity is also influenced by the
induction of tip vortex in the vertical direction. Tip vortex induction within the rotor swept
area has been discussed in [36], demonstrating it a main cause of stronger velocity deficit
in 3D. Behind the rotor, the situation is similar. As will be discussed in Section 7.3.1, tip
vortices are distributed along convex and concave vortex tubes as shown in Figure 6.22; the
induction of these tubes produces negative components of stream-wise induction, leading to
larger velocity deficit at the turbine mid-span plane.
Concave tip
vortex tube
Convex tip
vortex tube
H-rotor
Induction
ω
Figure 6.22: Schematics 3D induction due to tip vortex
Although wake recovery is not observed at the turbine mid-span plane, the other span-wise
positions might experience a different flow recovery rate. Wake recovery in the vertical di-
rection might also be different due to the inherent rotor asymmetry (Section 7.4). 2D wake
simulation until 16R downwind of the rotor (Figure 6.23) shows that wake expansion stops
at approximately x/R = 6, which implies wake recovery starts after this distance.
6.8.2 Cross-stream velocity profiles
Figure 6.24 shows the phase-locked velocity profiles of cross-stream velocity uy. Comparing
with the stream-wise velocity profiles, velocity fluctuations are stronger; the strongest fluctu-
ations are found at the most upstream station of x/R = 1.5 and the fluctuations magnitude
decrease with increasing x/R. Velocity fluctuations 4R behind the rotor are almost negligible.
46 2D Wake Dynamics
Figure 6.23: Simulated wake development until 16R downwind of the turbine
It is visible that the positive uy dominates the windward region with its influence further
extended to the leeward region; small regions of negative uy is only observed to the most
leeward side of the rotor. The cross-stream position of zero uy shifts windward due to non-
symmetrical wake expansion. With increasing x/R, the magnitude of cross-stream induction
reduces.
The velocity distribution is more asymmetrical in the simulation result. Zero cross-stream
velocity is observed near the turbine axial plane at y/R = 0.1. Comparing the velocity profiles
at the most downstream position of x/R = 4.0 shows that the simulation predicted uy is
lower at the windward side and is higher at the leeward side, which is consistent with the
cross-stream vortex pitch discussed in Section 6.5.2.
−0.15 −0.1 −0.05 0 0.05 0.1 0.15
−1.5
−1
−0.5
0
0.5
1
1.5
uy
/u∞
y/R
x/R=1.5
x/R=2.0
x/R=2.5
x/R=3.0
x/R=3.5
x/R=4.0
(a) Experimental results
−0.15 −0.1 −0.05 0 0.05 0.1 0.15
−1.5
−1
−0.5
0
0.5
1
1.5
uy
/u∞
y/R
x/R=1.5
x/R=2.0
x/R=2.5
x/R=3.0
x/R=3.5
x/R=4.0
(b) Simulation results
Figure 6.24: Cross-stream velocity profile
Chapter 7
3D Wake Dynamics
The release and downstream convection of tip vortices are crucial to the 3D wake development
of an H-type VAWT. Tip vortex motions in the xz-plane define wake geometry in the vertical
direction, whereas the variations of tip vorticity, among other factors, determine induction
fields in 3D. Blade-vortex interactions at the downwind blade passage cause unsteady blade
loading and are important sources of noise generation. In this chapter, we examine 3D wake
dynamics with the focus on tip vortex dynamics and non-symmetric wake distribution. The
following aspects are addressed:
• Azimuthal variation of tip vortex strength (section 7.2.1)
• Tip vortex motion in the vertical xz-plane (section 7.2.3)
• Stream-wise tip vorticity decay (section 7.2.4)
• 3D wake geometry (section 7.3)
• Stream-wise wake velocity profile in the xz-plane (section 7.4)
The experimental results and preliminary observations are presented in Section 7.1.
7.1 Experimental Results
Figure 7.1 shows the 3D phase-locked measurement results at 7 cross-stream positions of
y/R=+1.0, +0.8, +0.4, 0, -0.4, -0.8, -1.0. To minimize light blockage, velocity fields were
acquired with the blades at the most windward/leeward positions. Figure 7.1(a), Figure 7.1(b)
and Figure 7.1(c) display the contour plots of stream-wise velocity ux , cross-stream velocity uy
and span-wise velocity uz respectively, all defined according to Figure 3.1. The vorticity con-
tour ωy is presented in Figure 7.1(d). Spatial coordinates x, y and z are non-dimensionalized
using rotor radius R or blade span H; velocity and vorticity are non-dimensionalized similar
to the 2D results. Blades, struts and tower are indicated in black, and shadow-blocked areas
are blanked.
47
48 3D Wake Dynamics
Wind
Wind
Wind
Wind
Wind
Wind
Wind
(a) Non-dimensionalized stream-wise velocity
7.1 Experimental Results 49
Wind
Wind
Wind
Wind
Wind
Wind
Wind
(b) Non-dimensionalized cross-stream velocity
50 3D Wake Dynamics
Wind
Wind
Wind
Wind
Wind
Wind
Wind
(c) Non-dimensionalized vertical velocity
7.1 Experimental Results 51
Wind
Wind
Wind
Wind
Wind
Wind
Wind
(d) Non-dimensionalized cross-stream vorticity
Figure 7.1: Contour of wake velocity and wake vorticity, 3D phase-locked experimental
results
52 3D Wake Dynamics
Tip vortices are represented by the deep blue regions in Figure 7.1(d). Almost circular tip
vortices are observed close to the turbine axial plane; moving outboard tip vortex is stretched
due to increasing misalignment between the axis of the vortex core and the normal of the
measurement plane. The vorticity plot clearly shows inboard tip vortex motions near y/R = 0
and outboard tip vortex motions at two sides of the rotor. At y/R=+0.4, 0, -0.4, -0.8, the
release and roll-up of the downwind tip vortice are visible. Both upwind and the downwind tip
vortices have negative vorticity, rotating clock-wisely seen from the leeward side. Tip vortex
deforms along its downstream convection.
The previously mentioned misalignment also influences the observed cross-stream velocity
(Figure 7.1(b)). Considering a windward vortex tube at the upwind part (Figure 7.2), due to
the misalignment angle ψ, the induced velocity on the top side of the tube has a negative
y-component, and the induced velocity at the bottom side has a positive y-component. At
the windward side (y/R = +1.0, +0.8, +0.4), these two velocity components result in a blue
region on the top and an orange region at the bottom. At the leeward side, the situation is
reversed. Since the velocity component in the y-direction increases with misalignment angle,
the deepest blue and the deepest orange vortex regions are observed at the most windward and
leeward sides of the rotor. The sign of vertical velocity uz alternates due to vortex induction.
x
y
x
y
yx
z
u+y
u-y
y
z
u+y
u+y
u-y
u-y
x
xz
y
u+y
u-y
xz
y
Windward
Leeward
ψ
ψ
Figure 7.2: Illustration of the influence of misalignment angle on uy
The cross-stream velocity plot (Figure 7.1(b)) also shows the wake of vertical turbine blades
and horizontal struts. The blade wake is represented by the red vertical wake segments behind
the blade, and the struts wake corresponds to the horizontal wake region released around the
struts height (z/H = 0.3).
MSc_Thesis_Wake_Dynamics_Study_of_an_H-type_Vertical_Axis_Wind_Turbine

Más contenido relacionado

La actualidad más candente

CDR General Report
CDR General ReportCDR General Report
CDR General ReportElya Pardes
 
Efficient Model-based 3D Tracking by Using Direct Image Registration
Efficient Model-based 3D Tracking by Using Direct Image RegistrationEfficient Model-based 3D Tracking by Using Direct Image Registration
Efficient Model-based 3D Tracking by Using Direct Image RegistrationEnrique Muñoz Corral
 
A Three Dimensional Vortex Particle-Panel Code For Modeling Prope
A Three Dimensional Vortex Particle-Panel Code For Modeling PropeA Three Dimensional Vortex Particle-Panel Code For Modeling Prope
A Three Dimensional Vortex Particle-Panel Code For Modeling PropeJacob Calabretta
 
The Cellular Automaton Interpretation of Quantum Mechanics
The Cellular Automaton Interpretation of Quantum MechanicsThe Cellular Automaton Interpretation of Quantum Mechanics
The Cellular Automaton Interpretation of Quantum MechanicsHunter Swart
 
Anwar_Shahed_MSc_2015
Anwar_Shahed_MSc_2015Anwar_Shahed_MSc_2015
Anwar_Shahed_MSc_2015Shahed Anwar
 
Durlav Mudbhari - MSME Thesis
Durlav Mudbhari - MSME ThesisDurlav Mudbhari - MSME Thesis
Durlav Mudbhari - MSME ThesisDurlav Mudbhari
 
Seismic Tomograhy for Concrete Investigation
Seismic Tomograhy for Concrete InvestigationSeismic Tomograhy for Concrete Investigation
Seismic Tomograhy for Concrete InvestigationAli Osman Öncel
 
Antenna study and design for ultra wideband communications apps
Antenna study and design for ultra wideband communications appsAntenna study and design for ultra wideband communications apps
Antenna study and design for ultra wideband communications appsvaldesc
 
Lecture notes-in-structural-engineering-analysis-design
Lecture notes-in-structural-engineering-analysis-designLecture notes-in-structural-engineering-analysis-design
Lecture notes-in-structural-engineering-analysis-designJuhi Shah
 
Efficiency Optimization of Realtime GPU Raytracing in Modeling of Car2Car Com...
Efficiency Optimization of Realtime GPU Raytracing in Modeling of Car2Car Com...Efficiency Optimization of Realtime GPU Raytracing in Modeling of Car2Car Com...
Efficiency Optimization of Realtime GPU Raytracing in Modeling of Car2Car Com...Alexander Zhdanov
 

La actualidad más candente (19)

BenThesis
BenThesisBenThesis
BenThesis
 
Sarda_uta_2502M_12076
Sarda_uta_2502M_12076Sarda_uta_2502M_12076
Sarda_uta_2502M_12076
 
CDR General Report
CDR General ReportCDR General Report
CDR General Report
 
Shu thesis
Shu thesisShu thesis
Shu thesis
 
Efficient Model-based 3D Tracking by Using Direct Image Registration
Efficient Model-based 3D Tracking by Using Direct Image RegistrationEfficient Model-based 3D Tracking by Using Direct Image Registration
Efficient Model-based 3D Tracking by Using Direct Image Registration
 
A Three Dimensional Vortex Particle-Panel Code For Modeling Prope
A Three Dimensional Vortex Particle-Panel Code For Modeling PropeA Three Dimensional Vortex Particle-Panel Code For Modeling Prope
A Three Dimensional Vortex Particle-Panel Code For Modeling Prope
 
The Cellular Automaton Interpretation of Quantum Mechanics
The Cellular Automaton Interpretation of Quantum MechanicsThe Cellular Automaton Interpretation of Quantum Mechanics
The Cellular Automaton Interpretation of Quantum Mechanics
 
Jung.Rapport
Jung.RapportJung.Rapport
Jung.Rapport
 
feilner0201
feilner0201feilner0201
feilner0201
 
978 1-4615-6311-2 fm
978 1-4615-6311-2 fm978 1-4615-6311-2 fm
978 1-4615-6311-2 fm
 
Anwar_Shahed_MSc_2015
Anwar_Shahed_MSc_2015Anwar_Shahed_MSc_2015
Anwar_Shahed_MSc_2015
 
Durlav Mudbhari - MSME Thesis
Durlav Mudbhari - MSME ThesisDurlav Mudbhari - MSME Thesis
Durlav Mudbhari - MSME Thesis
 
Seismic Tomograhy for Concrete Investigation
Seismic Tomograhy for Concrete InvestigationSeismic Tomograhy for Concrete Investigation
Seismic Tomograhy for Concrete Investigation
 
Antenna study and design for ultra wideband communications apps
Antenna study and design for ultra wideband communications appsAntenna study and design for ultra wideband communications apps
Antenna study and design for ultra wideband communications apps
 
Lecture notes-in-structural-engineering-analysis-design
Lecture notes-in-structural-engineering-analysis-designLecture notes-in-structural-engineering-analysis-design
Lecture notes-in-structural-engineering-analysis-design
 
thesis
thesisthesis
thesis
 
MastersThesis
MastersThesisMastersThesis
MastersThesis
 
phd-thesis
phd-thesisphd-thesis
phd-thesis
 
Efficiency Optimization of Realtime GPU Raytracing in Modeling of Car2Car Com...
Efficiency Optimization of Realtime GPU Raytracing in Modeling of Car2Car Com...Efficiency Optimization of Realtime GPU Raytracing in Modeling of Car2Car Com...
Efficiency Optimization of Realtime GPU Raytracing in Modeling of Car2Car Com...
 

Destacado

Vortex lattice modelling of winglets on wind turbine blades
Vortex lattice modelling of winglets on wind turbine bladesVortex lattice modelling of winglets on wind turbine blades
Vortex lattice modelling of winglets on wind turbine bladesDickdick Maulana
 
marco aleman visual resume
marco aleman visual resumemarco aleman visual resume
marco aleman visual resumeMarco Aleman
 
Parables of the Seekers of Forgiveness
Parables of the Seekers of ForgivenessParables of the Seekers of Forgiveness
Parables of the Seekers of ForgivenessAhmed@3604
 
performance evaluation of mhd renewable energy source for electric power gene...
performance evaluation of mhd renewable energy source for electric power gene...performance evaluation of mhd renewable energy source for electric power gene...
performance evaluation of mhd renewable energy source for electric power gene...EECJOURNAL
 
La ubicación del problema en que y para que intervenir
La ubicación del problema en que y para que intervenirLa ubicación del problema en que y para que intervenir
La ubicación del problema en que y para que intervenirLidio Avena
 
BUG July 2011 Microtalks
BUG July 2011 MicrotalksBUG July 2011 Microtalks
BUG July 2011 MicrotalksBoston Indes
 
Bladeless wind mill ppt BY KADIYAM SUNEEL
Bladeless wind mill ppt BY KADIYAM SUNEELBladeless wind mill ppt BY KADIYAM SUNEEL
Bladeless wind mill ppt BY KADIYAM SUNEELsuneelkadium
 
Bladeless wind turbine
Bladeless wind turbineBladeless wind turbine
Bladeless wind turbineRevathi C
 
Blade-less Wind Turbine
Blade-less Wind TurbineBlade-less Wind Turbine
Blade-less Wind TurbineNeel Patel
 
Seminar Report on MHD (Magneto Hydro Dynamics)
Seminar Report on MHD (Magneto Hydro Dynamics)Seminar Report on MHD (Magneto Hydro Dynamics)
Seminar Report on MHD (Magneto Hydro Dynamics)Ravi Anand
 
Tesla bladeless turbine
Tesla bladeless turbineTesla bladeless turbine
Tesla bladeless turbineRajeshwera
 
Case Study of MHD Generator for Power Generation and High Speed Propulsion
Case Study of MHD Generator for Power Generation and High  Speed PropulsionCase Study of MHD Generator for Power Generation and High  Speed Propulsion
Case Study of MHD Generator for Power Generation and High Speed PropulsionIJMER
 
Magneto hydro-dynamic-power-generation-mhd
Magneto hydro-dynamic-power-generation-mhdMagneto hydro-dynamic-power-generation-mhd
Magneto hydro-dynamic-power-generation-mhdAnkur Mahajan
 
Unidad educativa municipal
Unidad educativa municipalUnidad educativa municipal
Unidad educativa municipalEvelyn Mireya
 
Comercio interior del libro en España 2010
Comercio interior del libro en España 2010Comercio interior del libro en España 2010
Comercio interior del libro en España 2010conectarc
 

Destacado (20)

Vortex lattice modelling of winglets on wind turbine blades
Vortex lattice modelling of winglets on wind turbine bladesVortex lattice modelling of winglets on wind turbine blades
Vortex lattice modelling of winglets on wind turbine blades
 
marco aleman visual resume
marco aleman visual resumemarco aleman visual resume
marco aleman visual resume
 
Parables of the Seekers of Forgiveness
Parables of the Seekers of ForgivenessParables of the Seekers of Forgiveness
Parables of the Seekers of Forgiveness
 
ntpc
ntpcntpc
ntpc
 
performance evaluation of mhd renewable energy source for electric power gene...
performance evaluation of mhd renewable energy source for electric power gene...performance evaluation of mhd renewable energy source for electric power gene...
performance evaluation of mhd renewable energy source for electric power gene...
 
Ingeniería jp&ca
Ingeniería jp&caIngeniería jp&ca
Ingeniería jp&ca
 
La ubicación del problema en que y para que intervenir
La ubicación del problema en que y para que intervenirLa ubicación del problema en que y para que intervenir
La ubicación del problema en que y para que intervenir
 
6. Chapters
6. Chapters6. Chapters
6. Chapters
 
BUG July 2011 Microtalks
BUG July 2011 MicrotalksBUG July 2011 Microtalks
BUG July 2011 Microtalks
 
Bladeless wind mill ppt BY KADIYAM SUNEEL
Bladeless wind mill ppt BY KADIYAM SUNEELBladeless wind mill ppt BY KADIYAM SUNEEL
Bladeless wind mill ppt BY KADIYAM SUNEEL
 
Bladeless wind turbine
Bladeless wind turbineBladeless wind turbine
Bladeless wind turbine
 
Blade-less Wind Turbine
Blade-less Wind TurbineBlade-less Wind Turbine
Blade-less Wind Turbine
 
Seminar Report on MHD (Magneto Hydro Dynamics)
Seminar Report on MHD (Magneto Hydro Dynamics)Seminar Report on MHD (Magneto Hydro Dynamics)
Seminar Report on MHD (Magneto Hydro Dynamics)
 
Tesla bladeless turbine
Tesla bladeless turbineTesla bladeless turbine
Tesla bladeless turbine
 
Case Study of MHD Generator for Power Generation and High Speed Propulsion
Case Study of MHD Generator for Power Generation and High  Speed PropulsionCase Study of MHD Generator for Power Generation and High  Speed Propulsion
Case Study of MHD Generator for Power Generation and High Speed Propulsion
 
Magneto hydro-dynamic-power-generation-mhd
Magneto hydro-dynamic-power-generation-mhdMagneto hydro-dynamic-power-generation-mhd
Magneto hydro-dynamic-power-generation-mhd
 
Unidad educativa municipal
Unidad educativa municipalUnidad educativa municipal
Unidad educativa municipal
 
Comercio interior del libro en España 2010
Comercio interior del libro en España 2010Comercio interior del libro en España 2010
Comercio interior del libro en España 2010
 
Fabula
FabulaFabula
Fabula
 
Fisica
FisicaFisica
Fisica
 

Similar a MSc_Thesis_Wake_Dynamics_Study_of_an_H-type_Vertical_Axis_Wind_Turbine

MSc_Thesis_ORR
MSc_Thesis_ORRMSc_Thesis_ORR
MSc_Thesis_ORROscar Ram
 
NUMERICAL SIMULATION OF FLOW THROUGH
NUMERICAL SIMULATION OF FLOW THROUGHNUMERICAL SIMULATION OF FLOW THROUGH
NUMERICAL SIMULATION OF FLOW THROUGHHassan El Sheshtawy
 
MSc Thesis - Jaguar Land Rover
MSc Thesis - Jaguar Land RoverMSc Thesis - Jaguar Land Rover
MSc Thesis - Jaguar Land RoverAkshat Srivastava
 
Optimization and prediction of a geofoam-filled trench in homogeneous and lay...
Optimization and prediction of a geofoam-filled trench in homogeneous and lay...Optimization and prediction of a geofoam-filled trench in homogeneous and lay...
Optimization and prediction of a geofoam-filled trench in homogeneous and lay...Mehran Naghizadeh
 
Coupled thermal fluid analysis with flowpath-cavity interaction in a gas turb...
Coupled thermal fluid analysis with flowpath-cavity interaction in a gas turb...Coupled thermal fluid analysis with flowpath-cavity interaction in a gas turb...
Coupled thermal fluid analysis with flowpath-cavity interaction in a gas turb...Nathan Fitzpatrick
 
NEW METHODS FOR TRIANGULATION-BASED SHAPE ACQUISITION USING LASER SCANNERS.pdf
NEW METHODS FOR TRIANGULATION-BASED SHAPE ACQUISITION USING LASER SCANNERS.pdfNEW METHODS FOR TRIANGULATION-BASED SHAPE ACQUISITION USING LASER SCANNERS.pdf
NEW METHODS FOR TRIANGULATION-BASED SHAPE ACQUISITION USING LASER SCANNERS.pdfTrieuDoMinh
 
Computer Graphics Notes.pdf
Computer Graphics Notes.pdfComputer Graphics Notes.pdf
Computer Graphics Notes.pdfAOUNHAIDER7
 
Capstone Final Report
Capstone Final ReportCapstone Final Report
Capstone Final ReportVaibhav Menon
 
Experimental Investigation of Optimal Aerodynamics of a Flying Wing UAV(Link)
Experimental Investigation of Optimal Aerodynamics of a Flying Wing UAV(Link)Experimental Investigation of Optimal Aerodynamics of a Flying Wing UAV(Link)
Experimental Investigation of Optimal Aerodynamics of a Flying Wing UAV(Link)Baba Kakkar
 
Multidimensional optimal droop control for wind resources in dc m 2
Multidimensional optimal droop control for wind resources in dc m 2Multidimensional optimal droop control for wind resources in dc m 2
Multidimensional optimal droop control for wind resources in dc m 2vikram anand
 
RFP_2016_Zhenjie_CEN
RFP_2016_Zhenjie_CENRFP_2016_Zhenjie_CEN
RFP_2016_Zhenjie_CENZhenjie Cen
 
LChen_diss_Pitt_FVDBM
LChen_diss_Pitt_FVDBMLChen_diss_Pitt_FVDBM
LChen_diss_Pitt_FVDBMLeitao Chen
 
Fulltext01
Fulltext01Fulltext01
Fulltext01Ngoc Ngk
 
Nonlinear Simulation of Rotor-Bearing System Dynamics
Nonlinear Simulation of Rotor-Bearing System DynamicsNonlinear Simulation of Rotor-Bearing System Dynamics
Nonlinear Simulation of Rotor-Bearing System DynamicsFrederik Budde
 

Similar a MSc_Thesis_Wake_Dynamics_Study_of_an_H-type_Vertical_Axis_Wind_Turbine (20)

MSc_Thesis_ORR
MSc_Thesis_ORRMSc_Thesis_ORR
MSc_Thesis_ORR
 
NUMERICAL SIMULATION OF FLOW THROUGH
NUMERICAL SIMULATION OF FLOW THROUGHNUMERICAL SIMULATION OF FLOW THROUGH
NUMERICAL SIMULATION OF FLOW THROUGH
 
MSc Thesis - Jaguar Land Rover
MSc Thesis - Jaguar Land RoverMSc Thesis - Jaguar Land Rover
MSc Thesis - Jaguar Land Rover
 
Optimization and prediction of a geofoam-filled trench in homogeneous and lay...
Optimization and prediction of a geofoam-filled trench in homogeneous and lay...Optimization and prediction of a geofoam-filled trench in homogeneous and lay...
Optimization and prediction of a geofoam-filled trench in homogeneous and lay...
 
Cliff sugerman
Cliff sugermanCliff sugerman
Cliff sugerman
 
MS Thesis ShashiprakashSingh
MS Thesis ShashiprakashSinghMS Thesis ShashiprakashSingh
MS Thesis ShashiprakashSingh
 
thesis
thesisthesis
thesis
 
Coupled thermal fluid analysis with flowpath-cavity interaction in a gas turb...
Coupled thermal fluid analysis with flowpath-cavity interaction in a gas turb...Coupled thermal fluid analysis with flowpath-cavity interaction in a gas turb...
Coupled thermal fluid analysis with flowpath-cavity interaction in a gas turb...
 
NEW METHODS FOR TRIANGULATION-BASED SHAPE ACQUISITION USING LASER SCANNERS.pdf
NEW METHODS FOR TRIANGULATION-BASED SHAPE ACQUISITION USING LASER SCANNERS.pdfNEW METHODS FOR TRIANGULATION-BASED SHAPE ACQUISITION USING LASER SCANNERS.pdf
NEW METHODS FOR TRIANGULATION-BASED SHAPE ACQUISITION USING LASER SCANNERS.pdf
 
Computer Graphics Notes.pdf
Computer Graphics Notes.pdfComputer Graphics Notes.pdf
Computer Graphics Notes.pdf
 
Capstone Final Report
Capstone Final ReportCapstone Final Report
Capstone Final Report
 
Experimental Investigation of Optimal Aerodynamics of a Flying Wing UAV(Link)
Experimental Investigation of Optimal Aerodynamics of a Flying Wing UAV(Link)Experimental Investigation of Optimal Aerodynamics of a Flying Wing UAV(Link)
Experimental Investigation of Optimal Aerodynamics of a Flying Wing UAV(Link)
 
Multidimensional optimal droop control for wind resources in dc m 2
Multidimensional optimal droop control for wind resources in dc m 2Multidimensional optimal droop control for wind resources in dc m 2
Multidimensional optimal droop control for wind resources in dc m 2
 
2006 liang
2006 liang2006 liang
2006 liang
 
RFP_2016_Zhenjie_CEN
RFP_2016_Zhenjie_CENRFP_2016_Zhenjie_CEN
RFP_2016_Zhenjie_CEN
 
LChen_diss_Pitt_FVDBM
LChen_diss_Pitt_FVDBMLChen_diss_Pitt_FVDBM
LChen_diss_Pitt_FVDBM
 
Fulltext01
Fulltext01Fulltext01
Fulltext01
 
Iers conventions
Iers conventionsIers conventions
Iers conventions
 
Marshall-PhDThesis-2005
Marshall-PhDThesis-2005Marshall-PhDThesis-2005
Marshall-PhDThesis-2005
 
Nonlinear Simulation of Rotor-Bearing System Dynamics
Nonlinear Simulation of Rotor-Bearing System DynamicsNonlinear Simulation of Rotor-Bearing System Dynamics
Nonlinear Simulation of Rotor-Bearing System Dynamics
 

MSc_Thesis_Wake_Dynamics_Study_of_an_H-type_Vertical_Axis_Wind_Turbine

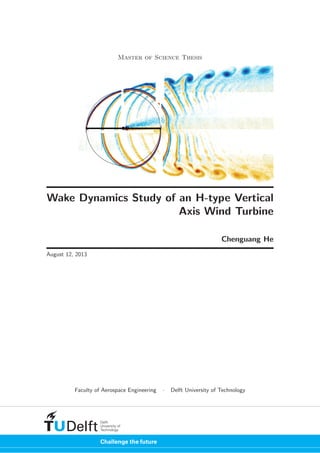
  • 1. Master of Science Thesis Wake Dynamics Study of an H-type Vertical Axis Wind Turbine Chenguang He August 12, 2013 Faculty of Aerospace Engineering · Delft University of Technology
  • 2.
  • 3. Wake Dynamics Study of an H-type Vertical Axis Wind Turbine Master of Science Thesis For obtaining the degree of Master of Science in Aerospace Engineering at Delft University of Technology Chenguang He August 12, 2013 Faculty of Aerospace Engineering · Delft University of Technology
  • 4. Copyright c Chenguang He All rights reserved.
  • 5. Delft University Of Technology Department Of Aerodynamics and Wind Energy The undersigned hereby certify that they have read and recommend to the Faculty of Aerospace Engineering for acceptance a thesis entitled “Wake Dynamics Study of an H-type Vertical Axis Wind Turbine” by Chenguang He in partial fulfillment of the requirements for the degree of Master of Science. Dated: August 12, 2013 Head of department: Prof. dr. G.J.W. van Bussel Supervisor: Dr. ir. C.J. Simao Ferreira Reader: Dr. Daniele Ragni Reader: Dr. Marios Kotsonis
  • 6.
  • 7. Summary Recent developments in wind energy have identified vertical axis wind turbines as a favored candidate for megawatt-scale offshore systems. Compared with the direct horizontal axis competitors they poss higher potentials for scalability and mechanical simplicity. The wake dynamics of an H-type vertical axis wind turbine is investigated using Particle Image Velocimetry (PIV). The experiments are conducted in an open jet wind tunnel with a turbine model of 1 m diameter constituted of 2 straight blades generated from a NACA0018. The turbine model is operated at a tip speed ratio of 4.5 and at a maximum chord Reynolds of 210,000. Two-component planar PIV measurements at the mid-span plane focus on vorticity shedding and horizontal wake expansion. Stereoscopic PIV measurements at 7 cross-stream vertical planes are performed to study tip vortex dynamics and evolution of 3D wake structures. Measurement at the turbine mid-span plane shows that the roll-up of shed vortex is triggered by wake interactions. Vorticity decay is asymmetrical with the faster decay rate at the leeward side. The faster windward wake expansion is attributed to the windward deflection of the tower wake. Wake recovery has not been observed in the horizontal measurement plane up to 4R downstream of the rotor. Experimental results on the vertical planes show that the tip vortex is stronger than the shed vortex in the horizontal plane. The strongest tip vortex is produced near the turbine axial plane (y/R = 0), and the in-rotor vorticity decay accounts for 60% - 90% of the overall decay. Near y/R = 0, tip vortices move inboard behind the rotor, whereas the turbine tower and the horizontal struts obstruct the inboard motion within the rotor swept volume. The rate of inboard motion is proportional to the vorticity strength. Due to weak vortex strength and strong blade blockage, tip vortices move outboard at two sides of the rotor primarily towards the windward side. Roll-over of vortex pairs contributes to the breakdown of vortical structure behind the rotor. Vertical wake recovery begins 4R downstream of the rotor, and the fastest recovery is observed near y/R = 0. v
  • 8.
  • 9. Acknowledgements Hereby, I would express my sincere gratitude to my supervisor Dr. Carlos Sim˜ao Ferreira for your continuous support and encouragement throughout the project. Also I would like to thank my daily supervisors Dr. Daniele Ragni, Giuseppe Tescione and Dr. Artur Palha. Your guidances and supports were vital to the success of this project. Thanks Prof. Fulvio Scarano for your valuable suggestions on my thesis work. I would also like to thank the members of my graduation committee, Prof. Gerard van Bussel and Dr. Marios Kotsonis for your helpful advice and suggestions in general. Thanks to my office roommates, Chidam, Lento, Mark, Rob for the laugh we shared in the past ten months. And thanks to all my Chinese and International friends for being the surrogate family during my five years of stay in Holland, and making me feel at home thousands miles away from China. Finally a sincere thanks to my girlfriend Nuo, and my families. Without your understanding, great patience and endless love I would not be able to accomplish all these. vii
  • 10.
  • 11. Contents List of Figures xii List of Tables xiii Nomenclature xv 1 Project Outline 1 2 Vertical Axis Wind Turbine - A Brief Introduction 3 2.1 VAWT vs. HAWT . . . . . . . . . . . . . . . . . . . . . . . . . . . . . . . . 5 3 Fundamental Aspects of VAWT Wake Aerodynamics 7 3.1 Definitions and Notations . . . . . . . . . . . . . . . . . . . . . . . . . . . . 7 3.2 Generation of Vorticity . . . . . . . . . . . . . . . . . . . . . . . . . . . . . 9 3.3 Vorticity and Energy Considerations . . . . . . . . . . . . . . . . . . . . . . 11 4 Particle Image Velocimetry 13 4.1 Fundamentals of 2C-PIV . . . . . . . . . . . . . . . . . . . . . . . . . . . . 13 4.2 Stereoscopic PIV (SPIV) . . . . . . . . . . . . . . . . . . . . . . . . . . . . 15 4.2.1 Working principle . . . . . . . . . . . . . . . . . . . . . . . . . . . . 15 4.2.2 Translational and rotational configurations . . . . . . . . . . . . . . . 16 4.2.3 Image reconstruction . . . . . . . . . . . . . . . . . . . . . . . . . . 18 5 Experimental Set-up and Image Processing 19 5.1 Wind Tunnel . . . . . . . . . . . . . . . . . . . . . . . . . . . . . . . . . . . 19 5.2 Turbine Model . . . . . . . . . . . . . . . . . . . . . . . . . . . . . . . . . . 20 5.3 Operational Conditions . . . . . . . . . . . . . . . . . . . . . . . . . . . . . 20 5.4 PIV Equipment . . . . . . . . . . . . . . . . . . . . . . . . . . . . . . . . . 21 5.5 PIV Set-up . . . . . . . . . . . . . . . . . . . . . . . . . . . . . . . . . . . . 21 5.6 System of Reference and Field of View . . . . . . . . . . . . . . . . . . . . . 23 5.7 Image Processing . . . . . . . . . . . . . . . . . . . . . . . . . . . . . . . . 24 ix
  • 12. x Contents 6 2D Wake Dynamics 27 6.1 Experimental Results . . . . . . . . . . . . . . . . . . . . . . . . . . . . . . 27 6.2 Simulation Results . . . . . . . . . . . . . . . . . . . . . . . . . . . . . . . . 29 6.3 In-rotor Vorticity Shedding . . . . . . . . . . . . . . . . . . . . . . . . . . . 29 6.3.1 Evaluation method . . . . . . . . . . . . . . . . . . . . . . . . . . . 29 6.3.2 On path tracking of wake circulation . . . . . . . . . . . . . . . . . . 32 6.4 Blade-wake and Wake-wake Interaction . . . . . . . . . . . . . . . . . . . . . 34 6.5 Vortex Dynamics Along the Wake Boundary . . . . . . . . . . . . . . . . . . 36 6.5.1 Determination of vortex core position and peak vorticity . . . . . . . 36 6.5.2 Vortex trajectory and vortex pitch distance . . . . . . . . . . . . . . . 38 6.5.3 Evolution of peak vorticity . . . . . . . . . . . . . . . . . . . . . . . 39 6.6 Wake Circulation . . . . . . . . . . . . . . . . . . . . . . . . . . . . . . . . 40 6.7 Wake Geometry . . . . . . . . . . . . . . . . . . . . . . . . . . . . . . . . . 41 6.8 Induction and Wake Velocity Profile . . . . . . . . . . . . . . . . . . . . . . 43 6.8.1 Stream-wise velocity profiles . . . . . . . . . . . . . . . . . . . . . . 43 6.8.2 Cross-stream velocity profiles . . . . . . . . . . . . . . . . . . . . . . 45 7 3D Wake Dynamics 47 7.1 Experimental Results . . . . . . . . . . . . . . . . . . . . . . . . . . . . . . 47 7.2 Tip Vortex Dynamics . . . . . . . . . . . . . . . . . . . . . . . . . . . . . . 53 7.2.1 Azimuthal variation of tip vortex circulation . . . . . . . . . . . . . . 53 7.2.2 Determination of tip vortex core position and peak vorticity . . . . . 56 7.2.3 Tip vortex motions in the xz-plane . . . . . . . . . . . . . . . . . . . 57 7.2.4 Stream-wise evolution of tip vorticity . . . . . . . . . . . . . . . . . . 60 7.3 3D Wake Geometry . . . . . . . . . . . . . . . . . . . . . . . . . . . . . . . 63 7.3.1 Wake geometry in the xy-plane . . . . . . . . . . . . . . . . . . . . . 63 7.3.2 Wake geometry in the yz-plane . . . . . . . . . . . . . . . . . . . . . 63 7.4 Stream-wise Wake Velocity Profiles . . . . . . . . . . . . . . . . . . . . . . . 63 8 Uncertainty Analysis 67 8.1 Free-stream Velocity . . . . . . . . . . . . . . . . . . . . . . . . . . . . . . . 68 8.2 Model Uncertainty . . . . . . . . . . . . . . . . . . . . . . . . . . . . . . . . 69 8.2.1 Model imperfections . . . . . . . . . . . . . . . . . . . . . . . . . . . 69 8.2.2 Operational conditions . . . . . . . . . . . . . . . . . . . . . . . . . 70 8.3 Measurement Uncertainty . . . . . . . . . . . . . . . . . . . . . . . . . . . . 71 8.4 Data Processing . . . . . . . . . . . . . . . . . . . . . . . . . . . . . . . . . 72 9 Conclusions and Recommendations 73 9.1 Conclusions . . . . . . . . . . . . . . . . . . . . . . . . . . . . . . . . . . . 73 9.1.1 2D wake dynamics . . . . . . . . . . . . . . . . . . . . . . . . . . . 73 9.1.2 3D wake dynamics . . . . . . . . . . . . . . . . . . . . . . . . . . . 74 9.2 Recommendations . . . . . . . . . . . . . . . . . . . . . . . . . . . . . . . . 75 References 77 A Image stitching Function 81
  • 13. List of Figures 2.1 Examples of VAWT . . . . . . . . . . . . . . . . . . . . . . . . . . . . . . . 4 3.1 Schematic of 2D VAWT division . . . . . . . . . . . . . . . . . . . . . . . . 8 3.2 CP -TSR diagram . . . . . . . . . . . . . . . . . . . . . . . . . . . . . . . . 9 3.3 Free body diagram of inflow vector . . . . . . . . . . . . . . . . . . . . . . . 9 3.4 2D characteristics, without induction . . . . . . . . . . . . . . . . . . . . . . 10 3.5 2D characteristics, with induction . . . . . . . . . . . . . . . . . . . . . . . 11 3.6 Schematic of tip vortex release along blade trajectory . . . . . . . . . . . . . 12 3.7 Schematics of wake vortex sheets . . . . . . . . . . . . . . . . . . . . . . . . 12 4.1 Schematics of PIV set-up [35] . . . . . . . . . . . . . . . . . . . . . . . . . . 14 4.2 Multi-pass vs. single-pass . . . . . . . . . . . . . . . . . . . . . . . . . . . . 15 4.3 Schematics of stereo camera arrangement . . . . . . . . . . . . . . . . . . . 16 4.4 Configurations PIV systems [31] . . . . . . . . . . . . . . . . . . . . . . . . 17 4.5 Effect of Scheimpflug adapter [1] . . . . . . . . . . . . . . . . . . . . . . . . 17 4.6 Multi-level Calibration Plate [32] . . . . . . . . . . . . . . . . . . . . . . . . 18 5.1 Schematics of OJF [3] . . . . . . . . . . . . . . . . . . . . . . . . . . . . . . 19 5.2 Lift characteristics of the airfoil . . . . . . . . . . . . . . . . . . . . . . . . . 20 5.3 Configuration of horizontal measurements . . . . . . . . . . . . . . . . . . . 22 5.4 Configuration of vertical measurements . . . . . . . . . . . . . . . . . . . . . 22 5.5 Schematics of measurement windows of horizontal plane . . . . . . . . . . . 23 5.6 Schematics of measurement windows of vertical planes . . . . . . . . . . . . 24 5.7 Example of raw images and processed image . . . . . . . . . . . . . . . . . . 25 6.1 Contour of wake velocity and wake vorticity, 2D phase-locked experimental results . . . . . . . . . . . . . . . . . . . . . . . . . . . . . . . . . . . . . . 28 6.2 Contour of wake velocity and wake vorticity, 2D phase-locked simulation results 30 6.3 Change of bound circulation vs. vorticity shedding . . . . . . . . . . . . . . . 31 6.4 Schematics of integration window . . . . . . . . . . . . . . . . . . . . . . . . 31 6.5 Sensitivity analysis of box length . . . . . . . . . . . . . . . . . . . . . . . . 32 xi
  • 14. xii List of Figures 6.6 On path circulation tracking . . . . . . . . . . . . . . . . . . . . . . . . . . 32 6.7 Maximum circulation position . . . . . . . . . . . . . . . . . . . . . . . . . . 33 6.8 Illustration of Blade-Wake Interaction . . . . . . . . . . . . . . . . . . . . . 35 6.9 Vorticity strengthening due to wake-wake interaction . . . . . . . . . . . . . 35 6.10 Velocity distribution at vortex core . . . . . . . . . . . . . . . . . . . . . . . 36 6.11 Vorticity distribution at vortex core . . . . . . . . . . . . . . . . . . . . . . . 37 6.12 Schematics of vortex core center . . . . . . . . . . . . . . . . . . . . . . . . 38 6.13 Vortex pitch . . . . . . . . . . . . . . . . . . . . . . . . . . . . . . . . . . . 39 6.14 RMS of absolute velocity . . . . . . . . . . . . . . . . . . . . . . . . . . . . 39 6.15 Peak vorticity distribution . . . . . . . . . . . . . . . . . . . . . . . . . . . . 40 6.16 Wake circulation . . . . . . . . . . . . . . . . . . . . . . . . . . . . . . . . . 41 6.17 Schematics of the wake geometry . . . . . . . . . . . . . . . . . . . . . . . . 42 6.18 Wake geometry . . . . . . . . . . . . . . . . . . . . . . . . . . . . . . . . . 43 6.19 Phase-locked stream-wise velocity profile . . . . . . . . . . . . . . . . . . . . 44 6.20 Peak velocity deficit of horizontal mid-span plane . . . . . . . . . . . . . . . 44 6.21 Schematic of wake stream-wise velocity distribution . . . . . . . . . . . . . . 45 6.22 Schematics 3D induction due to tip vortex . . . . . . . . . . . . . . . . . . . 45 6.23 Simulated wake development until 16R downwind of the turbine . . . . . . . 46 6.24 Cross-stream velocity profile . . . . . . . . . . . . . . . . . . . . . . . . . . . 46 7.1 Contour of wake velocity and wake vorticity, 3D phase-locked experimental results . . . . . . . . . . . . . . . . . . . . . . . . . . . . . . . . . . . . . . 51 7.2 Illustration of the influence of misalignment angle on uy . . . . . . . . . . . 52 7.3 Illustration of bound circulation of a skewed measurement plane . . . . . . . 53 7.4 Sensitivity analysis of the background cutoff criteria . . . . . . . . . . . . . . 55 7.5 Azimuthal variation of tip vortex strength . . . . . . . . . . . . . . . . . . . 56 7.6 Vorticity distribution at the vortex core . . . . . . . . . . . . . . . . . . . . . 57 7.7 Vorticity distribution away from the vortex core . . . . . . . . . . . . . . . . 57 7.8 Tip vortex trajectory in the xz-plane . . . . . . . . . . . . . . . . . . . . . . 58 7.9 Schematics of vortex inboard motion . . . . . . . . . . . . . . . . . . . . . . 59 7.10 Illustration of vortex pair roll-over, y/R = 0 . . . . . . . . . . . . . . . . . . 60 7.11 Stream-wise variation of tip vorticity . . . . . . . . . . . . . . . . . . . . . . 61 7.12 Decay of tip vorticity . . . . . . . . . . . . . . . . . . . . . . . . . . . . . . 61 7.13 Wake geometry in the xy-plane . . . . . . . . . . . . . . . . . . . . . . . . . 64 7.14 Wake geometry in the yz-plane . . . . . . . . . . . . . . . . . . . . . . . . . 64 7.15 Wake velocity profile in xy-plane . . . . . . . . . . . . . . . . . . . . . . . . 65 7.16 Peak velocity deficit of 3D vertical planes . . . . . . . . . . . . . . . . . . . 66 8.1 Convergence of the mean flow . . . . . . . . . . . . . . . . . . . . . . . . . 68 8.2 Schematic of blade deformation (exaggerated) . . . . . . . . . . . . . . . . . 70 A.1 Standard window alignment patterns . . . . . . . . . . . . . . . . . . . . . . 81 A.2 Possible window alignment patterns . . . . . . . . . . . . . . . . . . . . . . 82 A.3 Standard window alignment patterns . . . . . . . . . . . . . . . . . . . . . . 82
  • 15. List of Tables 8.1 Uncertainty of image calibration . . . . . . . . . . . . . . . . . . . . . . . . 71 A.1 Converting operation to standard window alignment pattern . . . . . . . . . 83 xiii
  • 16.
  • 17. Nomenclature Latin Symbols B Number of blade [-] CPmax maximum power coefficient [-] c Blade chord [m] H Blade span [m] N Number of samples [-] p∞ Static pressure [pa] R Rotor radius [m] t0 Vortex core radius [m] Rec Chord based Reynolds number [-] Rconst specific gas constant [J/(kg·K)] t Vortex age [s] T Temperature [K] u Velocity vector [m/s] ub Blade velocity [m/s] ures Local inflow velocity [m/s] uv Vorticity sheet convective velocity [m/s] u∞ Free-stream velocity [m/s] w Width of vorticity sheet [m] xv
  • 18. xvi Nomenclature Greek Symbols α Angle of attack [rad] Γ Blade circulation [m2/s] ˙γ Pitching rate [rad/s] θ Blade azimuthal angle [deg] λ Tip speed ratio [-] ρ Density [kg/m3] σ Blade solidity [-] ψ Misalignment angle [rad] ω Vorticity vector [1/s]
  • 19. Acronyms 2D Two dimensional 3D Three dimensional 2C-PIV Two Components PIV AoA Angle of Attack BWI Blade-Wake Interaction CFD Computational Fluid Dynamics DUWIND Wind Energy Research Group HAWT Horizontal Axis Wind Turbine OJF Open Jet Facility PTU Processing Time Unit PIV Particle Image Velocimetry SPIV Stereoscopic PIV TSR Tip Speed Ratio TU Delft Delft University of Technology VAWT Vertical Axis Wind Turbine WWI Wake-Wake Interaction xvii
  • 20.
  • 21. Chapter 1 Project Outline The re-merging interests on Vertical Axis Wind Turbine (VAWT) for urban or off-shore appli- cations require an improved understanding of rotor aerodynamics for performance optimization and wind farm design. The present project investigated the wake development of an H-type VAWT using Particle Image Velocimetry (PIV). Phase-locked flow properties were measured at a fixed tip speed ratio of 4.5. Two types of PIV measurements were conducted: a two- component planar PIV measurement at the horizontal mid-span plane, and a three-component stereoscopic PIV measurement at vertical measurement planes (aligned with free-stream). The study aims to: • Identifying main characteristics of three dimensional (3D) wake development of an H- type VAWT, both in detailed vortex scale and in global wake scale. • Validating the two dimensional (2D) unsteady inviscid panel code using measurement results at turbine mid-span plane. Based on the obtained measurement data, detailed flow analyses were performed with the focus on following aspects. At horizontal mid-span plane: • Circulation of wake vorticity sheets. • Blade-wake interaction and wake-wake interaction, investigating the triggering mecha- nism of vortical structures roll-up. • Shed vortex dynamics along wake shear layer, focusing on vortex convective trajectory and vorticity evolution. • Wake geometry at mid-span position, with specific attention to asymmetrical wake expansion. • Induction field and stream-wise evolution of wake velocity profiles. At vertical measurement planes: 1
  • 22. 2 Project Outline • Azimuthal variation of tip vortex strength. • Tip vortex motion in vertical planes, focusing on the cross-stream variation of vortex motions and vortex pair roll-over behind the rotor swept volume. • Stream-wise vorticity decay, with a comparison with simple theoretical vortex model. • 3D wake geometry. • Evolution of stream-wise velocity profile in vertical planes.
  • 23. Chapter 2 Vertical Axis Wind Turbine - A Brief Introduction Based on the alignment of rotational axis, two types of wind turbines are distinguished: Horizontal Axis Wind Turbine (HAWT) with rotational axis lying parallel to the ground, and Vertical Axis Wind Turbine (VAWT) with rotational axis standing vertically. Besides their different appearances, the underlying working principle is same. Wind turbine extracts kinetic energy from the wind, converting it into mechanical energy in the form of rotational motion; through built-in electricity generator, the mechanical energy is converted into electric energy which is delivered to electric networks. VAWTs are divided into two streams: drag-driven type and lift-driven type. The drag-driven type is propelled by the drag difference between the upstream and the downstream part of rotor blade. A famous example of drag-driven VAWT is the Savonius rotor (Figure 2.1(a)) named after Finish engineer Sigurd Savonius who invented it in 1925 [34]. Structural simplicity and relatively high reliability make drag-driven VAWTs particularly suitable for applications such as wind-anemometers and Flettner Ventilators. The former ones are commonly seen on the building rooftop whereas the latter ones are typically used as the cooling system of road vehicles. Despite their simplicity, the Savonius rotors, as with other variants of drag-driven VAWTs, have generally low operational efficiency (CPmax =0.17) when compared with their horizontal axis competitors (CPmax =0.59). Another Typology of VAWT is driven by lift. One famous example is the so-called Darrieus turbine (Figure 2.1(b)) patented by American Engineer Georges Darrieus in 1931 [29]. In theory Darrieus turbines are the most efficient VAWT, achieving an optimal power coefficient of CP =0.42 [26]. Since turbine blades are curved into an egg-beater shape (to reduce the stress induced by centrifugal force), Darrieus turbines are also known as the egg-beater rotors. In 1970s and 1980s, this configuration was extensively studied in Canada and the United States. In particular, the research work at Sandia National Laboratories proved the feasibility of large scale Darrieus turbines [30]. In 1984, the completion of Eole C (Figure 2.1(b)), the largest VAWT ever built [11], marked the culmination of a decade research efforts. In the 3
  • 24. 4 Vertical Axis Wind Turbine - A Brief Introduction end of 1980s, the shrinkage of North America market cut down research funding, resulting in a research stop for almost 15 years. In the following decades commercial development took over, companies like FloWind launched massive implementations of Darrieus turbines. In its full development during 1987, the power output of all FloWind VAWTs could supply the electricity use of nearly 20,000 California families. However, the glorious commercial success was not sustained as series of fatigue-related failures finally dragged down FloWind at the end of 2004 [17][30][39]. To overcome the structural deficiency of Darrieus turbines, a number of design concepts were explored since 1980s. Among them, the H-type VAWT or H-rotor (Figure 2.1(c)) stand out for its simplicity and efficiency. The use of straight blade reduces the difficulty of manufacturing curved blade; and the use of inherent blade stall characteristic removes the need of speed- break mechanism [30]. H-rotor researches during 1980s produced famous prototypes like VAWT-850, which is the largest H-rotor in Europe [27]. In 1990s, years of research efforts were transformed into commercial developments. Companies like Solwind of New Zealand, Ropatec of Italy, Neuh¨aususer of Germany designed and produced a range of H-rotors [16]. (a) Savonius type VAWT [5] (b) Darrieus turbines (Eole C) [30] (c) H-rotor [30] Figure 2.1: Examples of VAWT
  • 25. 2.1 VAWT vs. HAWT 5 2.1 VAWT vs. HAWT As an omni-directional machine, VAWT eliminates the need of pitching system hence reduces mechanical complexity [22]. VAWTs are generally quieter than HAWTs, making them suit- able for densely populated areas [19]. The ground-based equipment (e.g. transmission and electrical generation, etc.) makes VAWTs lighter, and easier for maintenance [12]. In offshore applications, low center of gravity allows an enhanced floating stability and a reduced gravi- tational load. The possibility of under-water electric generator further decreases the size and cost of the floating support structure. VAWTs have great potentials in wind farm operations. As the power output of a wind turbine is proportional to blade swept area, growing demand of power output has pushed the size of HAWTs to limit. Larger wind turbine size results in higher centrifugal force and bending stresses. Longer turbine blade requires larger turbine spacing hence lower wind farm density [30]. On the other hand, the size of VAWT can be extended vertically without a significant increase of occupied area. Recent researches showed that the wake recovery of a VAWT is faster, allowing for clustered array and increases wind farm power output [12][25]. However VAWT has its problems. Besides the well-known self-starting problem, the occurrence of dynamics stall at low rotational speed also shortens the turbine life. The inherent rotor asymmetry and unsteady operation of VAWTs lead to complicated blade loading and flow phenomena, which challenge blade designs and flow analyses [10].
  • 26.
  • 27. Chapter 3 Fundamental Aspects of VAWT Wake Aerodynamics The wake of a VAWT is inherently unsteady. The unsteadiness originates from periodical change of local Angle of Attack (AoA) at the blade level and from blade-wake interactions at the rotor level. Flow phenomena due to this unsteadiness include time varying vorticity shedding, unsteady wake evolution, blade vortex interaction, etc. Wake dynamics of VAWTs is further complicated by the strong asymmetry between the advancing and receding sides of the rotor [36]. Decades of research discontinuity leads to a limited understanding of these complicated phenomena. In the past few years, wake aerodynamics of an H-rotor was extensively studied in the Wind Energy Research Group (DUWIND) of Delft University of Technology (TU Delft). An inviscid unsteady panel code has been developed to simulate time dependent wake evolution [14]. Recently, the development of hybrid code has started, coupling Computational Fluid Dynamics (CFD) solver at turbine blades and vortex method at turbine wakes. Both methods are grid-free, making them insensitive to numerical dissipation hence well suitable for vortical flow simulation. In parallel to the numerical works, a range of experimental studies (e.g. smoke visualization, hot-wire and PIV measurement, etc.) were performed to validate numerical codes [36][37][38]. This chapter addresses fundamental aspects of the H-rotor wake dynamics, focusing on the generation and spatial distribution of vorticity within the rotor swept volume. The evolution of the vortical structures downstream of the rotor will be discussed in Chapter 6 and Chapter 7 in combined with the discussion of experimental results. 3.1 Definitions and Notations The wake of a VAWT can be divided into a region within the rotor swept volume and a region behind the rotor. Traditional momentum-based streamtube models treated a turbine rotor as 7
  • 28. 8 Fundamental Aspects of VAWT Wake Aerodynamics two half cups to adapty classical momentum theories [28]. Although this division accurately predicts integral forces, its capability in capturing the details of vortex dynamics is limited. The inefficiency lies in its incomplete treatment of the regions between upwind and downwind half of the rotor. These two regions, commonly referred to as the windward and the leeward, are essential to vorticity shedding and energy extraction of a VAWT. A better way of rotor division is proposed in [36]: • Upwind 45◦ < θ < 135◦ • Leeward 135◦ < θ < 225◦ • Downwind 225◦ < θ < 315◦ • Windward 315◦ < θ < 360◦ ∪ 0◦ < θ < 45◦ With θ being the azimuthal angle and θ = 90◦ being the most upwind. Figure 3.1 display a schematics of this division. The Cartesian reference system is origined at the turbine center, x-axis directs positively downwind of the turbine, y-axis points windward and z-axis points upwards. Counter-clockwise rotation is defined positive seen from above. In the following context, x-direction is referred to as the stream-wise direction and y-direction is referred to as the cross-stream directions. The turbine axial plane is the plane y/R = 0. In the horizontal direction, inboard refers to the direction of decreasing |y/R|, and outboard refers to the direction of increasing |y/R|. In the vertical direction, inboard refers to the direction of decreasing |z/H|, and outboard refers the direction of increasing |z/H|. x y R θ = 0˚ θ = 45˚ θ = 270˚θ = 90˚ θ = 180˚ θ = 135˚ θ = 225˚ θ = 315˚ u∞ ω Upwind Windward Leeward Downwind Figure 3.1: Schematic of 2D VAWT division Like other rotational machines, two parameters are important for VAWTs. Blade Solidity σ describes the percentage of the rotor area covered by solid blades: σ = Bc R (3.1) Where B is the number of blade, c blade chord and R rotor radius. Large blade solidity creates strong rotor blockage hence large flow induction. The Tip Speed Ratio (TSR) λ determines
  • 29. 3.2 Generation of Vorticity 9 turbine rotational frequency and is crucial to the power output: λ = ωR u∞ (3.2) Where ω is the rotor angular velocity in radius per second and u∞ is the free-stream velocity. According to a typical CP -TSR diagram (Figure 3.2) the peak power is found at the medium range of TSR. Low TSR tends to trigger dynamic stall, which postpones the occurrence of normal stall but intensifies unsteady blade loading, whereas high TSR results in low AoA, both compromising turbine efficiency. 1 2 3 4 5 6 7 8 0 0.1 0.2 0.3 0.4 TSR C P Re=150,000 Re=300,000 Figure 3.2: CP -TSR diagram 3.2 Generation of Vorticity The wake of VAWTs consist of shed and trailed vorticities. Due to unsteady blade motions, the release and distribution of vorticity are time dependent. x y R u∞ λu∞ ueff ω θ u∞ Figure 3.3: Free body diagram of inflow vector Based on the schematics of Figure 3.3, the geometrical AoA α can be derived as a function
  • 30. 10 Fundamental Aspects of VAWT Wake Aerodynamics of blade azimuthal angle θ: α = tan−1 − cos θ λ − sin θ (3.3) Time variations of AoA and inflow velocity lead to a periodically varying bound circulation, which, according to the Kelvin’s theorem [23] generates shed vorticity proportional to the negative change rate of bound circulation Γ: ωshed (t, z) = − ∂Γ (t, z) ∂t (3.4) The bound circulation can be derived using the unsteady formulation of the KuttaJoukowski theorem [23]: Γ = Γinflow + Γpitching = cπ uresα + c 2 1 2 − a ˙γ (3.5) Where ures the local inflow velocity, a the distance from rotation center to the leading edge of airfoil, and ˙γ the pitching rate. The first right-hand-side term measures the circulation due to inflow velocity, and the second term specifies the additional circulation of blade pitching motions. The magnitude of trailed vorticity is determined by the spatial gradient of bound circulation in the z-direction: ωtrailed (t, z) = − ∂Γ (t, z) ∂z (3.6) Shed vorticity aligns with the blade trailing edge, and trailed vorticity is orientated perpen- dicular to the blade trailing edge. Two types of vorticity have a phase difference of 90◦. 0 45 90 135 180 225 270 315 360 −30 −20 −10 0 10 20 30 θ° α° λ = 3 λ = 4 λ = 5 (a) Geometrical AoA 0 45 90 135 180 225 270 315 360 −1 −0.5 0 0.5 1 θ° Γ/Γ θ=90 ° ,λ=3 λ = 3 λ = 4 λ = 5 (b) Normalized bound circulation 0 45 90 135 180 225 270 315 360 −1 −0.5 0 0.5 1 θ° ω/ω θ=0 ° ,λ=5 λ = 3 λ = 4 λ = 5 (c) Normalized shed vorticity Figure 3.4: 2D characteristics, without induction Figure 3.4 displays the azimuthal variation of the geometrical AoA, bound circulation and vorticity shedding at three TSRs. The greatest AoAs are found at the leeward side around θ = 130◦ and θ = 230◦ (varying with TSR). Increasing TSR causes a drop of AoA, which reduces the likelihood of dynamics stall. Result shows that bound circulation is independent of TSR. The strongest circulations are observed at the most upwind and downwind sides of the rotor; whereas the greatest changes rate of bound circulation (i.e. the strongest vorticity
  • 31. 3.3 Vorticity and Energy Considerations 11 shedding) occurs at the most windward and leeward sides. Shed vorticity plot (Figure 3.4(c)) shows that vorticity shedding increases with TSR since the change rate of bound circulation becomes higher. The analysis so far has not considered the effect of flow induction. In reality, vorticity distribu- tion is non-symmetrical at two sides of the rotor. This is primary due to the asymmetrical flow induction as the windward advancing blade has different inflow conditions from the leeward receding blade. In the stream-wise direction, wake induction of the upwind blade passage re- duces the inflow velocity hence vorticity shedding downwind of the rotor, therefore the global wake dynamics is mainly determined by the wake generated at the upwind half of the rotor. Figure 3.5 displays the effective AoA and vorticity shedding from 2D simulation. 0 45 90 135 180 225 270 315 360 −5 0 5 10 15 20 θ° α ° (a) Effective AoA 0 45 90 135 180 225 270 315 360 −1 −0.5 0 0.5 1 θ° ω/ωmax (b) Normalized shed vorticity Figure 3.5: 2D characteristics, with induction Trailed vortex is generated along the finite span of a 3D VAWT. The strongest trailed vortex, known as the tip vortex, is released at the blade tip where the spatial gradient of the circulation is the highest. Neglecting ground effects and gravitational forces, the distribution of tip vortex is symmetrical with respect to the turbine axial plane y/R = 0. Figure 3.6 shows a schematic of tip vortex releasing along blade trajectory. Curved arrow represents the direction of vortex roll-up; plus and minus signs indicate pressure and suction sides of the blade. Tip vorticity changes its orientation at the most windward and leeward sides of the rotor, as a result of the sign change of bound circulation (Figure 3.4(b)). The production of trailed vorticity is weaker at the downwind part of the rotor due to reduced bound circulation. As shedding vorticity is determined by the time variation of bound circulation, the strongest vorticity shedding concentrates at the turbine mid-span where bound circulation is usually the highest. 3.3 Vorticity and Energy Considerations Assuming the energy extraction of a wind turbine can be measured by the Bernoulli constant ∇H, it can be shown that ∇H is determined by the local flow velocity u and the vorticity field ω [23]: ∇H = ρ (u × ω) (3.7)
  • 32. 12 Fundamental Aspects of VAWT Wake Aerodynamics + - -+ 0˚ 180˚ 90˚ 270˚ u∞ Figure 3.6: Schematic of tip vortex release along blade trajectory where vorticity is related to the curl of blade force by: Dω Dt = 1 ρ ∇ × f = 1 ρ ∂fx ∂z j − ∂fx ∂y k (3.8) For 2D VAWT spatial derivatives and force terms in z-direction are omitted, implying vorticity shedding and energy exchange occur at azimuthal positions where ∂fy ∂x − ∂fx ∂y is non-zero. To extract power in 3D, both shed and trailed vorticity are essential. Figure 3.7 shows a simplified schematic of a VAWT wake consisting of an array of vortex sheets. Shed vortices form the red sheets perpendicular to the inflow direction, and trailed vortices form the blue sheets parallel to the incoming flow. Two types of vortex sheet form a square wake tube which deforms along its convection. u∞ (a) Shedding vorticity sheets u∞ (b) Trailing vorticity sheets Figure 3.7: Schematics of wake vortex sheets
  • 33. Chapter 4 Particle Image Velocimetry Particle Image Velocimetry (PIV) is a non-intrusive flow diagnostic technique allowing flow field measurements. Comparing with intrusive flow measurement techniques like hot wire anemometer or pressure tube, PIV eliminates the need of instrumental intrusions by using non-intrusive laser light and tracer particles. Using Two Components PIV (2C-PIV) technique two velocity components within a planar interrogation window are obtained, and by using Stereoscopic PIV (SPIV) a third velocity component normal to the measurement plane can be resolved. Recently, the development of Tomographic PIV [15] extends the measurement range to a 3D volume. Fundamentals of 2C-PIV measurements are discussed in Section 4.1. A brief introduction to SPIV technique is presented in Section 4.2. If not stated otherwise, the content of 2C-PIV is based on the lecture notes of the course Flow Measurement Techniques of TU Delft [35], PIV lecture slides of A. James Clark School of Engineering, University of Maryland [24] and the book Particle Image Velocimetry - A Practical Guide [32]. The content of SPIV is based on the paper of Arroyo and Greated [8] and the review paper of Prasad [31]. 4.1 Fundamentals of 2C-PIV A typical 2C-PIV set-up consists of following components: a laser generator producing light sheet for particle illumination, a camera capturing the particle scattered light, and a PIV software for image acquisition and data processing. Figure 4.1 shows a basic PIV set-up. Key components are discussed in the following context. Tracer particles PIV measures flow velocity by cross correlating tracer particle positions of two consecutive image frames. Tracer particles must be small enough to faithfully trace the fluid motion; in the meanwhile, the size of the tracer particle should be large enough to scatter adequate 13
  • 34. 14 Particle Image Velocimetry Figure 4.1: Schematics of PIV set-up [35] light. The contradictory requirements make it non-trivial to select a proper particle size. Small particles are excellent flow tracer (due to low mass inertia) but are not good scatter (due to limited size); whereas the situation is opposite for large particles. For micro-metric particles used in PIV measurements, light scattering occurs at Mie regime where particle diameter is comparable or larger than the laser wavelength. In this regime, the strongest scattering occurs at 0◦ and 180◦ with respect to the incoming light, while the weakest scattering concentrates in the direction normal to the camera viewing direction. Since the contrast of PIV image is strongly determined by the scattering intensity, it is preferred to use the largest possible tracer particles without interfering flow properties. The diameter of typical tracer particles is about 1-3 µm in air flow measurement. Integration window Average particle displacement of interrogation window is derived using cross correlation. For statistically significant results, it is important to have a sufficient number of tracer particles; in the meanwhile over-seeding should also be avoided to prevent multi-phase flow. Typically, a desired particle concentration lie within the range from 109 to 1012 particles/m3 and each integration window should contain at least 10 particles. If large velocity variation presents in the measurement domain, the selection of a proper window size becomes difficult. A small window tends to cause particle loss, whereas large window size inevitably averages out flow details. To overcome this difficulty, the so-called multi-pass technique is developed. Starting with large window, this approach pre-shifts smaller interrogation windows (of the next pass) by using the distance estimated at the current pass. This process continues until the smallest window size is reached. Figure 4.2 demonstrates an example of applying single pass and multi-pass operations to a same measurement area. It is
  • 35. 4.2 Stereoscopic PIV (SPIV) 15 clear that multi-pass operation is capable of resolving flow field with large velocity contrast between the vortex region and the background free-stream region, which is impossible by using single-pass operation. Single-pass window size 24×24 Multi-pass min. window size 24×24 Figure 4.2: Multi-pass vs. single-pass Overlap between neighboring interrogation windows is often preferred to increase the use of measurement data. Since particles near the edge of windows are less likely to be captured in both frames, the processed image tends to be less accurate around window edges. By overlapping, these data are replaced by the data of neighboring window which does not lies at the edge. 20-30% overlap is common in practice. PIV acquisition and processing software The complicity of PIV measurement requires a real-time control of mutual dependent sub- systems. Modern PIV softwares (e.g. LaVision, PIVtec, TSI, etc) integrate control of various sub-systems (e.g. laser, cameras, etc.) into a central control unit which supports online processing in parallel to measurements. 4.2 Stereoscopic PIV (SPIV) 4.2.1 Working principle Stereoscopic PIV determines the velocity component normal to the measurement plane by using two synchronized cameras viewing from different angles. In a single camera set-up (Figure 4.4(a)), out-of-plane velocity is projected onto the object plane causing perspective errors. Using two off-axis cameras, the perspective error is converted into information about out-of-plane velocity components. Figure 4.3 shows the 2D schematic of a stereoscopic camera arrangement. Velocity compo-
  • 36. 16 Particle Image Velocimetry u ux ux1 ux2 uz CAM1 CAM2 α1 α2 X z Y Object plane Figure 4.3: Schematics of stereo camera arrangement nents in x-, y- and z- directions can be derived as: ux = ux1 tan α2 + ux2 tan α1 tan α1 + tan α2 uy = uy1 tan β2 + uy2 tan β1 tan β1 + tan β2 uz = ux1 − ux2 tan α1 + tan α2 = uy1 − uy2 tan β1 + tan β2 (4.1) Where α and β represent camera viewing angle with respect to yz- and xz-plane. To avoid singularity as α and β approaches zero, Equation 4.1 can be modified to: ux = ux1 + ux2 2 + uz 2 (tan α1 − tan α2) uy = uy1 + uy2 2 + uz 2 (tan β1 − tan β2) (4.2) 4.2.2 Translational and rotational configurations Based on camera arrangements, two SPIV configurations are distinguished. A translational configuration consists of two parallel standing cameras with lens axes normal to the light sheet (Figure 4.4(b)). This configuration allows for uniform magnification and good image focus, but its resolution is restricted by viewing angle θ (or camera off-axis angle). It can be shown that the accuracy of out-of-plane displacement is inversely proportional to viewing angle [43]: σ∆z σ∆x = 1 tan α (4.3) Where σ∆z and σ∆x represent the errors of out-of-plane and in-plane velocity components. With increasing viewing angle, the viewing axis deviates from lens design specification, causing substantial performance decay. The restriction on viewing angle is removed with a rotational configuration (Figure 4.4(c)). Since lens axes align with the viewing directions, the viewing angle can be increased without
  • 37. 4.2 Stereoscopic PIV (SPIV) 17 104 (a) Planar PIV (b) SPIV - Translational system (c) SPIV - Rotational system Figure 4.4: Configurations PIV systems [31] (a) Before using Scheimpug adapter (b) After using Scheimpug adapter Figure 4.5: Effect of Scheimpflug adapter [1]
  • 38. 18 Particle Image Velocimetry compromising lens performance, thereby allowing higher accuracy of out-of-plane velocity components. Rotating cameras bring the drawback of non-uniform image magnification. To retrieve uniform magnification cameras have to be mounted according to the Scheimpflug condition [6], which requires a co-linear alignment of object plane, lens plane and image plane. Without proper alignment the resulting image has only a narrow band of focused region as shown in Figure 4.5(a). A practical solution is to add a Scheimpug adapter between lens and CCD chip. By manually adjusting the orientation of Scheimpug adapter, a broader focus range can be achieved as shown in Figure 4.5(b) [1]. Although increasing off-axis angle improves measurement accuracy, an excessively large angle should be avoided to prevent strongly distorted image. In practice, the optimal measurement quality is obtained as camera opening angle approaches 90◦. 4.2.3 Image reconstruction To obtain displacement vectors in the object plane, the data of image plane is projected back using mapping function. This process is known as image reconstruction. If the complete geometry of PIV system is known, geometrical reconstruction can be used to link the image plane data x to the object plane data X. Since this approach requires a complete knowledge of imaging parameters, its practical use is limited. A more useful method, known as calibration-based reconstruction, reconstructs the mapping function through a calibration process. A typical mapping function reads: x = f (X) (4.4) Where f is usually a polynomial function with undetermined coefficients. Since the number of calibration points often exceeds the number of unknown coefficients, the polynomial coef- ficients are commonly determined using least square approximations. Calibration is performed using a calibration target, typically a rectangular metal plate with prescribed grid marker (cross, dots, etc.). For the calibration of a 2C-PIV set-up, a single image of the calibration plate is sufficient; for the calibration of a SPIV set-up, a second image is required at a known distance offset the laser sheet. Most commonly, a multi-level calibration plate (Figure 4.6) is used for the calibration of SPIV configuration. Figure 4.6: Multi-level Calibration Plate [32]
  • 39. Chapter 5 Experimental Set-up and Image Processing 5.1 Wind Tunnel The PIV experiments have been performed in the Open Jet Facility (OJF) of TU Delft. The OJF is a closed-circuit, open-jet wind tunnel with an octagonal cross-section of 2.85 × 2.85 m2 and a contraction ratio of 3:1. The tunnel jet is free to expand in a 13.7 × 6.6 × 8.2 m3 test section. Driven by a 500 kW electric motor, the OJF delivers free stream velocity range from 3 m/s to 34 m/s with a flow uniformity of ±0.5% and a turbulence level of 0.24% [2]. A 350 kW heat exchanger maintains a constant temperature of 20◦C in the test section. A schematic of the wind tunnel is shown in Figure 5.1. Figure 5.1: Schematics of OJF [3] 19
  • 40. 20 Experimental Set-up and Image Processing 5.2 Turbine Model The testing model is a two bladed H-type VAWT (H-rotor) with a rotor radius of 0.5 m. The rotor blades are generated by straight extrusion of a NACA0018 airfoil to 1 m span and 6 cm chord. Both sides of the blade are tripped with span-wise zig zag tapes, approximately 10% chord from the blade leading edge. Each blade is supported by two aerodynamically profiled struts (0.5 m) mounted at 0.2R inboard of blade tips, giving an aspect ratio of 1.8 and a blade solidity of 0.11. The entire turbine model, including blades, struts and supporting shaft is painted in black to reduce laser reflections. The wind turbine is supported by a 3 m steel shaft connected to a Faulhaber R brushless DC Motor at the bottom. With the maximum output power of 202 W, this motor drives the turbine at low wind speeds and maintains constant rotational speed. A Faulhaber gearbox with 5:1 gear ratio is coupled to the electrical engine to obtain sufficient torque at the operating regimes. An optical trigger is mounted on the shaft to synchronize the PIV system for the phased-lock acquisition. 5.3 Operational Conditions The turbine was operated at a fixed TSR of λ =4.5. The operational TSR was determined by a CP -TSR diagram similar to the one of Figure 3.2. Simulation shows λ = 4.5 yields the optimal power output (CP = 0.4) for the testing turbine. At a rotational speed of 800 RPM, the chord-based Reynolds Rec number is computed: Rec = ρωRc µ = 175, 000 Considering free-stream velocity and flow inductions, the actual chord-based Reynolds number varied between 130, 000 to 210, 000. 0 5 10 15 0 0.2 0.4 0.6 0.8 1 1.2 1.4 1.6 1.8 2 Angle of attack α ° CL NACA0018, Re=∞ NACA0018, Re=130,000 NACA0018, Re=210,000 NACA0003, Re=∞ αmax =12.5o (a) Lift polar 0 5 10 15 0 0.02 0.04 0.06 0.08 0.1 0.12 0.14 Angle of attack α° dCL /dα NACA0018, Re=∞ NACA0018, Re=130,000 NACA0018, Re=210,000 NACA0003, Re=∞ αmax =12.5o (b) Slope of lift polar Figure 5.2: Lift characteristics of the airfoil
  • 41. 5.4 PIV Equipment 21 Both lift coefficient and lift slope are important for VAWTs. The former one specifies the magnitude of bound circulation hence the strength of tip vortex, whereas the latter one determines unsteady vorticity shedding hence the power efficiency of the turbine. Since one of objectives is to validate vorticity shedding at the mid-span plane of the 2D simulation, it is more important to use an airfoil with comparable lift slope as the viscous NACA0018 airfoil used in the experiment. The lift polar and lift slope of a NACA0018 airfoil are given in Figure 5.2. Since the lift slope reduces in viscous flow, a thinner airfoil (NACA0003, dCL dα = 0.1) was used in the inviscid simulation to ensure the same performance of VAWT. Noted although the lift characteristics of inviscid NACA0003 airfoil are closer to the viscous NACA0018 airfoil, its higher lift slope is still an important cause of discrepancies in latter comparisons. Neglecting flow inductions, the maximum angle of attack of 12.5◦ is highlighted by the vertical dashed line in Figure 5.2. 5.4 PIV Equipment The tracer particle was produced by a SAFEX R twin fog generator placed downstream of the rotor. This generator produces Diethyl glycol-based seeding particles of 1 µm median diameter with a relaxation time of less than 1 µs [33]. Uniform mixing in the test section was ensured by the wind tunnel closed loop. A Quantel Evergreen R double pulsed Nd:YAG laser system was used as the light source. With the emitting power of 200 mJ per pulse, this system provides green light of wavelength 532 nm creating laser sheet of approximately 2 mm width and 40×30 cm2 illuminating area. The pulsed laser energy, repetition rate and time delay between pulses were controlled by a Processing Time Unit (PTU) and a sychnozation box called the Standford box. Two LaVision R Imager pro LX 16M cameras were used for image acquisition. The cameras have a resolution of 4870×3246 pixels2 with the pixel size of 7.4×7.4 µm2. Each camera was equipped with a Nikon R lens with focal length varying with desired Field of View (FOV) and image resolution (see Section 5.5 for details). Day light filter was added to reduce ambient light. Camera acquisition was synchronized to the laser shooting using the DaVis acquisition software. 5.5 PIV Set-up The measurements were conducted with PIV system in two set-ups: a 2C-PIV measurements at the horizontal plane and a SPIV measurements at the vertical planes. The first set-up investigated horizontal measurement plane at the rotor mid-span position (Figure 5.3). Given vertical symmetry of the rotor and that no relevant out of plane velocity component has been detected across the mid-span plane, a planar PIV setup has been used by combining two cameras into a single field of view. These two cameras were mounted on an horizontal beam, side by side at 1.3 m beneath the horizontal laser sheet. Each camera was equipped with an f = 105 mm Nikon lens, with a measuring aperture of f/4 and magnification factor of M = 0.09. The Field of View (FOV) of single camera was 266 × 399 mm2, and the combined FOV was 266 × 755 mm2 with an overlap of 44 mm in the y-direction.
  • 42. 22 Experimental Set-up and Image Processing In the second set-up, measurements were taken in the vertical planes of 7 cross-stream posi- tions (Figure 5.4). The SPIV set-up had two rotational cameras at two ends of a horizontal beam; a laser generator in middle of the beam produced vertical laser sheet to illuminate the measurement region. The cameras, mounted about d = 2.0 m from the measurement plane, were equipped with f = 180 mm Nikon lenses (f/4) with a relative viewing angle of δ = 96◦ and a magnification factor of M = 0.07. The resulting FOV was 365 × 430 mm2. Figure 5.3: Configuration of horizontal measurements Figure 5.4: Configuration of vertical measurements
  • 43. 5.6 System of Reference and Field of View 23 5.6 System of Reference and Field of View To synchronize the motion of cameras and laser, a two degrees-of-freedom traversing system was used, providing a stream-wise range of 1.4 m and a cross-stream range of 1.0 m. The horizontal measurements covers the rotor swept area and the wake region up to 4R downstream of the rotor. The positions of measurement window were optimized to minimize blade and tower shadows. To cover the target measurement domain, the traversing system was placed at two stream-wise positions. The first traversing system position covered the measurement range of x/R = [−1.88, 1.38], y/R = [−1.34, 1.35] and the second position covers the range of x/R = [1.13, 4.43], y/R = [−1.77, 1.77]. Figure 5.5 shows a schematic of the measurement domain. Each interrogation window is labeled with a unique ID, with the first digit indicating the number of traversing system position and the second alphabet indicating the window sequence. In the stream-wise direction windows were overlap by 7.1% to 19.9% of window width, in the cross-stream direction window overlap was constant and equaled to 21.6%. Between the first and second traversing system positions, two overlapped windows (1N, 2H) were measured for alignment. Convergence of the averaged phase-locked velocity was ensured with 150 images taken at θ = 90◦. 0 3 4 0 wind Figure 5.5: Schematics of measurement windows of horizontal plane The vertical measurements covered the stream-wise range from x/R = −1.10 to x/R = 6.00 at 7 cross-stream positions, y/R = -1.0, -0.8, -0.4, 0, +0.4, +0.8, +1.0. Measurement windows were placed at three height of z/H = 0.18, 0.50, 0.75, capturing flow behaviors in the vertical range from z/H = −0.07 to z/H = 1.01. Figure 5.6 shows the side view and the top view of the measurement domain. The stream-wise window overlap ranged from 19.0-43.6% of the window size. Between neighboring traversing system positions, overlapped windows were measured to determine their relative positions. To reduce blade shadows, phase- locked measurements were performed at θ = 0◦, with 150 images taken at each interrogation window.
  • 44. 24 Experimental Set-up and Image Processing 0 2 3 4 5 6 7 0 TS4TS4TS4 4H TS4 4I TS4 4L TS4 TS6TS6TS6TS6TS6TS6TS6 TS7TS7TS7TS7TS7TS7TS7 TS5TS5TS5TS5TS5TS5TS5 TS9TS9TS9 wind x/R z/H (a) Side view 0 2 3 4 5 6 7 0 y/R=0 wind x/R y/R (b) Top view Figure 5.6: Schematics of measurement windows of vertical planes 5.7 Image Processing LaVision R Davis software was used for image processing. Data processing includes 3 major steps: pre-processing, processing and post-processing. In the pre-processing phase, background noise was removed by subtracting the minimum average; a 3 × 3 Gaussian filter was used to ensure Gaussian profile shape and to reduce the effect of peak locking; spatial disparities of image intensity were excluded by removing the sliding background. The images were processed with a multi-pass correlation with the minimal window size of 32 × 32 pixels2 and an overlap ratio of 50%. The cross-correlation was sped up with built-in GPU mode of DaVis, using NVIDIA GeForce R GTX 570 GPU (480 cores, 1405.4 GFlops in double precision and 152.0 GB/s memory bandwidth) [4]. In the post-processing phase outliers of cross-correlation results were removed by applying a median filter. Final results were exported as DAT-files, which includes the following scale quantities: • Velocity field: ux, uy, uz, |u| • Standard deviation: σux , σuy , σuz , σ|u| • Reynold stress: τxy, τxz, τyz, τxx, τyy, τzz
  • 45. 5.7 Image Processing 25 Figure 5.7 gives an example of a raw image and the corresponding pre-processed and processed images. (a) Raw image (b) Pre-processed image (c) Processed image Figure 5.7: Example of raw images and processed image Since the DaVis exported data is based on local coordinates, it is essential to stitch individual images using global coordinates. Details of the stitching function can be found in Appendix A. At overlap regions, the interrogation window with better image quality was used. Averaging or image interpolation was not applied.
  • 46.
  • 47. Chapter 6 2D Wake Dynamics The study of 2D wake dynamics at the turbine mid-span plane focuses on 6 aspects: • Vorticity shedding within the rotor swept area (Section 6.3) • Blade-wake and wake-wake interaction (Section 6.4) • Vortex dynamics along the wake boundary (Section 6.5) • Wake circulation behind the rotor swept area (Section 6.6) • Wake geometry (Section 6.7) • Wake induction and velocity profiles (Section 6.8) Experimental and simulation results are displayed in Section 6.1 and Section 6.2. Detailed analyses based on these results are presented from Section 6.3 to Section 6.8. 6.1 Experimental Results Measurement results of the mid-span plane are presented in Figure 6.1. Figure 6.1(a) and Figure 6.1(b) show the contour plots of stream-wise velocity ux and cross-stream velocity uy, respectively. Figure 6.1(c) shows the out-of-plane vorticity contour ωz. The results were averaged over a phased-locked sampling of 150 images when blades were at the most upwind and downwind positions. Spatial coordinates are non-dimensionalized with the turbine radius R; velocity components are non-dimensionalized with the free-stream velocity u∞ and vorticity is non-dimensionalized with u∞ c . The wind came from the left and the turbine rotated in the counter-clockwise direction. Turbine blades, its trajectory, supporting struts and turbine tower are indicated in black, while the shadow blocked areas are blanked. Experimental results show asymmetrical wake expansion with faster expansion at the windward side. Velocity deficit induced by energy extraction is visible in the stream-wise velocity plot. The highest velocity gradients are observed in the most upwind and downwind blade positions, 27
  • 48. 28 2D Wake Dynamics (a) Non-dimensionalized stream-wise velocity (b) Non-dimensionalized cross-stream velocity (c) Non-dimensionalized out-of-plane vorticity Figure 6.1: Contour of wake velocity and wake vorticity, 2D phase-locked experimental results
  • 49. 6.2 Simulation Results 29 when blade circulation is respectively maximum in positive (counter clockwise) and negative (clockwise) signs. Due to periodic blades motion, shed vorticity sheets follow curved trajectories. The down- stream convection of the curved vorticity sheets form a U-shape wake geometry (Figure 6.1(c)). Defining vorticity sheet released over one turbine period as a complete wake cycle, each wake cycle consists of a convex upwind segment and a downwind concave segment. Wake geometry at the mid-span xy-plane is characterized by downstream transport of convex wake segments within the rotor swept area and downstream transport of concave wake segments behind the rotor. Windward and leeward counter-rotating vortical structure resemble a K´arm´an vortex street behind a cylinder. Near wake vortex roll-ups and interactions with neighboring vortices cause vortex deformation along its convection. Further downstream, vorticity strength reduces under diffusion and the concentrated vortex spreads to a broader area. 6.2 Simulation Results Results presented in this section are produced by the 2D version of the in-house developed unsteady inviscid free wake panel code. In the simulation, two airfoil are discretized using constant sources and doublet elements, with their strengths are determined by the Kutta condition imposed at trailing edges. The wake is modeled as a lattice of straight vortex filament and is free to evolve under mutual inductions. Direct computation of wake induction is accelerated by parallelization on GPU. Vortex elements are modeled as Rankine-type vortex, representing free vortex at the outer radius (potential flow) and rigid body rotation at the inner radius. Viscous diffusion is not accounted in the current version of the simulation code. An Adam-Bashforth second order time scheme is used for time marching. To investigate fully developed wake flow, the simulation ran until the convergence of integral force parameter (e.g. CT ), which corresponded to 15 rotations with a wake extension of 25R downstream of the turbine. The phase-locked results shown in Figure 6.2 were obtained by averaging instantaneous flow fields of 1◦ azimuthal step over 10 turbine rotations. 6.3 In-rotor Vorticity Shedding Vorticity shedding is a result of unsteady aerodynamics at the blade level, and is crucial to wake development and energy extraction of an H-rotor. Examining the vorticity sheet emanating from the blade (Figure 6.1(c)), counter-rotating vorticity sheets are clearly visible as a result of non-sharp trailing edge. 6.3.1 Evaluation method According to the Kelvin’s theorem [23], the magnitude of shed vorticity equals to the negative change rate of blade bound circulation Γ. Deriving vorticity using this relation requires a time sequence of measurements over a blade enclosed domain. Unfortunately light blockages
  • 50. 30 2D Wake Dynamics (a) Normalized stream-wise velocity (b) Normalized cross-stream velocity (c) Normalized out-of-plane vorticity Figure 6.2: Contour of wake velocity and wake vorticity, 2D phase-locked simulation results
  • 51. 6.3 In-rotor Vorticity Shedding 31 of rotor blades and other supporting structures often result in discontinuous measurement contour. An alternative way of determining the magnitude of the shed vorticity is by considering a finite domain near the blade trailing edge. As shown in Figure 6.3, the vorticity ω that are released in infinitesimal time interval δt is related to the change in bound circulation δΓ by: δΓ = ω · (wδs′ ) Where δs′ = δsb − δsv = (ub − uv)δt (6.1) Where w is the local width of vorticity sheet, ub is the velocity of blade motion and uv is the convective velocity of the vorticity sheet. δsb δsv Γ t t+δt Γ+δΓ u Figure 6.3: Change of bound circulation vs. vorticity shedding l d wt Figure 6.4: Schematics of integration window Although the underlying principle is straightforward, the aforementioned method is difficult in practice. First, the finite window length implicitly introduces uncertainties by summing up the vorticity released at earlier time instances. To reduce this uncertainty, it is preferred to minimize the window length l, and to shorten the distance between the window and the blade trailing edge d. However, it is difficult to have the domain very close to the blade trailing edge as blade edge laser reflections often leads to a larger masked area than the actual size of the blade. Also an excessively small domain size cannot guarantee improved accuracy. Strong velocity gradient confined within the thin layer of vorticity sheet makes precise capturing difficult using standard multi-pass correlation. Assuming the wake sheet just emanated from the blade is 1 mm wide (comparable to the thickness of blade trailing edge), and considering the camera scale is approximately 10 pixels/mm, the resulting resolution in the direction of wake width is only 10 vectors. This is apparently insufficient to resolve dynamic flow behavior within the wake sheet. Second, a precise estimation of vorticity convective distance δsv is often difficult due to the non-uniform convective velocity of vorticity sheets. A sensitivity analysis near blade trailing edge shows that the computed circulation varies significantly with the change of domain size, therefore it is not feasible to use this approach to the wake sheets just released from the blade.
  • 52. 32 2D Wake Dynamics 6.3.2 On path tracking of wake circulation Although the experimental resolution does not allow to resolve the vorticity release close to the blade trailing edge, the method outlined in the last section is applicable to the wake segment further away from the blade. Viscous diffusion and wake sheet expansion reduce sharp velocity gradients, making the application less sensitive to the size of integration window. 0 0.02 0.04 0.06 0.08 −0.8 −0.75 −0.7 −0.65 −0.6 −0.55 Box length ωc/u∞ Figure 6.5: Sensitivity analysis of box length The on path circulation is computed using integration windows along the wake sheet. Each window is orientated such that the window length l (short edge) aligns with tangential direction of the vorticity sheet. Window lengths are non-uniform and are determined based on a similar sensitive analysis as shown Figure 6.5. Results show that an overly small window length results in large fluctuations due to the the uncertainty on image processing. The smallest length that produces steady circulation is chosen as the window length. Window widths w (long edge) vary along the wake curve. In order to eliminate the influence of background vorticity, window width is chosen to be the local width of vorticity sheet t (Figure 6.4). 0 0.5 1 1.5 2 2.5 −0.6 −0.5 −0.4 −0.3 −0.2 −0.1 0 0.1 s/R Γ/Lu∞ EXP SIM, NACA0018 SIM, NACA0003 (a) Wake of upwind blade 0.511.522.5 0 0.1 0.2 0.3 0.4 0.5 0.6 0.7 s/R Γ/Lu∞ EXP SIM, NACA0018 SIM, NACA0003 (b) Wake of downwind blade Figure 6.6: On path circulation tracking Figure 6.6 displays the results of on path wake circulation. Horizontal axis represents the path coordinate along the wake, with the origin defined at the blade trailing edge (Figure 6.7);
  • 53. 6.3 In-rotor Vorticity Shedding 33 vertical axis measures the circulation per unit length, which is non-dimensionalized by the free- stream velocity u∞. The y-axis of Figure 6.6(a) and the x-axis of Figure 6.6(b) are reversed for easy comparison. Comparing two simulation results shows that the wake circulation trailed from a NACA0018 airfoil is stronger due to the larger lift slope, as expected in Section 5.3. Figure 6.6(a) compares the measured windward wake circulation with the result of 2D simu- lation. Simulation predicted circulations are generally higher owing to the higher lift slopes. Agreement between the measurement and the simulation is reasonable from s/R = 0 to s/R = 1.5. Assuming limited wake convection, this part of wake corresponds to the vorticity shed from θ = 0◦ to θ = 90◦, where the decreasing change rate of bound circulation results in a steady decline of wake strength towards the upwind side of the rotor. Both simulation and experimental results observe two circulation peaks with the measured peaks lying more upwind. The measured upwind peak (at around s/R = 1.4) is partially blocked by the tower shadow. The positions of peak circulation are highlighted by black circles in Figure 6.7. Wake circulation reduces dramatically downstream of the peaks due the induction of upwind wakes. Fluctuations of the measured result might result from a number of factors including variations of data quality, sensitivity of integration window sizes and residual background noises. s/R s/R (a) Experiments s/R s/R (b) Simulation, NACA0018 s/R s/R (c) Simulation, NACA0003 Figure 6.7: Maximum circulation position The wake strength at the leeward side of the rotor is presented in Figure 6.6(b). The experi- mental circulation shows an increase from the large s/R (upwind part), climbing to its peak values (leeward part) in the middle range of s/R and drops drastically from the peak onward (downwind part). Although the simulation predicts a similar trend, the discrepancies in detail are different. First, the simulation predicted upwind circulation is much higher. Second, three local peaks are are observed in the simulation results, whereas only one peak is observed in the measured results. In contrast to the windward side, the measured leeward peak shifts down- wind with respect to the simulation results. In average the leeward observed peak circulation is 20% higher than the peak circulation at the windward wake. The variation of wake circulation is determined by three factors: • Strength of newly released wake • Vorticity convection along the curved wake segment • Vorticity strengthening due to wake interactions
  • 54. 34 2D Wake Dynamics The convection velocity of the vorticity sheets is determined by viscous blade dragging and local velocity field. In general vorticity convection along the path is relatively slower than the downstream wake transport. Since wake interactions only causes local modifications of wake circulation, the global difference of upwind circulation is most likely attributed to the circulation difference just released from the blade. It seems that the numerical simulation predicts the windward wake circulation reasonably well, whereas it tends to overestimate at the leeward side. Comparing with a nominal shed vorticity distribution (Figure 3.5(b)), the increase of circulation presented in Figure 6.6 is more abrupt. Since most circulation peaks correspond to the positions of wake crossing, the strengthening of local vorticity field is most likely caused by wake interactions which also shift the position of the peak circulation. Detailed effects of wake interaction are discussed in the next section. 6.4 Blade-wake and Wake-wake Interaction Blade-Wake Interaction (BWI) arise when a downwind turbine blade crosses the wake segments generated by the other blades or generated by the blade itself during previous revolutions. Wake-Wake Interaction (WWI) occur when different wake segments cross each other. For VAWTs, BWI and WWI have two major implications: • On blades: BWI changes the local velocity field, which alters pressure distribution and blade loading of downwind blades. • On wakes: BWI and WWI cause local change of wake vorticity, which triggers the roll-up of vortical structure. Using moving interrogation windows the phenomenon of BWI and WWI were captured. Fig- ure 6.8(a) displays the flow field at three time instances separated by 25◦ azimuthal angles (corresponding to 5.2 ms). Blade crossing occurs at approximately θ = 185◦ and the box in the bottom image highlights the wake segment influenced by the interaction. Different wake segment can be distinguished by locations and intensities. Corresponding 2D simulation results are presented in Figure 6.8(b). Comparing the location of the boxes shows that the measured influenced region is more downwind and more inboard of the rotor. To understand how BWI and WWI triggers the roll-up of vortical flow structure, the on path circulation is computed. Figure 6.9 presents the results in 3D: the vorticity contour lies on the 2D plane; the lower curve indicates the trajectory on which the circulation is evaluated; and the height between the upper and lower curve represents the circulation strength. The evaluation method is similar to the one introduced in Section 6.3.1. Results show that circulation increase at the position of BWI. At the crossing point the vorticity is transferred from the newly released vorticity sheet to the weaker wake segment, creating a region of higher vorticity gradients. In case of BWI, the examined wake segment of Figure 6.9 corresponds to the weak one. After crossing, the strengthened local vorticity field leads to a counter-clockwise flow rotation, which rolls up the wake segment into large vortical structures (i.e. shed vortices). The mechanism of WWI is similar although the intensity of wake interaction is lower due to more diffused vorticity content.
  • 55. 6.4 Blade-wake and Wake-wake Interaction 35 (a) Experimental result (b) Numerical result Figure 6.8: Illustration of Blade-Wake Interaction Γ/(L u∞ )=0.63 Γ/(L u∞ )=0.25 (a) Experimental result Γ/(L u∞ )=0.84 Γ/(L u∞ )=0.42 Γ/(L u∞ )=0.61 Γ/(L u∞ )=0.23 (b) Numerical result Figure 6.9: Vorticity strengthening due to wake-wake interaction
  • 56. 36 2D Wake Dynamics The measured circulation is generally lower than the simulation prediction, coherently with the observations in Section 6.3. Simulation predicts multiple circulation peaks induced by BWI or WWI, while the WWI induced circulation peak is almost undetectable in the measurement results. This difference might be explained by the effect of viscous diffusion which reduces wake strength and intensity of wake interaction. Moreover, the effect of diffusion tends to remove strong vorticity gradients (results from wake interaction), leading to flattened circulation peaks. The number of circulation peaks has substantial impacts on the vortex roll-up downwind of the rotor. Single circulation peak triggers single vortex roll-up, which produces concentrated shed vortex in the experimental result (Figure 6.1(c)); in contrast, multiple peaks trigger vortex roll-up at multiple spatial locations, which gives rise to a more scattered vortical structure in the simulation result (Figure 6.2(c)). 6.5 Vortex Dynamics Along the Wake Boundary Shed vortices are generated by BWIs and WWIs discussed in the last section. The down- stream convections of the vortical structure have strong influences on the wake development at horizontal planes. Vortex trajectory defines wake geometry, and induction of shed vorticity is crucial to wake velocity field. 6.5.1 Determination of vortex core position and peak vorticity (a) The cuts 1.1 1.15 1.2 1.25 1.3 1.35 1.4 −0.1 0 0.1 0.2 0.3 0.4 x/R u y /u ∞ (b) uy along horizontal cut 1 1.1 1.2 1.3 1.4 −0.6 −0.5 −0.4 −0.3 −0.2 −0.1 0 0.1 y/R ux /u∞ (c) ux along vertical cut Figure 6.10: Velocity distribution at vortex core Important vortex properties include vortex core position, vortex core radius, vorticity distri- bution, and vortex circulation strength. For studying time varying vortex properties, flow measurements at different phase angles are required. With available phase-locked results, we exploit the periodical wake characteristic to bypass the difficulty of not having phase varying data. Assuming wake flow repeats itself every integer numbers of turbine rotational period T, studying consecutive released vortices can be considered equivalent to the tracking of single vortex over a sequence of time instances separated by T. Although this approach works well with isolated vortex, it becomes less capable when connected vortices are encountered (see for instance Figure 6.1(c) and Figure 6.2(c)). Interference of neighboring vortices makes the anal- ysis sensitive to the definition of vortex domain. Consequently, the following analysis would
  • 57. 6.5 Vortex Dynamics Along the Wake Boundary 37 not focus on domain dependent properties such as vortex core radius and circulation strength, instead, domain independent properties such as peak vorticity and vortex core position are discussed. Studying peak vorticity evolution allows a quantitative measurement of the change rate of shed vorticity. An accurate determination of peak vorticity is, however, impeded by low particle densities at the vortex core (due to centrifugal forces). To evaluate the effect of reduced particles, velocity distributions is plot along a vertical cut and a horizontal cut passing through the vortex core. The orthogonal cuts and corresponding velocity profiles are displayed in Figure 6.10. Both profiles show continuous velocity distribution in the region between velocity peaks, implying data quality of the vortex core is not significantly affected by the reduction of particle density (probably due to relatively low vorticity). Similar results are observed at other vortices. 1.1 1.15 1.2 1.25 1.3 1.35 1.4 −1.5 −1 −0.5 0 0.5 1 xpeak x/R ωz c/u∞ (a) ωz along horizontal cut 1 1.1 1.2 1.3 1.4 −1.5 −1 −0.5 0 0.5 ypeak y/R ω z c/u ∞ ypeak (b) ωz along vertical cut Figure 6.11: Vorticity distribution at vortex core Since vorticity is the strongest at vortex core, the vortex core location is assumed identical to the location of the peak vorticity. Two methods are used to determine the location of the peak vorticity. The first method makes use of the vorticity plot along the cuts of Figure 6.10(a). Although the vorticity field is more oscillating, comparable oscillation amplitude between the vortex core and the surrounding flow region suggests that the observed fluctuations are not a result of low data quality but are induced by flow unsteadiness. Since it is difficult to match the observed asymmetrical vorticity field with an axial-symmetrical vortex model, the vorticity profile is fitted with a polynomial function (dashed line). The stream-wise and cross-stream positions of the maximum vorticity correspond to the locations of peak vorticity in the x- and y-direction. The second method determines the vortex core position (¯x, ¯y) by using weighted average over an iso-vorticity contour: ¯x = xi,jωi,jdA ωi,jdA , ¯y = yi,jωi,jdA ωi,jdA (6.2) Where ωi,j is the vorticity of vortex particle, xi,j and yi,j are spatial coordinates of the vortex particle and dA is the pixel size. In order to examine the sensitivity of the cutoff limit, different cutoff limits are tested. Results show that the difference between two methods are negligible (maximum 1.6%). For simplicity, the first method was used.
  • 58. 38 2D Wake Dynamics Peak vorticity is determined by averaging the (absolute) maximum vorticity along two orthog- onal cuts which pass through the vortex core. 6.5.2 Vortex trajectory and vortex pitch distance Figure 6.12 displays a schematic of shed vortex positions downstream of the rotor. Two groups of vortices are distinguished: the 1st, 3th and 5th vortices are released from one blade and the 2nd, 4th and 6th vortices are generated by the other blade. The × signs and ⋆ signs indicate the position of vortex core in the windward and leeward sides respectively. Non-dimensionalized vorticity field with an absolute cutoff limit of 0.3 is added to the background for reference. Vortices of the same ID number show one-to-one correspondences between the simulation and measured results. As discussed in Section 6.4, the simulated vorticity field is less concentrated due to multiple vortex roll-ups. −1 0 1 2 3 4 −1.5 −1 −0.5 0 0.5 1 1.5 wind x/R y/R ωz c/u∞ −1.2 −0.8 −0.4 0 0.4 0.8 1.2 2 3 4 5 6 2 43 1 5 6 (a) Experimental results −1 0 1 2 3 4 −1.5 −1 −0.5 0 0.5 1 1.5 wind x/R y/R ωz c/u∞ −1.2 −0.8 −0.4 0 0.4 0.8 1.2 21 3 4 5 21 3 4 65 (b) Simulation results Figure 6.12: Schematics of vortex core center Vortex convective velocity is measured by the variation of vortex pitch, which is defined as the distance that a vortex is transported during one blade rotation. Assuming vortices released from two blades are identical, the average distances of neighboring vortices are used to compute vortex pitch in half rotation. The vortex pitches are plotted at the midpoints of neighboring vortices (Figure 6.13). The measured vortex pitches are comparable at two sides of the rotor, whereas the simulation predicted vortex pitches are larger at the windward side. Higher wake velocity (see Section 6.8.1) yields the simulation predicted pitch distance generally larger than the measured one. The plot of cross-stream vortex pitch (Figure 6.13(b)) shows that the outboard vortex motion is faster at the windward side. With increasing downstream distance, the pitch distance reduces with the slowing down of wake expansion. Results show reasonable agreement between the measurement and the simulation at the leeward side, while the discrepancy is large at the windward side. Stronger windward expansion explains the larger pitch distance in the experimental results.
  • 59. 6.5 Vortex Dynamics Along the Wake Boundary 39 1 1.5 2 2.5 3 3.5 4 0.4 0.5 0.6 0.7 0.8 x/R ux /u∞ windward, EXP leeward, EXP windward, SIM leeward, SIM (a) Stream-wise pitch 1 1.5 2 2.5 3 3.5 4 −0.2 −0.1 0 0.1 0.2 x/R u y /u ∞ windward, EXP leeward, EXP windward, SIM leeward, SIM (b) Cross-wise pitch Figure 6.13: Vortex pitch 6.5.3 Evolution of peak vorticity The vorticity variation is determined by the combined effect of vortex roll-up and viscous. In the near wake, the roll-up of inboard released vortex particles locally strengthens the vortex circulation; but the roll-up does not necessarily increase the vorticity of individual vortex par- ticle. For instance, if weaker vortex particle is rolled into the vortex core, the total circulation will increase but the mean vorticity will decrease. In the meanwhile, strong velocity gradients are removed by viscosity, resulting in a reduced vorticity peak and an expanded vortex core. Vorticity is further reduced by the turbulent diffusion through flow mixing and kinetic energy cascade. The growing magnitude of turbulent diffusion is demonstrated in the standard devi- ation plot of Figure 6.14. As shown, the influence of turbulence is low in the near wake but grows rapidly with increasing x/R. Comparing two sides of the rotor, the turbulence induced uncertainty is stronger at the windward side. Although turbulence diffusion scheme is not explicitly included in the simulation, the propagation of small numerical error resembles the growing effect of turbulence diffusion. Figure 6.14: RMS of absolute velocity Figure 6.15 illustrates the variation of peak vorticity in the stream-wise direction. Negative
  • 60. 40 2D Wake Dynamics windward vorticity is shown in red and the positive leeward vorticity is shown in blue. The error bars represent the uncertainty in estimating the phase-averaged results using instantaneous measurements (based on Figure 6.14). The windward and leeward measured shed vorticity have comparable strength just released from the rotor, but their downstream evolution becomes different. Vorticity of windward side increases from x/R = 1.5 to x/R = 2.3, suggesting viscous diffusion is locally overcome by vortex roll-up. Further downstream, the roll-up strength decreases and vorticity decays under diffusion. Overall, peak vorticity reduces to 30% of its original strength (at x/R = 1.3) at 3.6R behind the rotor. The decay of leeward vorticity is almost linear, resulting in a total vorticity decrease of 70% at 3.5R behind the rotor. Interestingly, decay rate downstream of x/R = 2.3 is approximately the same between the windward and the leeward sides. 0.5 1 1.5 2 2.5 3 3.5 4 −2.5 −2 −1.5 −1 −0.5 0 0.5 1 1.5 2 2.5 x/R Peakvorticityωz c/u∞ windward, EXP leeward, EXP windward, SIM leeward, SIM Figure 6.15: Peak vorticity distribution The differences between experimental and simulation results are large. At the windward side the simulation predicted peak vorticity is in average 40% lower than the measured result; whereas at the leeward side the simulation overestimates the vorticity by 15%. This discrep- ancy might be explained by different wake expansion pattern that will be discussed in detail in Section 6.7. In the experiment, the windward deflected wake squeezes the shear layer along the wake boundary, resulting in an increased velocity gradient hence a locally enhanced vorticity field; conversely, the stretched leeward shear layer causes a decrease of vorticity. Examining Figure 6.1(a) it is clear that the windward shear layer is thinner than the leeward one. Since the simulation predicts an opposite wake expansion pattern, the squeezing and stretching effects are reversed. As shown in Figure 6.15, the rate of vorticity decay are almost identical at the two sides of the rotor. The numerical simulation underestimates the decay rate by 10%, which might be traced back to the absence of diffusion scheme. 6.6 Wake Circulation Due to the difficulty of specifying vortex domains, circulations of a bound vortex contour is not computed; instead, the circulation of equally spaced sub-domains moving downstream is
  • 61. 6.7 Wake Geometry 41 evaluated. Circulation at windward (y/R > 0) and leeward (y/R < 0) regions are derived separately. Figure 6.16(a) displays the wake circulation as a function of the stream-wise position x/R. Results show strong fluctuations near vortex cores, which reduces with increasing downstream distance. Detailed differences between the experimental and the simulation results (e.g. the shift of stream-wise peak circulation, etc.) are consistent with the discussion of vortex dy- namics in the last section. To reduce vortex induced fluctuations, accumulated circulation is plotted. In Figure 6.16(b), the value at a certain x/R corresponds to the total circulation summed over all sub-domains upstream of this position. Linear circulation increase are observed at both sides of the rotor, which implies the total circulation is conserved. Results from the 2D simulation show a similar evolution trend but it overestimates the circulation by 10%. Summing up the windward and leeward wake circulation, the total circulation is represented by the black curves in Figure 6.16(b). As seen, the total wake circulation is conserved and equals to zero. Since the circulation of the complete rotor system (rotor+wake) is zero, this observation implies the circulation of the rotor is zero. 1 1.5 2 2.5 3 3.5 4 −2.5 −2 −1.5 −1 −0.5 0 0.5 1 1.5 2 2.5 x/R Γ z /Lu ∞ windward, EXP leeward, EXP windward, SIM leeward, SIM (a) Circulation 1 1.5 2 2.5 3 3.5 4 −1.5 −1 −0.5 0 0.5 1 1.5 x/R Γz /Lu∞ windward, EXP leeward, EXP windward+leeward, EXP windward, SIM leeward, SIM windward+leeward, SIM (b) Accumulated circulation Figure 6.16: Wake circulation 6.7 Wake Geometry Wake geometry defines global wake shape and provides important reference scale for wind farm designs. Conventionally wake geometry is defined by using streamline that corresponds to certain velocity cutoff or by using vortex trajectory [41]. Determining streamlines requires time-averaged results which are not available to the current study, thus the following context analyzes the horizontal wake geometry based on the convective trajectory of shed vortices. Figure 6.17 displays the wake geometry obtained by least square fitting of vortex core positions. For reference the streamline that corresponds to 99% free-stream velocity of time-averaged simulation results is added to the plot. Both experimental and simulation results show the
  • 62. 42 2D Wake Dynamics −1 0 1 2 3 4 −1.5 −1 −0.5 0 0.5 1 1.5 x/R y/R wind Exp SIM SIM, 99% u ∞ streamline Figure 6.17: Schematics of the wake geometry horizontal wake expansion as a result of energy extraction. In comparison the experiment observes a faster expansion at the windward side while the simulation predicts a more sym- metrical expansion. In average the measured wake expansion angle is 8◦ at the windward side and 5◦ at the leeward side. The corresponding simulation predicted expansion angles are 4◦ and 5◦ respectively. Comparing with the wake geometry defined by the streamline, the geometry obtained using vortex trajectory lies slightly inboard since vortex induction increases the stream-wise velocity outboard of the vortex core. The asymmetrical wake expansion is also demonstrated in the wake centerline plot of Fig- ure 6.18(a). The measured wake centerline lies around y/R = 0.1 and moves towards the windward side with an angle of circa 0.7◦. In contrast the simulation predicted wake center- line, which lies close to y/R = 0, shifts windward with an angle of 0.3◦. This observation is consistent with the asymmetric wake expansion discussed above. The presence of the turbine tower is probably the main cause of measured asymmetrical wake expansion. In Figure 6.1(a), tower wake is represented by the yellow expanding region behind the turbine tower. With flow passing the rotating tower, a leeward pointing lift force is generated; the reaction of this force deflects the tower wake to the windward side of the rotor, which steers the expansion of turbine wake to the same side. To analyze global wake expansion, the cross-stream wake diameter Dw is computed. As shown in Figure 6.18(b), the measured wake diameter increases 41% at 3.5R downstream of the turbine, whereas the wake diameter predicted by the simulation increases 35% at the same downstream distance. Since wake expansion is a direct consequence of energy extraction, the faster measured wake expansion is most probably attributed to the larger velocity deficit that will be discussed in the next section.
  • 63. 6.8 Induction and Wake Velocity Profile 43 1.5 2 2.5 3 3.5 −0.4 −0.2 0 0.2 0.4 x/R Wakecenterlinepositiony/R EXP SIM (a) Wake centerline position 1 1.5 2 2.5 3 3.5 1 1.2 1.4 x/R WakediameterDw /2R EXP SIM (b) Wake diameter Figure 6.18: Wake geometry 6.8 Induction and Wake Velocity Profile Knowledge of wake inductions and wake velocity profiles is crucial to the understanding of wake recovery of a wind turbine. According to Kinze [25], VAWTs exhibit favorable velocity recovery characteristics in comparison to similar sized HAWTs. In the following section, we testify this statement by investigating stream-wise wake velocity profiles in the mid-span plane of the turbine model. The cross-stream velocity profile is also discussed to facilitate the understanding of asymmetrical wake expansion. Comparing with time-averaged results the phase-locked wake velocity profiles are more im- portant for VAWTs. First, cyclic blade loading and extreme loading conditions of downwind rotors are determined by the instantaneous wake velocity of upwind rotors. Second, the kinetic energy perceived by the downwind rotor is time varying. Decomposition the time dependent flow into mean, periodic and randomly fluctuating components [21], it can be shown that the kinetic energy of the time dependent flow is usually higher than the kinetic energy of the mean flow. 6.8.1 Stream-wise velocity profiles Figure 6.19(a) shows the stream-wise wake velocity profiles at 6 positions x/R =1.5, 2.0, 2.5, 3.0, 3.5, and 4.0. The results of phase-locked 2D simulation are plotted in Figure 6.19(b). The measured stream-wise velocity profiles are non-symmetric with respect to y/R = 0. Faster windward expansion shifts the velocity profiles to the windward side. Between y/R = −0.7 and y/R = 0.9, velocity deficits are high and velocity gradients dux dy are low; outboard of this region ux increases rapidly. The shapes of the phase-locked velocity profile are similar to all stream-wise positions. Along the shed vortex trajectory, vortex induced fluctuations are visible at the windward region from y/R = 0.5 to y/R = 1.2 and leeward region from y/R = −0.8 to y/R = −1.0. In the stream-wise direction, the influence of vortex induction diminishes and the velocity profiles become smoother with increasing x/R. The simulation result shows a more symmetrical profile. The maximum velocity deficit is found at y/R = −0.2 and remains at this position with increasing downstream distance. The peak velocity deficit, a non-dimensional number defined by 1 − uxmin /u∞, is presented in Figure 6.20. The figure shows no indication of wake recovery until 4R downstream of the
  • 64. 44 2D Wake Dynamics 0 0.2 0.4 0.6 0.8 1 −1.5 −1 −0.5 0 0.5 1 1.5 u x /u ∞ y/R x/R=1.5 x/R=2.0 x/R=2.5 x/R=3.0 x/R=3.5 x/R=4.0 (a) Experimental results 0 0.2 0.4 0.6 0.8 1 −1.5 −1 −0.5 0 0.5 1 1.5 u x /u ∞ y/R x/R=1.5 x/R=2.0 x/R=2.5 x/R=3.0 x/R=3.5 x/R=4.0 (b) Simulation results Figure 6.19: Phase-locked stream-wise velocity profile turbine. The peak deficits predicted by the 2D simulation are in average 20% lower than the experimental observed values. 1.5 2 2.5 3 3.5 4 50 60 70 80 90 100 x/R Peakvelocitydeficit[100%] EXP SIM Figure 6.20: Peak velocity deficit of horizontal mid-span plane To understand aforementioned observations, the variation of wake velocity behind a generalized wind turbine is plotted in Figure 6.21. Immediately behind the rotor, wake velocity decreases as a result of energy extraction. Wake velocity reaches its minimum of (1 − 2a)u∞ at xcrit, with a being the flow induction factor. Further downstream, flow re-energirization takes place and the wake velocity starts to recover. The observed growing wake deficit suggests that wake recovery has not yet started until x/R = 4.0. The discrepancy of the measured and the simulation results might be traced to two possible sources: • Wake of the turbine tower • Absence of tip vortex induction in 2D simulation As already mentioned in Section 6.7, the presence of the rotating turbine tower is an important cause of wake asymmetry, thus it also contributes to the asymmetrical velocity distribution in Figure 6.19(a). Additionally, the downwind transport of the tower wake also reduces the wake velocity along its path.
  • 65. 6.8 Induction and Wake Velocity Profile 45 x ux xcrit Turbine plane (1-2a)u∞ Figure 6.21: Schematic of wake stream-wise velocity distribution In the 2D simulations, the wake velocity at the mid-span horizontal plane is solely determined by the induction of in-plane shed vorticity. In reality the wake velocity is also influenced by the induction of tip vortex in the vertical direction. Tip vortex induction within the rotor swept area has been discussed in [36], demonstrating it a main cause of stronger velocity deficit in 3D. Behind the rotor, the situation is similar. As will be discussed in Section 7.3.1, tip vortices are distributed along convex and concave vortex tubes as shown in Figure 6.22; the induction of these tubes produces negative components of stream-wise induction, leading to larger velocity deficit at the turbine mid-span plane. Concave tip vortex tube Convex tip vortex tube H-rotor Induction ω Figure 6.22: Schematics 3D induction due to tip vortex Although wake recovery is not observed at the turbine mid-span plane, the other span-wise positions might experience a different flow recovery rate. Wake recovery in the vertical di- rection might also be different due to the inherent rotor asymmetry (Section 7.4). 2D wake simulation until 16R downwind of the rotor (Figure 6.23) shows that wake expansion stops at approximately x/R = 6, which implies wake recovery starts after this distance. 6.8.2 Cross-stream velocity profiles Figure 6.24 shows the phase-locked velocity profiles of cross-stream velocity uy. Comparing with the stream-wise velocity profiles, velocity fluctuations are stronger; the strongest fluctu- ations are found at the most upstream station of x/R = 1.5 and the fluctuations magnitude decrease with increasing x/R. Velocity fluctuations 4R behind the rotor are almost negligible.
  • 66. 46 2D Wake Dynamics Figure 6.23: Simulated wake development until 16R downwind of the turbine It is visible that the positive uy dominates the windward region with its influence further extended to the leeward region; small regions of negative uy is only observed to the most leeward side of the rotor. The cross-stream position of zero uy shifts windward due to non- symmetrical wake expansion. With increasing x/R, the magnitude of cross-stream induction reduces. The velocity distribution is more asymmetrical in the simulation result. Zero cross-stream velocity is observed near the turbine axial plane at y/R = 0.1. Comparing the velocity profiles at the most downstream position of x/R = 4.0 shows that the simulation predicted uy is lower at the windward side and is higher at the leeward side, which is consistent with the cross-stream vortex pitch discussed in Section 6.5.2. −0.15 −0.1 −0.05 0 0.05 0.1 0.15 −1.5 −1 −0.5 0 0.5 1 1.5 uy /u∞ y/R x/R=1.5 x/R=2.0 x/R=2.5 x/R=3.0 x/R=3.5 x/R=4.0 (a) Experimental results −0.15 −0.1 −0.05 0 0.05 0.1 0.15 −1.5 −1 −0.5 0 0.5 1 1.5 uy /u∞ y/R x/R=1.5 x/R=2.0 x/R=2.5 x/R=3.0 x/R=3.5 x/R=4.0 (b) Simulation results Figure 6.24: Cross-stream velocity profile
  • 67. Chapter 7 3D Wake Dynamics The release and downstream convection of tip vortices are crucial to the 3D wake development of an H-type VAWT. Tip vortex motions in the xz-plane define wake geometry in the vertical direction, whereas the variations of tip vorticity, among other factors, determine induction fields in 3D. Blade-vortex interactions at the downwind blade passage cause unsteady blade loading and are important sources of noise generation. In this chapter, we examine 3D wake dynamics with the focus on tip vortex dynamics and non-symmetric wake distribution. The following aspects are addressed: • Azimuthal variation of tip vortex strength (section 7.2.1) • Tip vortex motion in the vertical xz-plane (section 7.2.3) • Stream-wise tip vorticity decay (section 7.2.4) • 3D wake geometry (section 7.3) • Stream-wise wake velocity profile in the xz-plane (section 7.4) The experimental results and preliminary observations are presented in Section 7.1. 7.1 Experimental Results Figure 7.1 shows the 3D phase-locked measurement results at 7 cross-stream positions of y/R=+1.0, +0.8, +0.4, 0, -0.4, -0.8, -1.0. To minimize light blockage, velocity fields were acquired with the blades at the most windward/leeward positions. Figure 7.1(a), Figure 7.1(b) and Figure 7.1(c) display the contour plots of stream-wise velocity ux , cross-stream velocity uy and span-wise velocity uz respectively, all defined according to Figure 3.1. The vorticity con- tour ωy is presented in Figure 7.1(d). Spatial coordinates x, y and z are non-dimensionalized using rotor radius R or blade span H; velocity and vorticity are non-dimensionalized similar to the 2D results. Blades, struts and tower are indicated in black, and shadow-blocked areas are blanked. 47
  • 68. 48 3D Wake Dynamics Wind Wind Wind Wind Wind Wind Wind (a) Non-dimensionalized stream-wise velocity
  • 69. 7.1 Experimental Results 49 Wind Wind Wind Wind Wind Wind Wind (b) Non-dimensionalized cross-stream velocity
  • 70. 50 3D Wake Dynamics Wind Wind Wind Wind Wind Wind Wind (c) Non-dimensionalized vertical velocity
  • 71. 7.1 Experimental Results 51 Wind Wind Wind Wind Wind Wind Wind (d) Non-dimensionalized cross-stream vorticity Figure 7.1: Contour of wake velocity and wake vorticity, 3D phase-locked experimental results
  • 72. 52 3D Wake Dynamics Tip vortices are represented by the deep blue regions in Figure 7.1(d). Almost circular tip vortices are observed close to the turbine axial plane; moving outboard tip vortex is stretched due to increasing misalignment between the axis of the vortex core and the normal of the measurement plane. The vorticity plot clearly shows inboard tip vortex motions near y/R = 0 and outboard tip vortex motions at two sides of the rotor. At y/R=+0.4, 0, -0.4, -0.8, the release and roll-up of the downwind tip vortice are visible. Both upwind and the downwind tip vortices have negative vorticity, rotating clock-wisely seen from the leeward side. Tip vortex deforms along its downstream convection. The previously mentioned misalignment also influences the observed cross-stream velocity (Figure 7.1(b)). Considering a windward vortex tube at the upwind part (Figure 7.2), due to the misalignment angle ψ, the induced velocity on the top side of the tube has a negative y-component, and the induced velocity at the bottom side has a positive y-component. At the windward side (y/R = +1.0, +0.8, +0.4), these two velocity components result in a blue region on the top and an orange region at the bottom. At the leeward side, the situation is reversed. Since the velocity component in the y-direction increases with misalignment angle, the deepest blue and the deepest orange vortex regions are observed at the most windward and leeward sides of the rotor. The sign of vertical velocity uz alternates due to vortex induction. x y x y yx z u+y u-y y z u+y u+y u-y u-y x xz y u+y u-y xz y Windward Leeward ψ ψ Figure 7.2: Illustration of the influence of misalignment angle on uy The cross-stream velocity plot (Figure 7.1(b)) also shows the wake of vertical turbine blades and horizontal struts. The blade wake is represented by the red vertical wake segments behind the blade, and the struts wake corresponds to the horizontal wake region released around the struts height (z/H = 0.3).