Tricumen / 1Q16 Capital Markets Results Review_open
•
1 recomendación•220 vistas

The document summarizes capital markets results for major banks in 1Q16 compared to 1Q15. It finds that overall operating revenue dropped 25% year-over-year, with weakness seen across fixed income, currencies and commodities as well as debt capital markets. Front office productivity also declined despite job cuts in those areas. Profits fell even more sharply than revenue, with pre-tax profit dropping 30% overall. European banks faced additional challenges from regulations capping bonuses, which increased fixed costs. Specific business lines like credit trading and securitization saw especially steep declines.

Recomendados
Recomendados
Más contenido relacionado
La actualidad más candente
La actualidad más candente (20)
Similar a Tricumen / 1Q16 Capital Markets Results Review_open
Similar a Tricumen / 1Q16 Capital Markets Results Review_open (20)
Más de Tricumen Ltd
Más de Tricumen Ltd (14)
Último
Último (20)
Tricumen / 1Q16 Capital Markets Results Review_open
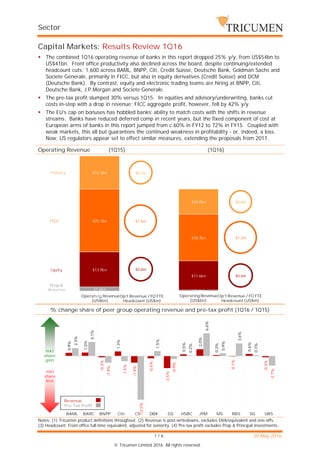
- 1. Sector 1 / 6 20 May 2016 © Tricumen Limited 2016. All rights reserved. Capital Markets: Results Review 1Q16 The combined 1Q16 operating revenue of banks in this report dropped 25% y/y, from US$54bn to US$41bn. Front office productivity also declined across the board, despite continuing/extended headcount cuts: 1,600 across BAML, BNPP, Citi, Credit Suisse, Deutsche Bank, Goldman Sachs and Societe Generale, primarily in FICC, but also in equity derivatives (Credit Suisse) and DCM (Deutsche Bank). By contrast, equity and electronic trading teams are hiring at BNPP, Citi, Deutsche Bank, J.P.Morgan and Societe Generale. The pre-tax profit slumped 30% versus 1Q15. In equities and advisory/underwriting, banks cut costs in-step with a drop in revenue; FICC aggregate profit, however, fell by 42% y/y. The EU's cap on bonuses has hobbled banks' ability to match costs with the shifts in revenue streams. Banks have reduced deferred comp in recent years, but the fixed component of cost at European arms of banks in this report jumped from c.60% in FY12 to 72% in FY15. Coupled with weak markets, this all but guarantees the continued weakness in profitability - or, indeed, a loss. Now, US regulators appear set to effect similar measures, extending the proposals from 2011. Operating Revenue (1Q15) (1Q16) % change share of peer group operating revenue and pre-tax profit (1Q16 / 1Q15) Notes: (1) Tricumen product definitions throughout. (2) Revenue is post-writedowns, excludes DVA/equivalent and one-offs. (3) Headcount: Front office full-time equivalent, adjusted for seniority. (4) Pre-tax profit excludes Prop & Principal Investments.. $0.6m $1.2m $0.6m 0.5 1 1.5 2 2.5 3 3.5 0.8 1 1.2 $0.7m $1.4m $0.8m 0.5 1 1.5 2 2.5 3 3.5 0.8 1 1.2 FICC Equity Prop & PrincInv Primary Operating Revenue (US$bn) Op't Revenue / FO FTE Headcount (US$m) Operating Revenue (US$bn) Op't Revenue / FO FTE Headcount (US$m) $1.6bn $0.4bn $13.9bn $11.6bn $25.1bn $18.7bn $13.3bn $10.0bn 0 10 20 30 40 50 60 3m15 0.9% 1.0% -0.3% 1.3% -1.9% -0.6% -3.5% 0.5% 2.0% 0.3% -0.1% 0.6% -0.3% 2.3% 4.1% -1.9% -1.5% -12.5% 1.5% -0.9% 0.2% 6.6% 0.9% 3.6% 0.3% -2.7% -0.15 -0.1 -0.05 0 0.05 0.1 BAML BARC BNPP Citi CS DBK GS HSBC JPM MS RBS SG UBS mkt share gain mkt share loss Revenue Pre-Tax Profit
- 2. Sector 2 / 6 20 May 2016 © Tricumen Limited 2016. All rights reserved. Primary issuance & Advisory In DCM, bond and loan issuance fees dropped by c.27% globally, despite 20% growth in APAC ex- Japan. Margins achieved on loan deals were moderately ahead of 1Q15 - largely due to the US markets - but this was not the case in bond deals, suggesting a dim outlook for banks' earnings in 2Q16 and perhaps beyond. Securitisation is still struggling. In the USA, Goldman Sachs and Citi placed US$1.8bn of CMBS paper in March; but in Europe, AFME data shows that 1Q16 was the worst since 2011 as concerns about capital charges outweigh ECB's and EU efforts. Agency CMO issuance was also depressed. ECM fees and volumes halved from 1Q15 in both Europe and the USA. All major industry sectors registered sharp drops, especially financials, healthcare and real estate. APAC ex-Japan, by comparison, outperformed, declining 'only' 27% from prior-year period. M&A/Advisory was essentially unchanged from 1Q15 - except in the USA, where fees declined c.25% y/y. Fees from technology firms jumped, but financials and healthcare suffered steep falls. Operating Revenue (1Q15) (1Q16) % change share of peer group operating revenue and pre-tax profit (1Q16 / 1Q15) Notes: (1) Tricumen product definitions throughout. (2) Revenue is post-writedowns, excludes DVA/equivalent and one-offs. (3) Headcount: Front office full-time equivalent, adjusted for seniority. (4) Pre-tax profit excludes Prop & Principal Investments. $0.7m $1.9m $0.5m 0.5 1 1.5 2 2.5 3 3.5 0.8 1 1.2 $0.6m $1.1m $0.4m 0.5 1 1.5 2 2.5 3 3.5 0.8 1 1.2 DCM & Securitisation ECM M&A / Advisory Operating Revenue (US$bn) Op't Revenue /FO FTE Headcount (US$m) Operating Revenue (US$bn) Op't Revenue /FO FTE Headcount (US$m) $3.5bn $3.4bn $2.8bn $1.4bn $7.0bn $5.1bn 0 2 4 6 8 10 12 14 3m15 0.4% 1.5% 0.2% -0.2% -1.3% -0.6% 0.3% 0.5% -1.7% 1.1% 0.1% 0.4% -0.6% 0.2% 2.3% 0.8% 2.0% -2.5% -2.8% -0.2% 0.2% -0.4% 0.5% 0.2% -0.3% -0.04 -0.03 -0.02 -0.01 0 0.01 0.02 0.03 BAML BARC BNPP Citi CS DBK GS HSBC JPM MS RBS SG UBS N/M mkt share gain mkt share loss Revenue Pre-Tax Profit
- 3. Sector 3 / 6 20 May 2016 © Tricumen Limited 2016. All rights reserved. FICC In FX, both spot and emerging markets remain depressed, with client revenue opportunity 25-32% below 1Q15. Swap and options recovered slightly from the weak 4Q15, cushioning the blow. Banks in this report have cut front office headcount by 32% since 2012; with no apparent catalyst for the recovery in sight and increasing electronification, we expect further cuts in staffing levels. Swap rates markets steadied in the USA and, to a lesser extent, Europe; the overall client revenue opportunity grew in Japan for JGBs. Exotics revenue registered a moderate decline. Credit was the key area of weakness, mostly due to severe weakness in Europe. Europe is likely to experience further disruption: from mid-May, largest traders are obliged to start moving the region's derivatives benchmarks through central clearinghouses. In March, the ECB expanded its stimulus programme to include corporate bonds, though the initial surge in activity appeared to have cooled off by early April. CDO issuance nosedived as the CLO market faltered. Commodities revenue extended a sharp decline seen in recent quarters as banks pulled out of most markets. Goldman Sachs, with its significant investment in natural gas, is - for now - an exception. The revenue opportunity grew modestly in the USA, but dropped in Europe and APAC. Operating Revenue (1Q15) (1Q16) % change share of peer group operating revenue and pre-tax profit: (1Q16 / 1Q15) Notes: (1) Tricumen product definitions throughout. (2) Revenue is post-writedowns, excludes DVA/equivalent and one-offs. (3) Headcount: Front office full-time equivalent, adjusted for seniority. (4) Pre-tax profit excludes Prop & Principal Investments. $1.6m $1.1m $1.8m $1.0m 0.5 1 1.5 2 2.5 3 3.5 0.8 1 1.2 $1.6m $1.0m $1.1m $1.1m 0.5 1 1.5 2 2.5 3 3.5 0.8 1 1.2 FX Rates Credit Commodities Operating Revenue (US$bn) Op't Revenue /FO FTE Headcount (US$m) Operating Revenue (US$bn) Op't Revenue /FO FTE Headcount (US$m) $1.7bn $1.2bn $8.9bn $4.7bn $8.2bn $7.5bn $6.3bn $5.4bn 0 5 10 15 20 25 30 3m15 1.1% 1.4% -0.0% 2.8% -2.5% -0.8% -4.6% 1.1% 3.4% -2.0% -0.3% 1.0% -0.5% 4.2% 3.1% -4.0% 3.2% -23.3% 7.5% -0.5% 3.1% 17.5% -6.6% -4.6% 2.3% -2.1% -0.3 -0.25 -0.2 -0.15 -0.1 -0.05 0 0.05 0.1 0.15 0.2 BAML BARC BNPP Citi CS DBK GS HSBC JPM MS RBS SG UBS mkt share gain mkt share loss Revenue Pre-Tax Profit
- 4. Sector 4 / 6 20 May 2016 © Tricumen Limited 2016. All rights reserved. Equities Cash equity revenues were strong in European and US hi-touch markets, and in European electronic markets. This, however, was more than offset by the weakness in North American and APAC electronic markets. In APAC hi-touch, the activity has returned to levels last seen before the Mutual Market Access between China and Hong Kong led to a surge in trading activity. In equity derivatives, structured products were the key underperformer, especially in Europe and APAC. Listed products held up better. Prime services were broadly unchanged despite a slowdown in securities lending in the US. Hedge funds' assets under management were in-line with 1Q15. Operating Revenue (1Q15) (1Q16) % change share of peer group operating revenue and pre-tax profit (1Q16 / 1Q15) Notes: (1) Tricumen product definitions throughout. (2) Revenue is post-writedowns, excludes DVA/equivalent and one-offs. (3) Headcount: Front office full-time equivalent, adjusted for seniority. (4) Pre-tax profit excludes Prop & Principal Investments. $0.6m $1.0m $0.8m 0.5 1 1.5 2 2.5 3 3.5 0.8 1 1.2 $0.5m $0.8m $0.8m 0.5 1 1.5 2 2.5 3 3.5 0.8 1 1.2 EQ Cash EQ Derv'& Converts Prime Services Operating Revenue (US$bn) Op't Revenue / FO FTE Headcount (US$m) Operating Revenue (US$bn) Op't Revenue / FO FTE Headcount (US$m) $3.1bn $3.0bn $6.2bn $4.5bn $4.7bn $4.1bn 0 2 4 6 8 10 12 14 16 3m15 0.5% -0.4% -1.4% 0.2% -2.2% -1.1% 1.7% -0.6% 2.2% 2.9% -1.3% -0.5% 8.7% 7.3% -2.8% 1.6% -8.4% -5.5% -3.1% -2.0% 8.9% 6.8% -2.9% -8.7% -0.1 -0.08 -0.06 -0.04 -0.02 0 0.02 0.04 0.06 0.08 0.1 BAML BARC BNPP Citi CS DBK GS HSBC JPM MS RBS SG UBS N/A mkt share gain mkt share loss
- 5. Sector 5 / 6 20 May 2016 © Tricumen Limited 2016. All rights reserved. Revenue dynamics 1Q16 / 1Q15 (Operating revenue, % change, US$, Global Level 1) Source: Tricumen. Notes: (1) Tricumen product definitions throughout. (2) Arrows show % change in revenue vs peers. Up- /down-arrows: top-/bottom-quartile. (3) Revenue is post-writedowns, excludes DVA/equivalent and one-offs, as described in the Company Section. BAML BARC BNPP Citi CS DBK GS HSBC JPM MS RBS SG UBS Top 25% Bottom 25% Capital Markets: Total -15% -30% Primary -16% -30% DCM Bonds -12% -28% DCM Loans +9% -28% Securitisation -13% -45% ECM N/M -31% -49% M&A / Advisory N/M +11% -19% Sales & Trading -14% -33% FX -3% -18% Rates +3% -22% Credit N/M -16% -66% Commodities N/M N/M -10% -47% EQ Cash N/M +2% -19% EQ Derv & Converts N/M -15% -40% Prime Services N/M +2% -12% Prop Trading N/M N/M N/M N/M N/M N/M N/M -11% -64% Principal Investments N/M N/M N/M N/M N/M N/M N/M N/M N/M -66% -92%
- 6. Sector 6 / 6 20 May 2016 © Tricumen Limited 2016. All rights reserved. About Tricumen Tricumen was founded in 2008. It quickly became a strong provider of diversified market intelligence across the capital markets and has since expanded into transaction and corporate banking coverage. Tricumen’s data has been used by many of the world’s leading investment banks as well as strategy consulting firms, investment managers and ‘blue chip’ corporations. Situated near Cambridge in the UK, Tricumen is almost exclusively staffed with senior individuals with an extensive track record of either working for or analysing banks; and boasts what we believe is the largest capital markets-focused research network of its peer group. Notes & Caveats Tricumen Limited has used all reasonable care in writing, editing and presenting the information found in this report. All reasonable effort has been made to ensure the information supplied is accurate and not misleading. For the purposes of cross- market comparison, all numerical data is normalised in accordance to Tricumen Limited’s proprietary product classification. Fully-researched dataset may contain margin of error of 10%; for modelled datasets, this margin may be wider. The information and commentary provided in this report has been compiled for informational purposes only. We recommend that independent advice and enquiries should be sought before acting upon it. Readers should not rely on this information for legal, accounting, investment, or similar purposes. No part of this report constitutes investment advice, any form of recommendation, or a solicitation to buy or sell any instrument or to engage in any trading or investment activity or strategy. Tricumen Limited does not provide investment advice or personal recommendation nor will it be deemed to have done so. Tricumen Limited makes no representation, guarantee or warranty as to the suitability, accuracy or completeness of the report or the information therein. Tricumen Limited assumes no responsibility for information contained in this report and disclaims all liability arising from negligence or otherwise in respect of such information. Tricumen Limited is not liable for any damages arising in contract, tort or otherwise from the use of or inability to use this report or any material contained in it, or from any action or decision taken as a result of using the report. © Tricumen Limited 2016. All rights reserved