DataBench infographic: "Big Data Analytics = Big Opportunities for EU companies"
•
0 recomendaciones•60 vistas

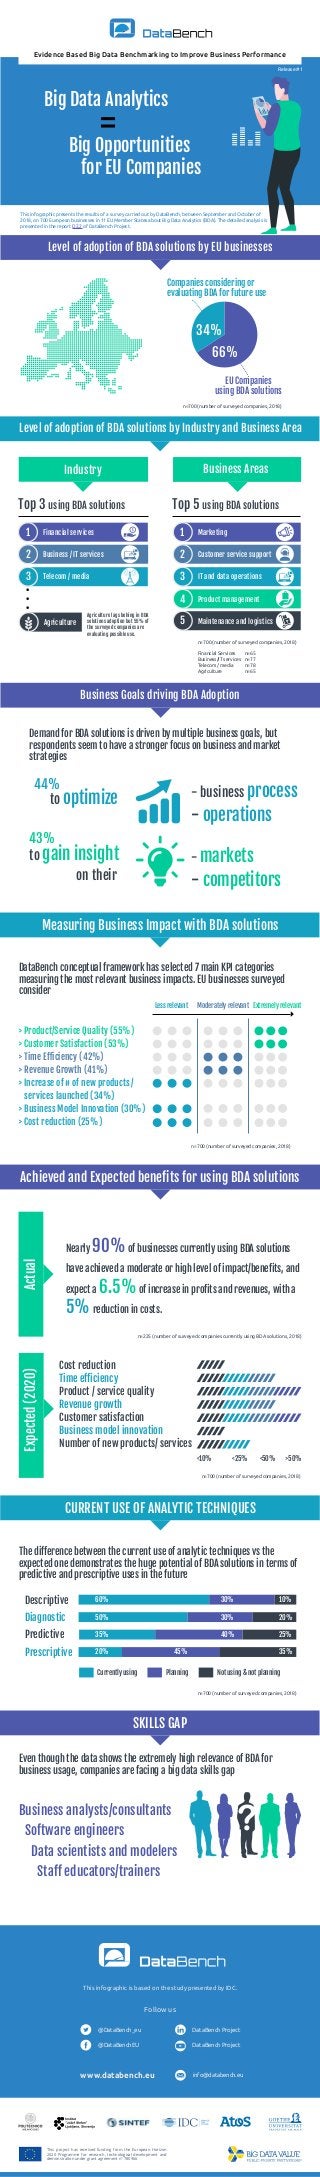
DataBench project has developed the first of a series of infographics presenting the results of a survey about Big Data and Analytics (BDA) on 700 European companies. The survey carried out by DataBench between September and October 2018 investigated the actual or planned use of BDA by 700 European businesses in 11 EU Member States and identified the relevance of business KPIs for BDA users.
Recomendados

Recomendados
Más contenido relacionado
Más de DataBench
Más de DataBench (17)
Último
Último (20)
DataBench infographic: "Big Data Analytics = Big Opportunities for EU companies"
- 1. 3 Telecom / media Big Data Analytics Big Opportunities for EU Companies = 1 2 Business / IT services Marketing1 Financial services This infographic is based on the study presented by IDC. Evidence Based Big Data Benchmarking to Improve Business Performance Follow us @DataBench_eu DataBench Project @DataBenchEU DataBench Project www.databench.eu info@databench.eu Release #1 This infographic presents the results of a survey carried out by DataBench, between September and October of 2018, on 700 European businesses in 11 EU Member States about Big Data Analytics (BDA). The detailed analysis is presented in the report D2.2 of DataBench Project. n=700 (number of surveyed companies, 2018) n=700 (number of surveyed companies, 2018) Financial Services n=65 Business/IT services n=77 Telecom / media n=78 Agriculture n=65 n=700 (number of surveyed companies, 2018) n=225 (number of surveyed companies currently using BDA solutions, 2018) n=700 (number of surveyed companies, 2018) n=700 (number of surveyed companies, 2018) Level of adoption of BDA solutions by EU businesses EU Companies using BDA solutions Business Goals driving BDA Adoption to optimize - business process - operations to gain insight on their - markets - competitors Achieved and Expected benefits for using BDA solutions SKILLS GAP Business analysts/consultants Software engineers Data scientists and modelers Staff educators/trainers ? 66% 34% Companies considering or evaluating BDA for future use Demand for BDA solutions is driven by multiple business goals, but respondents seem to have a stronger focus on business and market strategies 44% 43% DataBench conceptual framework has selected 7 main KPI categories measuring the most relevant business impacts. EU businesses surveyed consider Nearly 90%of businesses currently using BDA solutions have achieved a moderate or high level of impact/benefits, and expect a 6.5%of increase in profits and revenues, with a 5%reduction in costs. The difference between the current use of analytic techniques vs the expected one demonstrates the huge potential of BDA solutions in terms of predictive and prescriptive uses in the future Even though the data shows the extremely high relevance of BDA for business usage, companies are facing a big data skills gap Industry Top 3 using BDA solutions Level of adoption of BDA solutions by Industry and Business Area Business Areas Top 5 using BDA solutions 3 IT and data operations 2 Customer service support 4 Product management 5 Maintenance and logistics Agriculture lags behing in BDA solutions adoption but 55% of the surveyed companies are evaluating possible use. Agriculture Measuring Business Impact with BDA solutions > Product/Service Quality (55%) > Customer Satisfaction (53%) > Time Efficiency (42%) > Revenue Growth (41%) > Increase of # of new products / services launched (34%) > Business Model Innovation (30%) > Cost reduction (25%) Less relevant Moderately relevant Extremely relevant ActualExpected(2020) Cost reduction Time efficiency Product / service quality Revenue growth Customer satisfaction Business model innovation Number of new products/ services <10% <25% <50% >50% CURRENT USE OF ANALYTIC TECHNIQUES Descriptive Diagnostic Predictive Prescriptive Currently using Planning Not using & not planning 60% 30% 10% 50% 30% 20% 35% 40% 25% 20% 45% 35% This project has received funding from the European Horizon 2020 Programme for research, technological development and demonstration under grant agreement n° 780966