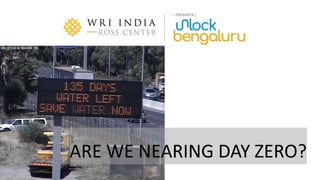
Unlock Bengaluru 2018: Water - Are we nearing Day Zero?
•
1 recomendación•643 vistas

By Samrat Basak, WRI India

Recomendados
Recomendados
Más contenido relacionado
La actualidad más candente
La actualidad más candente (20)
Similar a Unlock Bengaluru 2018: Water - Are we nearing Day Zero?
Similar a Unlock Bengaluru 2018: Water - Are we nearing Day Zero? (20)
Más de WRI Ross Center for Sustainable Cities
Más de WRI Ross Center for Sustainable Cities (20)
Último
Último (20)
Unlock Bengaluru 2018: Water - Are we nearing Day Zero?
- 1. A product of WRI Ross Center for Sustainable Cities ARE WE NEARING DAY ZERO?
- 3. February 2018 July 2018 IN THE NEWS
- 4. KEY WATER POSITIVES ~11 million people are getting ‘improved’ supply of water No major outbreak of water borne disease reported so far Basic water supply (for human health and livelihood) was available even during climatic stress period Water supply network coverage expanding as the city grows Reported budgetary provision for infrastructure upgradation to meet future water demand *As per UN definition improved water supply is a mix of piped and non-piped supply (boreholes, tubewells, protected wells and springs, rainwater, packaged water (bottled and sachets) and delivered water (tanker trucks and small carts))
- 5. Natural Resources Watershed Surface water Groundwater Stormwater Water quality City Open space Green and blue cover Supply infrastructure Access Other Climate change Strategic priorities Political Priorities Citizen behavior Economic condition KEY WATER STRESSES
- 6. FUNCTIONING 19 TMC (APPROVED) + 10 TMC (PROPOSED) HISTORY OF BENGALURU’S WATER SUPPLY 1500s to 1896 1896 to 1974 1974 to present Source: Anon. Historical Map of Bengaluru, India, circa 1924. Wikimedia Commons Source: Shyamal L. Hesaraghatta Lake. 2007. Wikimedia Commons Source: BWSSB. EMPRI. Water Safety Plan for Bengaluru. 2014 KEMPEGOWDA AND COLONIAL REIGN Interconnected cascading tank system with 100 + tanks for rainwater storage and water supply for Bengaluru ARKAVATHI RIVER 1896 – Hesaraghata Lake – 1st large reservoir for filtered water supply 1933 – 2nd reservoir at TG Halli due to drying up of Hesaraghatta Lake CAUVERY RIVER 1974 to present – BWSSB expands water supply from Cauvery River to meet increasing demand of Bengaluru DEPLETED
- 7. SURFACE WATER SOURCES FOR BENGALURU Map generated by WRI India for study purpose only Intake point on Cauvery – 1,350 MLD Intake point at TG Halli Reservoir Historical Intake Point at Hesaraghatta Lake – Now Dried-up
- 8. SOURCING WATER FROM CAUVERY Source: Google Earth Pro | http://www.indiaspend.com/cover-story/bengaluru-wastes-nearly-50-water- supply-from-cauvery-53879 BWSSB spends nearly 60% of its budget pumping water to Bengaluru. Cauvery River Bengaluru City Shivasamudra Elevation at Bengaluru City Elevation at Shivasamudra
- 9. CHANGE IN CAUVERY WATERSHED CONDITION Data source: MODIS (USGS/ NASA); BBMP | NDVI index used to estimate vegetation changes | *Tree cover loss estimated using Global Forest Watch- Water (http://water.globalforestwatch.org ) | Map generated by WRI India for study purpose only The watershed upstream of Bengaluru’s intake point has suffered ~5000 Ha of tree cover loss from 2001 to 2014* Loss in tree cover impacts water availability and water quality at a catchment level.
- 10. CHANGE IN CAUVERY WATERSHED CONDITION Data source: Global Forest Watch-Water (http://water.globalforestwatch.org ) Tree cover lost in watershed approximately the area of 1,500 Chinnaswamy Stadiums
- 11. MULTIPLE DEFICIENT RAINFALL EVENTS IMPACT SURFACE WATER AVAILABILITY Normal rainfall Deficient rainfall Mean rainfall 880 mm Scanty rainfall 1871 1875 1879 1883 1887 1891 1895 1899 1903 1907 1911 1915 1919 1923 1927 1931 1935 1939 1943 1947 1951 1955 1959 1963 1967 1971 1975 1979 1983 1987 1991 1995 1999 2003 2007 2011 2015 0 200 400 600 800 1000 1200 0 200 400 600 800 1000 1200 Average Annual Rainfall Mean Deficient (-20% to -60%) Scanty (-60% to -90%)
- 12. 0 10 20 30 40 50 60 70 -50 -30 -10 10 30 50 Dead Storage KRS Dead Storage Kabini KRS Capacity Kabini Capacity RESERVOIRS HYDROGRAPH AND SIGNIFICANT STRESS PERIODS Data on reservoir levels is sourced from Karnataka State Natural Disaster Monitoring Centre (KSNDMC) | Dead storage details of reservoirs sourced from Karnataka Water Resources Department | All volumes reported in thousand million cubic feet (TMC) Datagap(Jan-May2012) Dead Storage K.R.S. Reservoir: 4.401 TMC Dead Storage Kabini Reservoir: 3.52 TMC 8.9 7.8 Capacity in reservoirs at MDDL (an indication of CRITICAL water volume within the reservoir) Water levels in K.R.S. and Kabini reservoirs have fallen to MDDL level simultaneously which places water supply to Bengaluru at risk.
- 13. GROUNDWATER SOURCE FOR BENGALURU Data source: Central Ground Water Board | Map generated by WRI India for study purpose only Ground water stress in and around Bengaluru is critically high as aquifers are over-exploited Groundwater is being used like an overdrawn credit card that we are not repaying
- 14. BENGALURU GROWTH 1990-2015 Data source: European Commission JRC; LandSat (USGS/ NASA) | Population for 2015 generated using 4% growth rate over the 2011 Census data | Map generated by WRI India for study purpose only Bengaluru’s population and built-up area has doubled in the last 25 years 1990 2000 2010 2015Units Built-up Area 230 292 340 453Sq km Population 4,129,424 5,688,985 8,495,492 9,938,524
- 15. Data source: LandSat (USGS/ NASA) | Normalized Difference Vegetation Index (NDVI) used to estimate vegetation changes | Map generated by WRI India for study purpose only BENGALURU’S OPEN SPACES AND VEGETATION 134 107 103 107 331 299 242 135 0 100 200 300 400 1990 2000 2010 2015 Areainsquare kilometres High Density Green Cover Open Space Linear (Open Space) High density green cover (NDVI Index > 30) has not changed significantly Open space has diminished from half of Bengaluru in 1990 to only one-fifth of the city in 2015
- 16. OPEN SPACE BECOMES BUILT UP AREA 56 51 40 46 80 53 29 14 0 10 20 30 40 50 60 70 80 90 1990 2000 2010 2015 Areainsquaremetres Per Capita Builtup Area Per Capita Open Space Per Capita open space decreased by 83%in 25 years
- 17. OPEN SPACE AND LAKE FLOOD PLAIN BECOMES BUILT UP AREA Source: Google Earth Bellandur and surroundings 2003
- 18. OPEN SPACE AND LAKE FLOOD PLAIN BECOMES BUILT UP AREA Source: Google Earth Bellandur and surroundings 2017
- 19. BENGALURU’S VANISHING WATERS Data source: European Commission JRC; LandSat (USGS/ NASA) | Map generated by WRI India for study purpose only 15 11 25 16 154 116 98 30 0 20 40 60 80 100 120 140 160 1990 2000 2010 2015 Areainsquarekilometres BBMP BMRDA Linear (BMRDA) 80% decrease in surface water bodies within the Bengaluru metropolitan region
- 20. BENGALURU TEMPERATURE CHANGES Maps generated by WRI India for study purpose only Doddanna Industrial Layout Kaveri Nagar Nandini Layout Peenya Phase IV Peenya Phase I Peenya Phase II PEENYA INDUSTRIAL AREA Langford Town Kalasipalayam Jayanagar Lal Bagh Shanti Nagar Bus Depot JAYANAGAR RESIDENTIAL AREA
- 21. Image credit: Samrat Basak BENGALURU’S WATER FUTURE
- 22. POTENTIAL WATER SCENARIOS FOR BENGALURU *Business as usual (BAU) | **Demand-supply gap is met through groundwater use at present | Water volumes reported in million litres per day (MLD) 670 920 1050 1140 1575 1800 1930 2730 3110 750 1030 1180 1230 980 850 1165 700 475 1870 1070 690 2018 2025 2031 BAU* (49.25%) 30% 20% 1300 990 840 2021 Surface Water Supply: Cauvery Stage I to Stage IV Phase 2 (17 TMC/ Year) Projected Surface Water Supply: Cauvery Stage I to Stage IV Phase 2 (19 TMC/ Year) Projected Surface Water Supply: Cauvery Stage I to Stage V Phase 2 (29 TMC/ Year) Projected Surface Water Supply: Cauvery Stage I to Stage V Phase 2 + Linganmakki + Etinahole (29 + 10 + 10 TMC/ Year) Non-Revenue Water 1234 4321 Legend Demand- supply gap** Surface water supply