SlideShare una empresa de Scribd logo
1 de 2
Descargar para leer sin conexión
XXThe Houston business cycle index improved to an an-
nualized –0.7 percent in April from a revised rate of –1.3
percent in March. The weak numbers were driven pri-
marily by job losses. Cumulatively, the index is down an
annualized 1.4 percent in 2016. Though further data revi-
sions to the index will come, it is now sending a clearer
signal of modest contraction in the region’s economy.
XXJobs in goods-producing industries are far more cycli-
cal than the service sector and have taken the brunt of
the oil bust. The private service sector is still expanding.
However, the growth rates for both goods and services
have been falling since last summer as the oil bust deep-
ened and the impact of lower oil prices spilled into other
industries in Houston.
XXTotal nonfarm employment in Houston contracted
an annualized 1 percent over the three months ending
in April. Construction and mining (–4,082 and –2,868
jobs, respectively), manufacturing (–5,086) and profes-
sional and business services (–3,985) led decliners. Job
growth came mostly from private educational and health
services (5,897), leisure and hospitality (2,388), and
government (2,300).
XXYear-over-year growth in total employment was just
under –0.1 percent in April, marking the fourth consecu-
tive month of year-over-year contraction.
XXHouston’s unemployment rate rose from 5.1 percent
in March to 5.2 percent in April, its highest level since
March 2014. Despite weakness in the local labor market,
Houston’s labor force has continued to grow this year.
The unemployment rate was 5 percent in the U.S. and
4.4 percent in Texas in April.
Business-Cycle Index
Houston Private Goods & Services
Employment Growth
Percent*
Index, January 2010 = 100
NOTES: Data show seasonally adjusted and annualized percentage growth by industry supersector. Numbers in parentheses
represent share of total employment and may not sum to 100 due to rounding.
SOURCES: Bureau of Labor Statistics; adjustments by the Dallas Fed.
*Annualized month-over-month growth rate.
SOURCE: Dallas Fed.
*Recession dates defined using final data for the Houston Business-Cycle Index.
SOURCES: Bureau of Labor Statistics; adjustments by the Dallas Fed.
Houston Economic Indicators
FEDERAL RESERVE BANK OF DALLAS • MAY 31, 2016
DALLASFED
The broader economy of Houston continues to struggle as the 2015–16 oil bust matures. The service sector is
gradually slowing, and goods producers—particularly those tied to energy—continue to hemorrhage jobs.
Leading indicators of the regional economy are mixed but continue to point toward a modestly negative outlook in the near term.
Summary
-6
-4
-2
0
2
4
6
8
10
12
14
2012 2013 2014 2015 2016
Average since 2000 = 3.2
2015 growth rate = 0.2
2016 YTD = –1.4
92
104
116
128
2006 2007 2008 2009 2010 2011 2012 2013 2014 2015 2016
Houston recession*
Service-producing jobs
Goods-producting jobs
-1.0
0.8
-3.4
2.4
6.4
-11.0
3.1
-8.4
-2.5
-2.1
0.5
-0.1
1.0
-1.9
2.2
4.5
-5.4
5.3
-9.5
0.8
-0.6
0.5
Total
Trade, transp & utilities (21%)
Professional & business svc (16%)
Government (13%)
Educational & health services (13%)
Construction & mining (10%)
Leisure & hospitality (10%)
Manufacturing (8%)
Financial activities (5%)
Other services (4%)
Information (1%)
Jan. 2016 to Apr. 2016
Apr. 2015 to Apr. 2016
NOTE: Data may not match previously published numbers due to revisions.
CONTACT: For questions or information, contact Jesse Thompson at jesse.thompson@dal.frb.org.
More Dallas Fed economic updates: www.dallasfed.org/research/update/
XXService sector growth has softened unevenly in the
three months ending in April. While job growth in retail
trade (2,700) accelerated slightly over that time, most
other sectors and subsectors slowed. Administrative and
related jobs slowed sharply, declining at an annual rate
of 6 percent (–3,500 jobs), which was concentrated in
employment service firms.
XXAccommodation and food services was another sector
to slow substantially. While it is up strongly year to year,
it contracted slightly (–771 jobs) from January to April,
its first three-month decline since February 2011. The
recent decline was centered in restaurants and bars.
XXPrivate health employment growth slowed in recent
months despite a pickup in hospitals, which added 1,500
jobs from January to April. Robust hospital construction
activity suggests that both public and private hospital
employment growth will likely remain healthy in the
coming months.
XXThe Texas Leading Index ticked up in March and April
as all of the index components improved. This not only
suggests a better outlook for the state of Texas ahead, but
suggests that the growth rate of employment in Hous-
ton should recover slightly over the next three to four
months.
XXThe Leading Economic Index for the U.S. also perked
up in April on the back of a broad improvement in its
components. This implies better employment growth
numbers in Houston six months from now—more so for
service-producing industries than goods-producing.
XX The Houston Purchasing Managers Index was 44.2
in April—remaining in the mid-40s. A powerful leading
indicator for employment in Houston, this indicates that
employment growth over the next three months will
likely remain tepid.
XXHowever, the sales and production components of the
index have risen markedly in 2016 and may indicate that
the overall index will soon improve.
Service Sector Jobs
Job Growth–Health
Purchasing Managers Index and Employment Growth
Leading Indicators
NOTE: April Texas Leading Index data point is an estimate.
SOURCES: The Conference Board; Dallas Fed.
Texas Leading Index and U.S. Leading Index
NOTES: Data are annualized and seasonally adjusted percent changes. Sorted from largest to smallest industry.
SOURCES: Bureau of Labor Statistics; adjustments by the Dallas Fed.
NOTE: Employment growth is a monthly, seasonally adjusted annual rate. Composite index values >50 indicate expansion, and
index values <50 indicate contraction.
SOURCES: Institute for Supply Managment; Bureau of Labor Statistics; Dallas Fed.
Job Growth–Selected Service Industries
-10
-8
-6
-4
-2
0
2
4
6
8
10
30
35
40
45
50
55
60
65
70
2008 2009 2010 2011 2012 2013 2014 2015
.
Houston employment
Houston PMI
2016
NOTES: Data show seasonally adjusted and annualized percentage employment growth. Numbers in parentheses represent share
of total health employment and may not sum to 100 due to rounding.
SOURCES: Bureau of Labor Statistics; adjustments by the Dallas Fed.
4.5
3.7
6.7
3.83.5 3.3
7.1
0.1
0
1
2
3
4
5
6
7
8
Total Ambulatory health
(46%)
Hospitals (27%) Other health (27%)
Apr. 2015 to Apr. 2016
Jan. 2016 to Apr. 2016
Average since 2000
105
107
109
111
113
115
117
119
121
123
125
120
122
124
126
128
130
132
134
2012 2013 2014 2015 2016
Texas Leading Index
U.S. leading index
3.4
3.7
-0.8
-2.5
-1.8
-0.3
0.7
4.0
-1.1
-1.4
-6.0
-2.6
0.4
-1.0
Retail trade
Accommodation & food services
Professional, scientific & technical
Admin, waste mgt, remediation & related
Wholesale trade
Transportation
Finance & insurance
Apr. 2015 to Apr. 2016
Jan. 2016 to Apr. 2016
Percent
Index, 1987 = 100 Index, 2010 = 100
Index Percent

Más contenido relacionado

La actualidad más candente

October 2015 U.S. employment update and outlook
October 2015 U.S. employment update and outlookOctober 2015 U.S. employment update and outlook
October 2015 U.S. employment update and outlookJLL
 
October 2016 U.S. employment update and outlook
October 2016 U.S. employment update and outlookOctober 2016 U.S. employment update and outlook
October 2016 U.S. employment update and outlookJLL
 
Monthly Newsletter 9/2015
Monthly Newsletter 9/2015Monthly Newsletter 9/2015
Monthly Newsletter 9/2015Latvijas Banka
 
US Talent Market Monthly April 2014
US Talent Market Monthly April 2014US Talent Market Monthly April 2014
US Talent Market Monthly April 2014Kelly Services
 
20150209_AFPEconWatch-2
20150209_AFPEconWatch-220150209_AFPEconWatch-2
20150209_AFPEconWatch-2Kevin Roth
 
UK Labour Market - April 2015
UK Labour Market - April 2015UK Labour Market - April 2015
UK Labour Market - April 2015Miqui Mel
 
The employment situation – october 2010
The employment situation – october 2010The employment situation – october 2010
The employment situation – october 2010ztcindy
 
December 2015 U.S. employment update and outlook
December 2015 U.S. employment update and outlookDecember 2015 U.S. employment update and outlook
December 2015 U.S. employment update and outlookJLL
 
US employment rate data and trends – December 2016
US employment rate data and trends – December 2016 US employment rate data and trends – December 2016
US employment rate data and trends – December 2016 JLL
 
January Labour Market Update
January Labour Market UpdateJanuary Labour Market Update
January Labour Market UpdateKaylan Bland
 
November 2016 U.S. employment update and outlook
November 2016 U.S. employment update and outlookNovember 2016 U.S. employment update and outlook
November 2016 U.S. employment update and outlookJLL
 
Cushman & Wakefield Residential Market Commentary - May 2017
Cushman & Wakefield Residential Market Commentary - May 2017Cushman & Wakefield Residential Market Commentary - May 2017
Cushman & Wakefield Residential Market Commentary - May 2017Lee Layton
 
Federal reserve challenge script
Federal reserve challenge scriptFederal reserve challenge script
Federal reserve challenge scriptNandita Venkatesan
 
Q1 2016 Global Talent Market Quarterly
Q1 2016 Global Talent Market QuarterlyQ1 2016 Global Talent Market Quarterly
Q1 2016 Global Talent Market QuarterlyKelly Services
 
Q1 2015 Global Talent Market Quarterly
Q1 2015 Global Talent Market QuarterlyQ1 2015 Global Talent Market Quarterly
Q1 2015 Global Talent Market QuarterlyKelly Services
 
Presentation for web1 4
Presentation for web1 4Presentation for web1 4
Presentation for web1 4richwalker84
 
Summary slides: London's labour market in the recessions
Summary slides: London's labour market in the recessionsSummary slides: London's labour market in the recessions
Summary slides: London's labour market in the recessionsMelisaWickham
 
April 2015 U.S. employment update and outlook
April 2015 U.S. employment update and outlookApril 2015 U.S. employment update and outlook
April 2015 U.S. employment update and outlookJLL
 

La actualidad más candente (20)

October 2015 U.S. employment update and outlook
October 2015 U.S. employment update and outlookOctober 2015 U.S. employment update and outlook
October 2015 U.S. employment update and outlook
 
October 2016 U.S. employment update and outlook
October 2016 U.S. employment update and outlookOctober 2016 U.S. employment update and outlook
October 2016 U.S. employment update and outlook
 
Monthly Newsletter 9/2015
Monthly Newsletter 9/2015Monthly Newsletter 9/2015
Monthly Newsletter 9/2015
 
US Talent Market Monthly April 2014
US Talent Market Monthly April 2014US Talent Market Monthly April 2014
US Talent Market Monthly April 2014
 
20150209_AFPEconWatch-2
20150209_AFPEconWatch-220150209_AFPEconWatch-2
20150209_AFPEconWatch-2
 
UK Labour Market - April 2015
UK Labour Market - April 2015UK Labour Market - April 2015
UK Labour Market - April 2015
 
The employment situation – october 2010
The employment situation – october 2010The employment situation – october 2010
The employment situation – october 2010
 
December 2015 U.S. employment update and outlook
December 2015 U.S. employment update and outlookDecember 2015 U.S. employment update and outlook
December 2015 U.S. employment update and outlook
 
Economic Review 2015-11
Economic Review 2015-11Economic Review 2015-11
Economic Review 2015-11
 
Emerging Economy May 2009 Indicus Analytics
Emerging Economy May 2009 Indicus AnalyticsEmerging Economy May 2009 Indicus Analytics
Emerging Economy May 2009 Indicus Analytics
 
US employment rate data and trends – December 2016
US employment rate data and trends – December 2016 US employment rate data and trends – December 2016
US employment rate data and trends – December 2016
 
January Labour Market Update
January Labour Market UpdateJanuary Labour Market Update
January Labour Market Update
 
November 2016 U.S. employment update and outlook
November 2016 U.S. employment update and outlookNovember 2016 U.S. employment update and outlook
November 2016 U.S. employment update and outlook
 
Cushman & Wakefield Residential Market Commentary - May 2017
Cushman & Wakefield Residential Market Commentary - May 2017Cushman & Wakefield Residential Market Commentary - May 2017
Cushman & Wakefield Residential Market Commentary - May 2017
 
Federal reserve challenge script
Federal reserve challenge scriptFederal reserve challenge script
Federal reserve challenge script
 
Q1 2016 Global Talent Market Quarterly
Q1 2016 Global Talent Market QuarterlyQ1 2016 Global Talent Market Quarterly
Q1 2016 Global Talent Market Quarterly
 
Q1 2015 Global Talent Market Quarterly
Q1 2015 Global Talent Market QuarterlyQ1 2015 Global Talent Market Quarterly
Q1 2015 Global Talent Market Quarterly
 
Presentation for web1 4
Presentation for web1 4Presentation for web1 4
Presentation for web1 4
 
Summary slides: London's labour market in the recessions
Summary slides: London's labour market in the recessionsSummary slides: London's labour market in the recessions
Summary slides: London's labour market in the recessions
 
April 2015 U.S. employment update and outlook
April 2015 U.S. employment update and outlookApril 2015 U.S. employment update and outlook
April 2015 U.S. employment update and outlook
 

Destacado

Dt Ad Banner
Dt Ad BannerDt Ad Banner
Dt Ad BannerDionLynk
 
Historia y ciencias sociales
Historia y ciencias socialesHistoria y ciencias sociales
Historia y ciencias socialesPaula Molina
 
circle of strength
circle of strengthcircle of strength
circle of strengthEl HaLev
 
Manual para dispensação de medicamentos sujeitos a controle especial
Manual para dispensação de medicamentos sujeitos a controle especialManual para dispensação de medicamentos sujeitos a controle especial
Manual para dispensação de medicamentos sujeitos a controle especialIsabela Jacyntho
 
Recent trends in the global ecenomy and the near term outlook
Recent trends in the global ecenomy and the near term outlookRecent trends in the global ecenomy and the near term outlook
Recent trends in the global ecenomy and the near term outlookLatvijas Banka
 
Lekcija: Eirozonas ekonomika un monetārā politika (ENG)
Lekcija: Eirozonas ekonomika un monetārā politika (ENG)Lekcija: Eirozonas ekonomika un monetārā politika (ENG)
Lekcija: Eirozonas ekonomika un monetārā politika (ENG)Latvijas Banka
 
Recent trends in the global ecenomy and the near term outlook
Recent trends in the global ecenomy and the near term outlookRecent trends in the global ecenomy and the near term outlook
Recent trends in the global ecenomy and the near term outlookLatvijas Banka
 

Destacado (14)

Web 2.0 11 02
Web 2.0 11 02Web 2.0 11 02
Web 2.0 11 02
 
پټه خزانه
پټه خزانهپټه خزانه
پټه خزانه
 
Dt Ad Banner
Dt Ad BannerDt Ad Banner
Dt Ad Banner
 
Videojuegos
VideojuegosVideojuegos
Videojuegos
 
Historia y ciencias sociales
Historia y ciencias socialesHistoria y ciencias sociales
Historia y ciencias sociales
 
circle of strength
circle of strengthcircle of strength
circle of strength
 
Examen23
Examen23Examen23
Examen23
 
Conde lucanor
Conde lucanorConde lucanor
Conde lucanor
 
Manual para dispensação de medicamentos sujeitos a controle especial
Manual para dispensação de medicamentos sujeitos a controle especialManual para dispensação de medicamentos sujeitos a controle especial
Manual para dispensação de medicamentos sujeitos a controle especial
 
Automate Your Marketing
Automate Your Marketing Automate Your Marketing
Automate Your Marketing
 
Recent trends in the global ecenomy and the near term outlook
Recent trends in the global ecenomy and the near term outlookRecent trends in the global ecenomy and the near term outlook
Recent trends in the global ecenomy and the near term outlook
 
Lekcija: Eirozonas ekonomika un monetārā politika (ENG)
Lekcija: Eirozonas ekonomika un monetārā politika (ENG)Lekcija: Eirozonas ekonomika un monetārā politika (ENG)
Lekcija: Eirozonas ekonomika un monetārā politika (ENG)
 
Recent trends in the global ecenomy and the near term outlook
Recent trends in the global ecenomy and the near term outlookRecent trends in the global ecenomy and the near term outlook
Recent trends in the global ecenomy and the near term outlook
 
Extended surface fins
Extended surface finsExtended surface fins
Extended surface fins
 

Similar a hou160531

Reci Q1 2016 Houston MOB Report
Reci Q1 2016 Houston MOB ReportReci Q1 2016 Houston MOB Report
Reci Q1 2016 Houston MOB ReportThomas Amato
 
Economic update (may 2013)
Economic update (may 2013)Economic update (may 2013)
Economic update (may 2013)veredus
 
Minneapolis–St. Paul Employment Update | July 2016
Minneapolis–St. Paul Employment Update | July 2016Minneapolis–St. Paul Employment Update | July 2016
Minneapolis–St. Paul Employment Update | July 2016Carolyn Bates
 
May 2017 U.S. employment update and outlook
May 2017 U.S. employment update and outlookMay 2017 U.S. employment update and outlook
May 2017 U.S. employment update and outlookJLL
 
March 2016 U.S. employment update and outlook
March 2016 U.S. employment update and outlookMarch 2016 U.S. employment update and outlook
March 2016 U.S. employment update and outlookJLL
 
Minneapolis–St. Paul Employment Update | September 2016
Minneapolis–St. Paul Employment Update | September 2016Minneapolis–St. Paul Employment Update | September 2016
Minneapolis–St. Paul Employment Update | September 2016Carolyn Bates
 
GHP Houston: The Economy at a Glance
GHP Houston: The Economy at a GlanceGHP Houston: The Economy at a Glance
GHP Houston: The Economy at a GlanceBob Lowery
 
August 2018 U.S. employment update and outlook
August 2018 U.S. employment update and outlookAugust 2018 U.S. employment update and outlook
August 2018 U.S. employment update and outlookJLL
 
Minneapolis–St. Employment Update | December 2015
Minneapolis–St. Employment Update | December 2015Minneapolis–St. Employment Update | December 2015
Minneapolis–St. Employment Update | December 2015Carolyn Bates
 
Minneapolis–St. Employment Update | May 2016
Minneapolis–St. Employment Update | May 2016Minneapolis–St. Employment Update | May 2016
Minneapolis–St. Employment Update | May 2016Carolyn Bates
 
February 2016 U.S. employment update and outlook
February 2016 U.S. employment update and outlook February 2016 U.S. employment update and outlook
February 2016 U.S. employment update and outlook JLL
 
November 2015 U.S. employment update and outlook
November 2015 U.S. employment update and outlookNovember 2015 U.S. employment update and outlook
November 2015 U.S. employment update and outlookJLL
 
Lehigh Valley Job & Labor Market Outlook - December 2014
Lehigh Valley Job & Labor Market Outlook - December 2014Lehigh Valley Job & Labor Market Outlook - December 2014
Lehigh Valley Job & Labor Market Outlook - December 2014Don Stewart
 
April 2016 U.S. employment update and outlook
April 2016 U.S. employment update and outlookApril 2016 U.S. employment update and outlook
April 2016 U.S. employment update and outlookJLL
 
Minneapolis–St. Paul Employment Update | October 2016
Minneapolis–St. Paul Employment Update | October 2016Minneapolis–St. Paul Employment Update | October 2016
Minneapolis–St. Paul Employment Update | October 2016Carolyn Bates
 
June 2017 U.S. employment update and outlook
June 2017 U.S. employment update and outlookJune 2017 U.S. employment update and outlook
June 2017 U.S. employment update and outlookJLL
 
Minneapolis–St. Paul Employment Update | August 2016
Minneapolis–St. Paul Employment Update | August 2016Minneapolis–St. Paul Employment Update | August 2016
Minneapolis–St. Paul Employment Update | August 2016Carolyn Bates
 
February Labour Market Update
February Labour Market UpdateFebruary Labour Market Update
February Labour Market UpdateKaylan Bland
 

Similar a hou160531 (20)

Reci Q1 2016 Houston MOB Report
Reci Q1 2016 Houston MOB ReportReci Q1 2016 Houston MOB Report
Reci Q1 2016 Houston MOB Report
 
Economic update (may 2013)
Economic update (may 2013)Economic update (may 2013)
Economic update (may 2013)
 
Minneapolis–St. Paul Employment Update | July 2016
Minneapolis–St. Paul Employment Update | July 2016Minneapolis–St. Paul Employment Update | July 2016
Minneapolis–St. Paul Employment Update | July 2016
 
May 2017 U.S. employment update and outlook
May 2017 U.S. employment update and outlookMay 2017 U.S. employment update and outlook
May 2017 U.S. employment update and outlook
 
March 2016 U.S. employment update and outlook
March 2016 U.S. employment update and outlookMarch 2016 U.S. employment update and outlook
March 2016 U.S. employment update and outlook
 
Minneapolis–St. Paul Employment Update | September 2016
Minneapolis–St. Paul Employment Update | September 2016Minneapolis–St. Paul Employment Update | September 2016
Minneapolis–St. Paul Employment Update | September 2016
 
GHP Houston: The Economy at a Glance
GHP Houston: The Economy at a GlanceGHP Houston: The Economy at a Glance
GHP Houston: The Economy at a Glance
 
August 2018 U.S. employment update and outlook
August 2018 U.S. employment update and outlookAugust 2018 U.S. employment update and outlook
August 2018 U.S. employment update and outlook
 
Minneapolis–St. Employment Update | December 2015
Minneapolis–St. Employment Update | December 2015Minneapolis–St. Employment Update | December 2015
Minneapolis–St. Employment Update | December 2015
 
US Talent Market Monthly
US Talent Market Monthly US Talent Market Monthly
US Talent Market Monthly
 
Minneapolis–St. Employment Update | May 2016
Minneapolis–St. Employment Update | May 2016Minneapolis–St. Employment Update | May 2016
Minneapolis–St. Employment Update | May 2016
 
February 2016 U.S. employment update and outlook
February 2016 U.S. employment update and outlook February 2016 U.S. employment update and outlook
February 2016 U.S. employment update and outlook
 
November 2015 U.S. employment update and outlook
November 2015 U.S. employment update and outlookNovember 2015 U.S. employment update and outlook
November 2015 U.S. employment update and outlook
 
Lehigh Valley Job & Labor Market Outlook - December 2014
Lehigh Valley Job & Labor Market Outlook - December 2014Lehigh Valley Job & Labor Market Outlook - December 2014
Lehigh Valley Job & Labor Market Outlook - December 2014
 
April 2016 U.S. employment update and outlook
April 2016 U.S. employment update and outlookApril 2016 U.S. employment update and outlook
April 2016 U.S. employment update and outlook
 
Minneapolis–St. Paul Employment Update | October 2016
Minneapolis–St. Paul Employment Update | October 2016Minneapolis–St. Paul Employment Update | October 2016
Minneapolis–St. Paul Employment Update | October 2016
 
June 2017 U.S. employment update and outlook
June 2017 U.S. employment update and outlookJune 2017 U.S. employment update and outlook
June 2017 U.S. employment update and outlook
 
Minneapolis–St. Paul Employment Update | August 2016
Minneapolis–St. Paul Employment Update | August 2016Minneapolis–St. Paul Employment Update | August 2016
Minneapolis–St. Paul Employment Update | August 2016
 
Utah Trendlines: November - December 2010
Utah Trendlines: November - December 2010Utah Trendlines: November - December 2010
Utah Trendlines: November - December 2010
 
February Labour Market Update
February Labour Market UpdateFebruary Labour Market Update
February Labour Market Update
 

hou160531

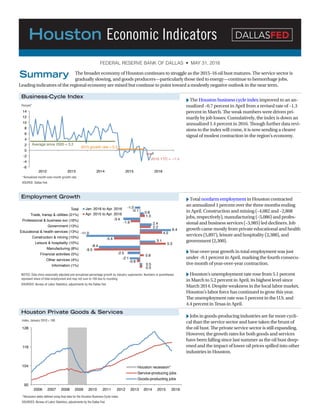
  • 1. XXThe Houston business cycle index improved to an an- nualized –0.7 percent in April from a revised rate of –1.3 percent in March. The weak numbers were driven pri- marily by job losses. Cumulatively, the index is down an annualized 1.4 percent in 2016. Though further data revi- sions to the index will come, it is now sending a clearer signal of modest contraction in the region’s economy. XXJobs in goods-producing industries are far more cycli- cal than the service sector and have taken the brunt of the oil bust. The private service sector is still expanding. However, the growth rates for both goods and services have been falling since last summer as the oil bust deep- ened and the impact of lower oil prices spilled into other industries in Houston. XXTotal nonfarm employment in Houston contracted an annualized 1 percent over the three months ending in April. Construction and mining (–4,082 and –2,868 jobs, respectively), manufacturing (–5,086) and profes- sional and business services (–3,985) led decliners. Job growth came mostly from private educational and health services (5,897), leisure and hospitality (2,388), and government (2,300). XXYear-over-year growth in total employment was just under –0.1 percent in April, marking the fourth consecu- tive month of year-over-year contraction. XXHouston’s unemployment rate rose from 5.1 percent in March to 5.2 percent in April, its highest level since March 2014. Despite weakness in the local labor market, Houston’s labor force has continued to grow this year. The unemployment rate was 5 percent in the U.S. and 4.4 percent in Texas in April. Business-Cycle Index Houston Private Goods & Services Employment Growth Percent* Index, January 2010 = 100 NOTES: Data show seasonally adjusted and annualized percentage growth by industry supersector. Numbers in parentheses represent share of total employment and may not sum to 100 due to rounding. SOURCES: Bureau of Labor Statistics; adjustments by the Dallas Fed. *Annualized month-over-month growth rate. SOURCE: Dallas Fed. *Recession dates defined using final data for the Houston Business-Cycle Index. SOURCES: Bureau of Labor Statistics; adjustments by the Dallas Fed. Houston Economic Indicators FEDERAL RESERVE BANK OF DALLAS • MAY 31, 2016 DALLASFED The broader economy of Houston continues to struggle as the 2015–16 oil bust matures. The service sector is gradually slowing, and goods producers—particularly those tied to energy—continue to hemorrhage jobs. Leading indicators of the regional economy are mixed but continue to point toward a modestly negative outlook in the near term. Summary -6 -4 -2 0 2 4 6 8 10 12 14 2012 2013 2014 2015 2016 Average since 2000 = 3.2 2015 growth rate = 0.2 2016 YTD = –1.4 92 104 116 128 2006 2007 2008 2009 2010 2011 2012 2013 2014 2015 2016 Houston recession* Service-producing jobs Goods-producting jobs -1.0 0.8 -3.4 2.4 6.4 -11.0 3.1 -8.4 -2.5 -2.1 0.5 -0.1 1.0 -1.9 2.2 4.5 -5.4 5.3 -9.5 0.8 -0.6 0.5 Total Trade, transp & utilities (21%) Professional & business svc (16%) Government (13%) Educational & health services (13%) Construction & mining (10%) Leisure & hospitality (10%) Manufacturing (8%) Financial activities (5%) Other services (4%) Information (1%) Jan. 2016 to Apr. 2016 Apr. 2015 to Apr. 2016
  • 2. NOTE: Data may not match previously published numbers due to revisions. CONTACT: For questions or information, contact Jesse Thompson at jesse.thompson@dal.frb.org. More Dallas Fed economic updates: www.dallasfed.org/research/update/ XXService sector growth has softened unevenly in the three months ending in April. While job growth in retail trade (2,700) accelerated slightly over that time, most other sectors and subsectors slowed. Administrative and related jobs slowed sharply, declining at an annual rate of 6 percent (–3,500 jobs), which was concentrated in employment service firms. XXAccommodation and food services was another sector to slow substantially. While it is up strongly year to year, it contracted slightly (–771 jobs) from January to April, its first three-month decline since February 2011. The recent decline was centered in restaurants and bars. XXPrivate health employment growth slowed in recent months despite a pickup in hospitals, which added 1,500 jobs from January to April. Robust hospital construction activity suggests that both public and private hospital employment growth will likely remain healthy in the coming months. XXThe Texas Leading Index ticked up in March and April as all of the index components improved. This not only suggests a better outlook for the state of Texas ahead, but suggests that the growth rate of employment in Hous- ton should recover slightly over the next three to four months. XXThe Leading Economic Index for the U.S. also perked up in April on the back of a broad improvement in its components. This implies better employment growth numbers in Houston six months from now—more so for service-producing industries than goods-producing. XX The Houston Purchasing Managers Index was 44.2 in April—remaining in the mid-40s. A powerful leading indicator for employment in Houston, this indicates that employment growth over the next three months will likely remain tepid. XXHowever, the sales and production components of the index have risen markedly in 2016 and may indicate that the overall index will soon improve. Service Sector Jobs Job Growth–Health Purchasing Managers Index and Employment Growth Leading Indicators NOTE: April Texas Leading Index data point is an estimate. SOURCES: The Conference Board; Dallas Fed. Texas Leading Index and U.S. Leading Index NOTES: Data are annualized and seasonally adjusted percent changes. Sorted from largest to smallest industry. SOURCES: Bureau of Labor Statistics; adjustments by the Dallas Fed. NOTE: Employment growth is a monthly, seasonally adjusted annual rate. Composite index values >50 indicate expansion, and index values <50 indicate contraction. SOURCES: Institute for Supply Managment; Bureau of Labor Statistics; Dallas Fed. Job Growth–Selected Service Industries -10 -8 -6 -4 -2 0 2 4 6 8 10 30 35 40 45 50 55 60 65 70 2008 2009 2010 2011 2012 2013 2014 2015 . Houston employment Houston PMI 2016 NOTES: Data show seasonally adjusted and annualized percentage employment growth. Numbers in parentheses represent share of total health employment and may not sum to 100 due to rounding. SOURCES: Bureau of Labor Statistics; adjustments by the Dallas Fed. 4.5 3.7 6.7 3.83.5 3.3 7.1 0.1 0 1 2 3 4 5 6 7 8 Total Ambulatory health (46%) Hospitals (27%) Other health (27%) Apr. 2015 to Apr. 2016 Jan. 2016 to Apr. 2016 Average since 2000 105 107 109 111 113 115 117 119 121 123 125 120 122 124 126 128 130 132 134 2012 2013 2014 2015 2016 Texas Leading Index U.S. leading index 3.4 3.7 -0.8 -2.5 -1.8 -0.3 0.7 4.0 -1.1 -1.4 -6.0 -2.6 0.4 -1.0 Retail trade Accommodation & food services Professional, scientific & technical Admin, waste mgt, remediation & related Wholesale trade Transportation Finance & insurance Apr. 2015 to Apr. 2016 Jan. 2016 to Apr. 2016 Percent Index, 1987 = 100 Index, 2010 = 100 Index Percent