Solaire Photovoltaïque : quelles réalités pour 2020 ?
Solar pv map
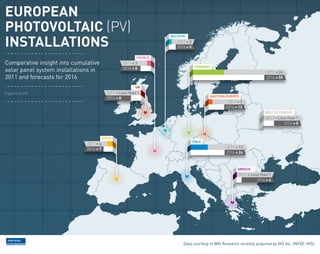
1. EUROPEAN
PHOTOVOLTAIC (PV)
INSTALLATIONS
BELGUIM
2011 = 2
2016 = 5
FRANCE
Comparative insight into cumulative 2011 = 3
GERMANY
2016 = 8
solar panel system installations in 2011 = 24
2011 and forecasts for 2016 2016 = 55
UK
Figures in GW 2011 = Less than 1
EASTERN EUROPE
2016 = 8
2011 = 3
2016 = 12
REST OF EUROPE
2011 = Less than 1
2016 = 8
SPAIN
ITALY
2011 = 4
2016 = 7 2011 = 13
2016 = 26
GREECE
2011 = Less than 1
2016 = 4
Data courtesy of IMS Research recently acquired by IHS Inc. (NYSE: IHS)