Elsevier Cancer Moonshot Infographic
•
2 recomendaciones•14,806 vistas

Cancer Research: Current Trends & Future Directions. See more Cancer Moonshot resources here: https://www.elsevier.com/connect/cancer-moonshot-resource-center
Recomendados

Recomendados
Más contenido relacionado
La actualidad más candente
La actualidad más candente (6)
Destacado
Destacado (16)
Similar a Elsevier Cancer Moonshot Infographic
Similar a Elsevier Cancer Moonshot Infographic (20)
Más de Elsevier
Más de Elsevier (20)
Último
Último (20)
Elsevier Cancer Moonshot Infographic
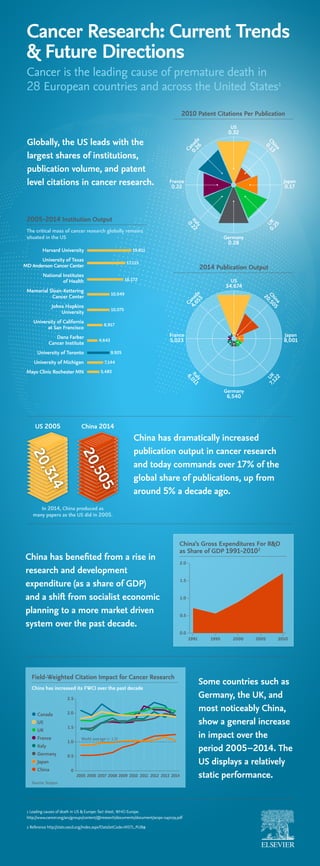
- 1. Cancer Research: Current Trends & Future Directions Cancer is the leading cause of premature death in 28 European countries and across the United States1 Globally, the US leads with the largest shares of institutions, publication volume, and patent level citations in cancer research. US 0.32 Canada 0.26 France 0.22 Germany 0.28 UK0.25 Italy 0.22 China 0.13 Japan 0.17 2010 Patent Citations Per Publication US 34,674 Canada 4,653 France 5,023 Germany 6,540 UK7,122 Italy 6,011 China 20,505 Japan 8,001 2014 Publication Output 2005-2014 Institution Output 19,811 17,115 Harvard University University of Texas MD Anderson Cancer Center National Institutes of Health Memorial Sloan-Kettering Cancer Center Johns Hopkins University University of California at San Francisco Dana Farber Cancer Institute University of Toronto University of Michigan Mayo Clinic Rochester MN 16,172 10,049 10,075 6,917 4,643 9,925 7,144 5,483 The critical mass of cancer research globally remains situated in the US 1 Leading causes of death in US & Europe: fact sheet, WHO Europe. http://www.cancer.org/acs/groups/content/@research/documents/document/acspc-047079.pdf 2 Reference http://stats.oecd.org/Index.aspx?DataSetCode=MSTI_PUB# China has dramatically increased publication output in cancer research and today commands over 17% of the global share of publications, up from around 5% a decade ago. China has benefited from a rise in research and development expenditure (as a share of GDP) and a shift from socialist economic planning to a more market driven system over the past decade. Some countries such as Germany, the UK, and most noticeably China, show a general increase in impact over the period 2005–2014. The US displays a relatively static performance. US 2005 China 2014 20,505 20,314 In 2014, China produced as many papers as the US did in 2005. China’s Gross Expenditures For R&D as Share of GDP 1991-20102 0.0 0.5 1.0 1.5 2.0 1991 1995 2000 2005 2010 Field-Weighted Citation Impact for Cancer Research China has increased its FWCI over the past decade 0 0.5 1.0 1.5 2.0 2.5 2005 20142006 2007 2008 2009 2010 2011 2012 2013 World average (= 1.0) US China Japan UK Germany Italy Canada France Source: Scopus