Dopamine neurotransmitter determination using graphite sheet- graphene nano-s...
Physics ii lab 1
1. Republic of the Philippines
BATANGAS STATE UNIVERSITY
ARASOF-Nasugbu
R. Martinez Street Brgy. Bucana
Nasugbu, Batangas
COLLEGE OF TEACHER EDUCATION
Group No. 01_____ Date: January 30, 2018
Section: BSED – 3202 Rating: _______________
Laboratory Activity No. 01
Experiment No. 01
I. Title
Water Molecules in Different Temperature
II. Introduction
In this experiment, the students should be able to identify the water molecule in
different temperature through the use of food coloring. How can one identify distinct
characteristics and exact temperature of hot and cold water without the aid of
thermometer?
This activity used food coloring as an indicator of heat in a sample of water with
known reading of hotness or coldness. All the variables in this experiment were
controlled except for the temperature in order to observe an accurate set-up. As hat
was pictured below, the glasses are in the same size and shape in order to lessen the
error in the experiment.
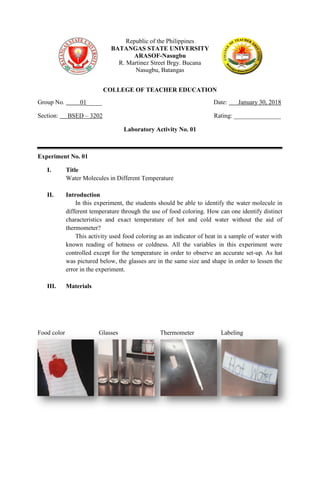
III. Materials
Food color Glasses Thermometer Labeling
2. IV. Procedure
1. Fill your glasses. Two should have hot water in it; the other two is for cold water.
The last glass is for the tap water.
2. Label the glasses you are going to use in the experiment.
3. Pick a color of food coloring. Put three (3) drops of food coloring in each glass.
4. Wait watch and record what happens.
V. Data and Results
1. Hot water
49.7 ° C
In hot water, the food coloring diffused quickly and evenly.
2. Cold water
10 ° C
The food coloring, when dropped in the cold water, compressed only at
the bottom of the glass.
3. Tap water
25 ° C
Food coloring, in tap water, diffused also like in a hot water but in a slow
process.
VI. Conclusions
The food coloring was used as an indicator for water in different temperature. The
molecules move very fast in a hot medium and there is the presence of motion unlike
in the cold water that the molecules are just condensed in a place. The group
concluded that if the temperature gets higher in a substance, the kinetic energy will
also increase.
VII. Answers to Questions/ Problems
1. What happens to the drop of food coloring?
The drop of food coloring differs in three glasses of water that has
different temperature. It just stays at the bottom of the cold water while in the hot
water it easily diffused. It also diffused at tap water but not as fast compared to
hotter one.
2. Does the food coloring behave the same in each of the jars? Why or why not?
The food coloring does not behave the same in each jar of the experiment
because they have different temperature.
3. What is different about glasses?
The only different factor in each glass of water is the temperature. The
appearance of each one also differs when the food coloring was applied into it.
There was also different motion of particles in each jar.
4. What can you say about the relationship between the heat and the movement of
molecules?
When the temperature is cold, the movements of molecules are very
minimal and slow. The motion of molecules becomes higher when the level of the
temperature also increases.
3. VIII. Documentation
Pictures show measuring temperature using thermometer, measuring the volume of
solution, and observing the lower meniscus of the beaker for accurate measurement.
Pictures show measurement of hot water, labeling it, and measuring its temperature.
Picture shows the label for tap water, cold water temperature reading, and actual color
of food coloring used.
Pictures show diffusion of food coloring in three different temperature of water; tap
water, hot water, and cold water.
4. Experiment No. 02
I. Title
Altering Air Pressure by Changing Temperature
II. Introduction
This activity enables students to observe what change will happen if the
temperature is applied in a specific area between open space and water. The group
used food coloring to easily identify the displacement of the water from its original
level and after trials or sets.
This activity was usually done on ordinary laboratory activity to illustrate the
relation of heat to the changing pressure on the environment.
III. Materials
Food color Glass
Candles Bowl
IV. Procedure
1. Set your candle on the plate and pour approximately ½ to 1 cup of water on the
plate.
2. Light your candle then place a jar or vase upside-down over the candle.
V. Data and Results
Set A
One candle
200 ml water
The water goes up a centimeter away from the level of surface of the origin.
5. Set B
Two candles
200 ml water
The water has observably higher elevation compared to the first set.
Set C
Three candles
200 ml water
The water reached the highest elevation among the three sets.
VI. Conclusions
The water in different sets under this experiment rise or elevated its level because
it replaces the space once occupied by the heat. Air pressure was greatly affected in
this activity. By changing the number of candles inside every set, there is an
observable variation which occurs when the light of the candle escape every time the
area was enclosed. As the number of candles become higher the elevation of water
surface also increases and it only means that greater heat is required to produce
greater pressure and vice versa.
VII. Answers to Questions/ Problems
1. As the candle goes out, all of the water sucked up into the jar. The water rises, but
why does the water rises?
The water rises because it used to get the same space as heat once
occupied.
2. What is the maximum amount of water your set-up can suck up?
In each three set-up, Set C has highest sucked-up water through the use of
three candles and it is almost half of the capacity volume of glass.
3. If you will change your glass container to something bigger or smaller, how will it
affect your results?
If the bigger container would be used, the water surface elevation would
be the only factor that is affected. The sucked-up volume would not change
because the amount of heat was not changed too.
4. Does changing your candle for a bigger or smaller one affect the results?
It depends on the amount of heat released by the candle because there are
big candles that have small or oversized flame. As a process in the different set-up,
the heat increase by adding a candle with the same size and shape.
5. How does changing the temperature of your water affect the results?
The temperature was changed through adding identical candle on each set.
As the temperature goes higher the amount of sucked-up amount of water also
increases because it occupies larger space once occupied by the heat that escaped
after the light of the candle used gets off.
6. VIII. Documentation
Pictures show the water poured into the bowl, the two candles was lighted, and a candle
lighted before it was covered using a glass.
Pictures show three lighted candles, closed set-up with uncolored water, and the actual
position of placing over a glass.
Pictures show the light getting off from a candle, enclosed set-up with colored water, and
two candles after rising of water.
Picture shows the three candles being washed by colored water after getting off of lights.
7. Experiment No. 03
I. Title
Phase Change of Water by Heat
II. Introduction
Water has different properties and it can also change its form into three different
forms namely: solid, liquid, and gas. A substance would undergo a phase change if it
reached its latent heat.
There are issued latent heat point for different substances after water. According
to the field of science in general, water’s boiling point is 100 °C and its freezing point
is 0 °C. In this activity, the students should be able to determine the change happen
from melting of ice to the boiling of the water and ice solution using recorded
temperature.
III. Materials
Beaker Lamp
Ice Tripod and wire gauze
Thermometer Stopwatch
8. IV. Procedure
1. Fill the beaker with ice and water.
2. Turn on your heat source. Do not put the beaker on the heat source yet. The
source of energy must remain constant throughout the experiment.
3. Insert a thermometer into the beaker and use it as a stirring rod – be sure to hold
the thermometer so that it does not touch the sides or bottom of the beaker.
4. Stir the solution gently throughout the experiment.
5. When the thermometer reaches its lowest reading, record this under time zero on
the Report sheet.
6. Quickly place the beaker on the heat source.
7. Read and record the temperature every 30 seconds, continuing for at least 10
minutes after the water reaches a full, rolling boil. Remember to continue stirring
throughout the experiment.
8. Record the time in your data:
a. When the ice begins to melt
b. When the ice is entirely melted
c. When the water begins to boil
9. Graph your data on the graph provided placing time on the horizontal axis.
V. Data and Results
Water
50 ml
Ice
30 grams
Water + Ice Solution
Starting point is 10 °C
The temperature reading was recorded after every thirty seconds.
Table 1. Water + Ice Solution over
Time Temperature Observation
00:00 10 °C The ice has no changes
00:30 10 °C The ice has no changes
01:00 10 °C The ice melts slowly
01:30 10 °C The ice melts slowly
02:00 10 °C The ice melts slowly
02:30 11 °C The ice melts slowly
03:00 11 °C The ice melts slowly
03:30 11 °C The ice melts slowly
04:00 11 °C The ice melts slowly
04:30 12 °C The ice melts slowly
05:00 12 °C The ice melts slowly
05:30 12 °C The ice melts slowly
06:00 12 °C The ice melts slowly
06:30 13 °C The ice melts moderately
07:00 13 °C The ice melts moderately
07:30 14 °C The ice melts moderately
08:00 14 °C The ice melts moderately
9. 08:30 15 °C The ice melts moderately
09:00 15 °C The ice melts moderately
09:30 15 °C The ice melts moderately
10:00 16 °C The ice melts quickly
10:30 16 °C The ice melts quickly
11:00 17 °C The ice melts quickly
11:30 17 °C The ice melts quickly
12:00 18 °C The ice melts quickly
12:30 18 °C The ice melts quickly
13:00 19 °C The ice melts quickly
13:30 20 °C The ice melts quickly
14:00 21 °C The ice is like a seed
14:30 21 °C The ice is like a seed
15:00 22 °C The ice is like a seed
15:30 22 °C The ice is like a seed
16:00 23 °C The ice is totally gone
16:30 24 °C There is no reaction
17:00 24 °C There is no reaction
17:30 25 °C There is no reaction
18:00 26 °C There is no reaction
18:30 27 °C There is no reaction
19:00 28 °C There is no reaction
19:30 29 °C There is no reaction
20:00 30 °C There is no reaction
20:30 30 °C There is no reaction
21:00 30 °C There is no reaction
21:30 31 °C There is no reaction
22:00 31 °C There is no reaction
22:30 32 °C There is no reaction
23:00 33 °C There is no reaction
23:30 34 °C There is no reaction
24:00 35 °C There is no reaction
24:30 36 °C There is no reaction
25:00 37 °C There is no reaction
25:30 39 °C There is no reaction
26:00 40 °C There is no reaction
26:30 42 °C There is no reaction
27:00 43 °C There is no reaction
27:30 45 °C There is no reaction
28:00 46 °C There are tiny bubbles
28:30 47 °C There are tiny bubbles
29:00 49 °C There are tiny bubbles
29:30 50 °C There are tiny bubbles
30:00 51 °C There are tiny bubbles
30:30 53 °C There are tiny bubbles
31:00 55 °C There are tiny bubbles
31:30 58 °C There are tiny bubbles
32:00 60 °C There are tiny bubbles
32:30 62 °C There are tiny bubbles
33:00 63 °C There are tiny bubbles
33:30 64 °C There are tiny bubbles
34:00 66 °C There are tiny bubbles
34:30 68 °C There are tiny bubbles
35:00 70 °C Tiny bubbles float slowly
35:30 75 °C Tiny bubbles float slowly
10. 0
10
20
30
40
50
60
70
80
90
100
0 5 10 15 20 25 30 35 40 45
Time and Temperature
36:00 78 °C Tiny bubbles float rapidly
36:30 84 °C Tiny bubbles float rapidly
37:00 89 °C Tiny bubbles float rapidly
37:30 92 °C The solution boils
38:00 93 °C The solution boils
38:30 94 °C The solution boils
39:00 93 °C The solution boils
39:30 94 °C The solution boils
40:00 93 °C The solution boils
This table and graph shows phase change of water and where specific temperature
and time as it happens. The temperature reading is almost constant and there were
times that it turns back a unit of temperature, maybe because of external factors like
air-conditioning of the laboratory.
VI. Conclusions
The ice melts as it is exposed to the heat; the phase change happened upon
encountering the latent heat. The rate of temperature displacement is affected by the
external factors which increases error in the experiment. It starts to become vapor
when it reaches the boiling point.
VII. Answers to Questions/ Problems
1. According to your graph, did the temperature of water/ ice increase while the ice
was melting?
The temperature of water and ice solution remains low as the ice was melting.
The temperature readings only increase a few units.
2. According to your graph, what happened to the temperature of the water between
the time the ice melted and the water boiled?
The temperature starts to rise constantly after the ice melted with the
consideration of external factors that may affect its rate.
Figure 1. Graphical representation of time (minute) and temperature (degree Celcius)
11. 3. According to your graph, what change occurred in the temperature after the water
began to boil?
The temperature becomes does not go beyond the highest reading and starts to
create a vapor.
4. What can you tell about the rate of temperature change between the time the ice
melted and the water boiled?
The rate of temperature change is not that constant as what is illustrated on the
graph. The rate in between is also unpredictable because of the affecting factors.
5. From the range of temperature change, what can you infer about the rate of
energy input during each minute?
The rate of energy is constant because, the first place, the lamp continuously
releases heat from the starting point. Technically, it is also constant for the reason that
its graph did not took 45° line straightly but it is affected by the coldness of ice and
the near peak of boiling point. Therefore, the energy release was constant.
6. Before the temperature began its steady rise, for what was the added heat being
used?
The added heat before the steady rise is for the process of melting ice.
7. During the time of steadily increasing temperature, what change in energy
occurred because of the added heat?
There is a constant change in energy because the water already accepts heat
constantly from the time that ice melted.
8. During the last ten minutes, what changes occurred because of the added heat?
The rate of the temperature doubles because there is already added heat and upon
reaching the boiling point, the degree of temperature plays only between three highest
units.
VIII. Documentation
Pictures show the lamp is being lighted, the starting point is measured, constant reading of
temperature through the use of thermometer, and the boiling point of water and ice solution.
12. Republic of the Philippines
BATANGAS STATE UNIVERSITY
ARASOF-Nasugbu
R. Martinez Street Brgy. Bucana
Nasugbu, Batangas
COLLEGE OF TEACHER EDUCATION
L A B O R A T O R Y R E P O R T
IN
PHYSICS FOR HEALTH SCIENCES II
Activity No. 01
Submitted by:
Balaquiot, Jasmin V.
Escorido, Jenny May F.
Panaligan, Erwin C.
Tampis, Perlyn B.
Tindugan, Aristotle E.
BSED - 3202
Submitted to:
Mr. Michael John V. Francisco
Course Instructor