Enloop Business Plan
•
1 recomendación•3,439 vistas

An example of an Enloop Business Plan from ExecutivePlan.

Recomendados
Más contenido relacionado
Último
Último (20)
Destacado
Destacado (20)
Enloop Business Plan
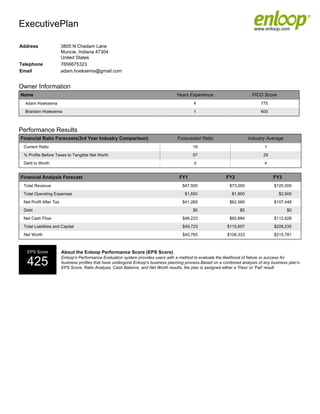
- 1. ExecutivePlan www.enloop.com Address 3805 N Chadam Lane Muncie, Indiana 47304 United States Telephone 7656675323 Email adam.hoeksema@gmail.com Owner Information Name Years Experience FICO Score Adam Hoeksema 4 775 Brandon Hoeksema 1 600 Performance Results Financial Ratio Forecasts(3rd Year Industry Comparison) Forecasted Ratio Industry Average Current Ratio 18 1 % Profits Before Taxes to Tangible Net Worth 57 29 Debt to Worth 0 4 Financial Analysis Forecast FY1 FY2 FY3 Total Revenue $47,500 $73,000 $125,000 Total Operating Expenses $1,650 $1,900 $2,900 Net Profit After Tax $41,265 $62,568 $107,448 Debt $0 $0 $0 Net Cash Flow $46,223 $65,884 $112,628 Total Liabilities and Capital $49,723 $115,607 $228,235 Net Worth $45,765 $108,333 $215,781 EPS Score About the Enloop Performance Score (EPS Score) Enloop's Performance Evaluation system provides users with a method to evaluate the likelihood of failure or success for 425 business profiles that have undergone Enloop's business planning process.Based on a combined analysis of any business plan's EPS Score, Ratio Analysis, Cash Balance, and Net Worth results, the plan is assigned either a 'Pass' or 'Fail' result.
- 2. ExecutivePlan 3805 N Chadam Lane Muncie, Indiana 47304 United States 7656675323 Business Plan Get your Free Business Plan at Enloop.com
- 3. Table of Contents Business Idea.........................................................................................................................................................................1 Product & Sales..................................................................................................................................................................... 1 Marketing................................................................................................................................................................................ 2 Management & Personnel..................................................................................................................................................... 2 Financial Forecast.................................................................................................................................................................. 2 Profit & Loss.......................................................................................................................................................................... 3 Cash Flow.............................................................................................................................................................................. 3 Balance Sheet........................................................................................................................................................................ 4 Financial Forecast - Three Year Reports .............................................................................................................................5 Product & Sales Forecast...................................................................................................................................... 5 Marketing Forecast................................................................................................................................................. 6 Profit & Loss Forecast............................................................................................................................................7 Cash Flow Forecast............................................................................................................................................... 8 Balance Sheet Forecast......................................................................................................................................... 9 Ratios (Year Three) ............................................................................................................................................................ 10 Get your Free Business Plan at Enloop.com iii
- 4. Table of Contents Get your Free Business Plan at Enloop.com iv
- 5. ExecutivePlan Business Plan Business Idea ExecutivePlan, formed as a Limited Liability Company, is a one- to two- year old company operating in the Administrative Management and General Management Consulting Services industry. The company's NAICS code is 541611. ExecutivePlan operates primarily as a Service provider. The company is owned by: Adam Hoeksema, who has four years of experience in the industry and a FICO score of 775. Brandon Hoeksema, who has one year of experience in the industry and a FICO score of 600. The primary address of the business is: 3805 N Chadam Lane Muncie, Indiana 47304 United States 7656675323 adam.hoeksema@gmail.com The starting date of this business plan is November 2011. ExecutivePlan helps entrepreneurs write more powerful business plan executive summaries in order to raise capital. We provide free tools, templates, examples, and how to ebooks along with executive summary consulting for select clients. Product & Sales ExecutivePlan is planning to sell one service. The company's Sales forecast is $2,500 in the first year, $25,000 in the second year and $75,000 in the third year. This results in a Gross Profit of $2,500, $25,000 and $75,000 and a Gross Margin Percentage of 100%, 100% and 100%. ExecutivePlan intends to sell Executive Summary Consulting services to startup companies looking to raise capital. Get your Free Business Plan at Enloop.com 1 of 10
- 6. ExecutivePlan Business Plan Marketing ExecutivePlan is expecting to spend a total of $750 in the first year, $1,000 in the second year and $2,000 in the third year. The company plans to spend an average of 12.2% of its sales revenue on one marketing expenses. Management & Personnel The company's management includes the following individuals: Adam Hoeksema, CEO Adam Hoeksema is the Client Services Manager at a large business incubator in Indiana. Adam works with entrepreneurs and startup companies on a daily basis in areas like online marketing and capital formation. ExecutivePlan has not yet identified any payroll positions. Financial Forecast The company has a starting cash balance of $3,500. The owners plan to contribute $1,000 in capital funding. Accounts Payables are set to 30 days, while Accounts Receivables are set to 10 days. The company is forecasting that 0% of their total sales will be on credit. Additionally, the company is forecasting $143,000 in Other Income, $6,450 in Total Operating Expenses for the first three years of operations. All forecasts in this business plan utilize Accrual Basis accounting. Get your Free Business Plan at Enloop.com 2 of 10
- 7. ExecutivePlan Business Plan Profit & Loss ExecutivePlan is forecasting Gross Profit for the first year of operations at $2,500, increasing to $25,000 in the second year and increasing to $75,000 in the third year. The average Gross Profit is $34,167. The company is forecasting Operating Expenses of $1,650 in the first year, $1,900 in the second year and $2,900 in the third year. Net Profit After Taxes is projected at $41,265 based on an expected income tax of $4,585 in the first year, $62,568 in the second year based on an expected income tax of $8,532 and $107,448 in the third year based on an expected income tax of $14,652. The owners plan to take a draw or dividend of $0 in the first year, $0 in the second year and $0 in the third year. The company is forecasting Retained Earnings of $41,265 in the first year, $62,568 in the second year and $107,448 in the third year. Cash Flow The owners have invested a total of $1,000 and are seeking a loan in the amount of $0. ExecutivePlan is forecasting Net Cash Flow for the first year of operations at $46,223, increasing to $65,884 in the second year and increasing to $112,628 in the third year. The Ending Cash Balance for the first year of operations is projected at $49,723, increasing to $115,607 in the second year and increasing to $228,235 in the third year. Get your Free Business Plan at Enloop.com 3 of 10
- 8. ExecutivePlan Business Plan Balance Sheet ExecutivePlan is forecasting Current Assets for the first year of operations at $49,723, increasing to $115,607 in the second year and increasing to $228,235 in the third year. Additionally, the company is forecasting Fixed Assets for the first year operations at $0, remaining the same at $0 in the second and third year. Current Liabilities for the first year of operations is forecasted at $3,958, increasing to $7,274 in the second year and increasing to $12,454 in the third year. Long Term Liabilities for the first year of operations is projected at $0, remaining the same at $0 in the second and third year. Capital for the first year of operations is forecasted at $45,765, increasing to $108,333 in the second year and increasing to $215,781 in the third year. The company's Total Liabilities and Capital for the first year of operations is $49,723, increasing to $115,607 in the second year and increasing to $228,235 in the third year. Get your Free Business Plan at Enloop.com 4 of 10
- 9. ExecutivePlan Business Plan Financial Forecast - Three Year Reports PRODUCT & SALES FORECAST Product & Sales Forecast Year 1 Year 2 Year 3 Executive Summary Consulting Unit Price $25.00 $50.00 $75.00 Units Sold 100 500 1,000 Totals Total Sales $2,500 $25,000 $75,000 Total Units Sold 100 500 1,000 Total Units Cost $0 $0 $0 Total Units Remaining 0 0 0 Get your Free Business Plan at Enloop.com 5 of 10
- 10. ExecutivePlan Business Plan MARKETING FORECAST Marketing Forecast Year 1 Year 2 Year 3 Expenses Website and Email $750 $1,000 $2,000 Totals Total Expenses $750 $1,000 $2,000 Get your Free Business Plan at Enloop.com 6 of 10
- 11. ExecutivePlan Business Plan PROFIT & LOSS FORECAST Profit & Loss Forecast Year 1 Year 2 Year 3 Revenue Sales $2,500 $25,000 $75,000 Other Income $45,000 $48,000 $50,000 COGS $0 $0 $0 Gross Profit $2,500 $25,000 $75,000 Payroll Expenses Salaries $0 $0 $0 Payroll Taxes and Benefits $0 $0 $0 Operating Expenses Advertising $750 $1,000 $2,000 Depreciation $0 $0 $0 Interest Expense $0 $0 $0 Telephone $600 $600 $600 Utilities $300 $300 $300 Totals Total Operating Expenses $1,650 $1,900 $2,900 Earnings before Taxes $45,850 $71,100 $122,100 Income Taxes $4,585 $8,532 $14,652 Owners Draws/Dividends $0 $0 $0 Retained earnings $41,265 $62,568 $107,448 Get your Free Business Plan at Enloop.com 7 of 10
- 12. ExecutivePlan Business Plan CASH FLOW FORECAST Cash Flow Forecast Year 1 Year 2 Year 3 Cash In Sales $2,500 $25,000 $75,000 Other Income $45,000 $48,000 $50,000 Loans Requiring Payback $0 $0 $0 Investments $1,000 $0 $0 Total Cash In $48,500 $73,000 $125,000 Cash Out COGS $0 $0 $0 Other Expenses $1,514 $1,879 $2,818 Payroll $0 $0 $0 Cash Paid for Taxes $763 $5,237 $9,554 Cash Paid for Fixed Assets $0 $0 $0 Loan Principal Payments $0 $0 $0 Loan Interest Payments $0 $0 $0 Owners Draws and Dividends $0 $0 $0 Total Cash Out $2,277 $7,116 $12,372 Net and Balance Starting Cash Balance $3,500 $49,723 $115,607 Net Cash Flow $46,223 $65,884 $112,628 Ending Cash Balance $49,723 $115,607 $228,235 Get your Free Business Plan at Enloop.com 8 of 10
- 13. ExecutivePlan Business Plan BALANCE SHEET FORECAST Balance Sheet Forecast Year 1 Year 2 Year 3 Current Assets Cash $49,723 $115,607 $228,235 Accounts Receivable $0 $0 $0 Inventory $0 $0 $0 Total Current Assets $49,723 $115,607 $228,235 Fixed Assets Fixed Assets $0 $0 $0 Less Accumulated Depreciation $0 $0 $0 Net Fixed Assets $0 $0 $0 Current Liabilities Accounts Payable $3,958 $7,274 $12,454 Deferred Revenue $0 $0 $0 Short Term Debt $0 $0 $0 Total Current Liabilities $3,958 $7,274 $12,454 Long Term Liabilities Long-Term Loans $0 $0 $0 Total Capital $45,765 $108,333 $215,781 Totals Total Assets $49,723 $115,607 $228,235 Total Liabilities and Capital $49,723 $115,607 $228,235 Get your Free Business Plan at Enloop.com 9 of 10
- 14. ExecutivePlan Business Plan Ratios (Year Three) Liquidity Ratios Company Current Ratio 18.3 Quick Ratio 18.3 Sales/Receivables N/A Day's Receivables 0 Cost of Sales/Inventory N/A Day's Inventory N/A Day's Payables N/A Sales/Working Capital 0.3 Operating Ratios Company Percent Profit Before Taxes/Tangible Net Worth 56.6 Percent Profit Before Taxes/Total Assets 53.5 Sales/Net Fixed Assets N/A Sales/Total Assets 0.3 Sales Growth 2 Profit Before Interest and Taxes 1.6 Net Profit Margin 1.4 Gross Margin 1 Expense to Sales Ratios Company Percent Depreciation, Depletion, Amortization/Sales 0 Selling General and Administrative 0 Advertising Expense 0 Coverage Ratios Company EBIT/Interest N/A Net Profit plus Depreciation N/A Leverage Ratios Company Fixed/Worth 0 Debt/Worth 0.1 Total Liabilities 0.1 Get your Free Business Plan at Enloop.com 10 of 10