

Recomendados
Más contenido relacionado
La actualidad más candente
La actualidad más candente (20)
Destacado
Destacado (14)
Similar a An overview of my PhD research
Similar a An overview of my PhD research (20)
Más de Felienne Hermans
Más de Felienne Hermans (14)
Último
Último (20)
An overview of my PhD research
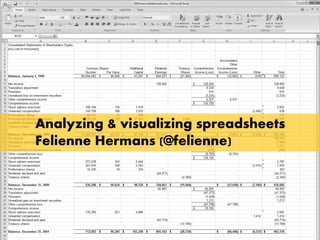
- 1. Analyzing & visualizing spreadsheets Felienne Hermans (@felienne)
- 2. Analyzing & visualizing spreadsheets Felienne Hermans (@felienne) In this slidedeck I present an overview of my PhD research. I recently defended my dissertation titled ‘Analyzing and visualizing Spreadsheets’
- 3. In this slidedeck I present an overview of my PhD research. I recently defended my dissertation titled ‘Analyzing and visualizing Spreadsheets’ This one!
- 4. Bridging the gap Funny story: I wasn’t hired to research spreadsheets at all. When I started my PhD project, I was supposed to research the gap between business users and programmers. Users Programmers
- 5. To research this gap, I started by studying business in practice
- 6. What surprised me, is that this gap wasn’t that big, it was more like a small creek than a huge cliff. Some programmers were heavilly involved in business, and even more interesting: some business guys were doing serious programming. Programmers Users
- 7. What surprised me, is that this gap wasn’t that big, it was more like a small creek than a huge cliff. Some programmers were heavilly involved in business, and even more interesting: some business guys were doing serious programming. In Excel! Programmers Users
- 8. What surprised me, is that this gap wasn’t that big, it was more like a small creek than a huge cliff. Some programmers were heavilly involved in business, and even more interesting: some business guys were doing serious programming. In Excel! So I looked into some previous work on the impact of spreadsheets on business. Programmers Users
- 9. 95% of all U.S. firms use spreadsheets for financial reporting
- 10. 90% of all analysts in industry perform calculations in spreadsheets
- 11. 50% of spreadsheets form the basis for decisions
- 12. Importance can grow over time When studying the impact of spreadsheets, we found that they do not become important overnight. As processes change, spreadsheets can become key company assets over time. Nobody sets out to create a mission critical spreadsheet, they “just happen”
- 13. This is a simple spreadsheet for many users Furthermore, spreadsheets can become surprisingly complex.
- 14. And, spreadsheet exist ‘under the radar’ Another interesting property of spreadsheets is that they often live ‘under the radar’: There is no list of spreadsheets, no one keeps track of what sheets are needed for what report and some spreadsheets do not have a clear owner.
- 15. Only 33% of spreadsheets has a manual Finally, spreadsheets are lacking documentation. In only one third of spreadsheets we found ‘documentation’ (i.e. Some sort of explanation on how to use the spreadsheet) Technical documentation, explaining why a spreadsheet was designed as it is, was hardly ever found.
- 16. Complex spreadsheets without documentation can lead to serious errors You can imagine the combination of all the above facts: • Spreadsheets are important • They are complex • They lack documentation is a potential recipe for disaster. And indeed, those errors happen
- 17. The European Spreadsheet Risk Interest Group (Eusprig.org) collects horror stories
- 27. Estimated loss: 10 billion dollars a year
- 28. We interviewed spreadsheet professionals Once I had studied related spreadsheet work and the horror stories from Eusprig, I wanted to gain a deeper understanding of spreadsheet problems in practice. So I interviewed 27 spreadsheet professionals at the Dutch Robeco bank.
- 29. We interviewed spreadsheet professionals Once I had studied related spreadsheet work and the horror stories from Eusprig, I wanted to gain a deeper understanding of spreadsheet problems in practice. So I interviewed 27 spreadsheet professionals at the Dutch Robeco bank. I asked only two questions (a semi- structured interview) to obtain an overall view of spreadsheet problems:
- 30. What annoys you?
- 31. And what makes you happy?
- 32. Financial professionals spend 2 days a week working with Excel From the interviews, we learned the following facts
- 33. Spreadsheets can have a long life, 5 years on average
- 34. Average sheet is used by 12 different people
- 35. There is a gap! Between importance and treatment. Then I concluded that there is an interesting gap that needs bridging: the gap between how important spreadsheets are and how well they are treated. So how could this gap be bridged?
- 36. It looks like software in the 70s! Let’s summarize the problems around spreadsheets again: • They lack documentation • They contain errors • They stay alive for several years and are used by several people • They are complex Does this remind you of something? It reminded me of the problems in the early days of software
- 37. Hence, we tried to bridge this gap with methods from software engineering.
- 38. Spreadsheet users lack great tool support If you compare the tooling of spreadsheet developers with that of software developers, the difference is clear.
- 39. Modern IDEs (like Visual Studio) have all kinds of build-in tools to help you build software in a responsible way: debugging, testing, analyzing and visualizing are accessible at the click of a button.
- 40. Compare this to a spreadsheet environment, like Excel. Lots of support to create a spreadsheet, with fonts and colors and borders, but none of the helpful tools to build a maintainable spreadsheet.
- 41. We did not start coding immediately However tempting, we did not start to build a spreadsheet IDE immediately. Instead, we looked at the results of the interviews, to find the most pressing information need that spreadsheet users had.
- 42. Most important problem: support for understanding spreadsheets was missing
- 43. To address this information need specifically, we developed our tool Breviz. This tool visualizes the dependencies among worksheets, depicted as rectangles with arrows drawn between them. The thicker the arrow, the more connections there are. Example: In worksheet ‘POA Project’ formulas are placed that refer to cells in ‘ProjectTeam’
- 44. We went back to practice With our tool, we went back to practice, to see whether it really supported spreadsheet users.
- 45. Turned out, it did. Some of the responses of users: “This diagram reminds me of what I had in mind when building”
- 46. Turned out, it did. Some of the responses of users: This remark is interesting: apparently, this spreadsheet user did do some modeling before building a spreadsheet. “This diagram reminds me of what I had in mind when building”
- 47. Turned out, it did. Some of the responses of users: A clear sign that we were on the right track! “This makes my job 10 times easier”
- 48. This work was published at ICSE 2011
- 49. However, unexpected things also happened. Not all spreadsheets looked as well structured as this one. Let’s look at some of them:
- 52. Here, pink blocks represent worksheets outside of the spreadsheet. So this spreadsheet gathers information from over 20 other worksheets and combines this information.
- 53. Users diagnosed with the diagrams We found that, due to the diversity on the diagrams, users started to judge spreadsheets based on their dataflow diagrams. We therefore formalized this feeling users had into ‘smells’ at the design level. These spreadsheet smells turned out to be very similar to code smells as defined by Fowler.
- 54. Consider for instance the ‘feature envy’ smell. This occurs when a method from class B refers to many fields outside its own class. This method envies all the cool fields that A has, hence the name.
- 55. Consider for instance the ‘feature envy’ smell. This occurs when a method from class B refers to many fields outside its own class. This method envies all the cool fields that A has, hence the name. Easy to see how this smell could be defined on spreadsheets, where a formula in worksheet B could be overly interested in cells on worksheet A.
- 56. We added support in Breviz for detecting and visualizing these inter-worksheet code smells.
- 57. We went back to practice Next, of course, we went back to practice, to see how users felt about the detected smells.
- 58. “That should be improved” Results showed that users understoond why certain constructions were qualified as smelly.
- 59. “That should be improved” Results showed that users understoond why certain constructions were qualified as smelly. “This must be confusing for others”
- 60. Published at ICSE 2012
- 61. However, new problems were to be discovered. We found that, once the structure of the spreadsheets had been understood and validated, complex formulas still got in the way of understanding spreadsheets.
- 62. This led us to the idea of formula smells
- 63. Again, we took our inpiration from the smells that Fowler defines in his canonical book on refctoring.
- 64. Published at ICSM 2012
- 65. In a recent extention of the paper, we also suggest refactorings corresponding to smells. This formula, for instance, contain the same subformula twice. Extracting this subformula into a seperate cell will improve readbility.
- 66. We went back to practice And again... A look in practice
- 67. We found that cloning (i.e. Copy pasting) in spreadsheets was a problem. If data is copy-pasted, updates will not be propagated to the copies and that might lead to errors. Based on existing work in clone detection in source code, we developed an algorithm to detec clones.
- 68. Clone visualization was added to our visualization, indicated with a dashed arrow. After all, when data is copy-pasted between worksheets, there is a dependency between those worksheets (albeit a different one than a formula link)
- 69. To validate our algorithm, we performed a case study at the distribution centre of the South Dutch food bank. There, they process 100.000 kilos of food per month, and keep track of that with spreadsheets. We were able to detect 61 near- miss clones, of which 25 were actual errors. Because of our analysis, this distrubution centre is now running error-free spreadsheets!
- 70. To be published at ICSE 2013
- 71. And this paper concluded my PhD thesis. I will continue to work on spreadsheet analysis for at least five more years at Delft University of Technology, so in the remaining few slides, I’ll line out what I will be working on in the future.
- 72. Remember spreadsheets stay in business for 5 years and are used by 12 people during their life span? This makes it interesting to consider ‘spreadsheet evolution’ and study how spreadsheets are created.
- 73. Visual Basic Analysis In our current visualization and analysis technique, we only consider formulas. However, spreadsheets also allow for code to interact with data and formulas (VBA code in Excel). By analyzing this, we could make our analysis more complete and interesting.
- 74. Spreadsheet testing Finally, we want to research how spreadsheet users test. One might think that spreadsheet users do not test, but this is not true.
- 75. In our previous studies, we often saw formules like this one. Here, nothing is really calculated. Instead, some sort of validation is performed: if ‘find zone’!W3 is smaller than 0, we are not interested in the value. When we could extract these type of formulas, we could use them to test the spreadsheet.
- 76. Analyzing and visualizing spreadsheets Felienne Hermans Thanks for reading about the research adventure I was enjoying the past 4 years! If you want to know more, have a look at my blog: www.felienne.com If you are intrested in collaborating, please send me an Email f.f.j.hermans@tudelft.nl or a tweet @felienne