FirstPartner 2015 Mobile Advertising & Marketing Market Map

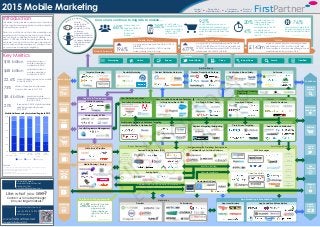
The FirstPartner Mobile Marketing Market Map provides an essential, visual snapshot of today’s highly complex (and valuable) mobile advertising and mobile marketing landscape. Reflecting major recent developments in the sector it highlights: • The key role of mobile in monetising social media and the growth in mobile video • The central role now played by audience, contextual and location data • The growth and growing sophistication of programmatic trading, including Real Time Bidding (RTB) and the emergence of programmatic direct • The rise of mobile video advertising and exchanges • App incentivisation and monetisation • Mobile loyalty The map also highlights key mobile ad spend growth stats and identifies number of recent acquisitions in the space. For more information or to download a printable version please visit www.firstpartner.net
Recomendados

Recomendados
Más contenido relacionado
Último
Último (20)
Destacado
Destacado (20)
FirstPartner 2015 Mobile Advertising & Marketing Market Map
- 1. Market Insight Proposition Development Product Launch Customer Engagement 2015 Mobile Marketing www.firstpartner.net Richard Warren Helen Motha rwarren@firstpartner.net +44 (0) 870 874 8700 @firstpartner hello@firstpartner.net Like what you see? Contacts Authors www.firstpartner.net Copyright FirstPartner Ltd 2015 hmotha@firstpartner.net Contact us for in-depth insight into your target markets! FirstPartner Introduction This Market Map provides a simple visual overview of the rapidly developing global mobile marketing & advertising ecosystem. Data is now at the heart of mobile marketing and programmatic trading has become more diverse, accounting for a significant share of display spend. Critically, mobile has emerged as the key consumer touch-point in multi-screen media and omni-channel retail environments - driving a focus on cross screen tracking & targeting. Key Metrics $18 billion estimated value of mobile advertising worldwide in 20141 $48 billion estimated value of mobile advertising worldwide in 20172 22.6% share of digital ad spend on mobile in the UK in 2014 3 73% share of Facebook ad revenue from mobile ads in Q1 2015 $8.4 billion predicted mobile programmatic spend in the US in 20155 21% forecasted CAGR of global mobile advertising spend between 2013-20186 Sources: 1 & 2) Gartner Forecast: Mobile Advertising, Worldwide, 2010-2017 3) PwC/IAB UK ‘Digital Adspend Study’, 2014 4) Facebook Financial Results Q4 2014 5) eMarketer, 2014 6) PwC 2013, Global entertainment and media outlook 2014-2018 Single Customer View Agencies Programmatic Trading Ecosystem Formats Native SearchVideoMessaging ClassifiedSocial Media Mobile helps to give advertisers a single view of the customer. Transactional & behavioural data is consolidated across channels, bridging the gap between offline and online. 93%of US consumers who use a smartphone to research go on to make a purchase and 65% want to make a purchase that day 68% of time spent on Facebook & 86% of time on Twitter is on mobile. 38% of all IP video views in Dec 2014 were on mobile or tablet - up 114% on Dec 2013 comScore 20% reported amount of time people spend looking at their smartphone in the US 4% mobile share of advertising revenues in the US KPCB, 2014Google/Nielsen & xAd/TelmetricsOoyala Video Index Advertisers Publishers In-App/GameBanner 76% of consumers agree that location-sharing provides more meaningful content. Media Telecoms Finance Retail Travel Automotive Technology Recommen- dation Apps Video & TV Search Engines Retailers Social Media Consumer Goods Apps & Games Salesforce Study, 2014 Ad Delivery Media Planning / Buying Content Distribution Networks Loyalty & Couponing Demand-Side Platforms (DSP) App Marketing & Monetisation Full Service & Creative SSP & Exchanges 100% 80% 60% 40% 20% 0% 44.3% 43.0% 12.7% 39.3% 54.3% 6.4% 40.4% 53.2% 6.3% 26.4% 27.5% 46.1% 26.2% 24.4% 49.4% APAC Europe North America Middle East & Africa Latin America Display Search Messaging Mobile Ad Revenue By Format and Region in 2013 Source: IHS, 2014 Networks Premium Performance Growth Formats Mobile Video Social Media y-o-y growth in spend in the UK to H1 2014 (UK IAB). According to the MMA, 75% of mobile video ads are shown in-app. Native y-o-y growth in social display spend in the UK to H1 2014 (£209m in H1 2014, up from £44m in H1 2013). Mobile accounted for 53% of social media spend in HI 2014 (UK IAB). Consumers continue to migrate to mobile.... App Acquisition & MonetisationApp Incentivisation Sell or Supply SideBuy or Demand Side Combined Buy & Sell-Side Platforms Ad serving Public exchange Yield optimisation Private exchange Programmatic direct Mediation Video Specialists Real Time Bidding Ad serving Decisioning/ Bid Management Audience Targeting (Millennial Media) (Facebook) Programmatic Direct/Automated Guaranteed Trading Desks Network Mediation Programmatic Direct (AppNexus) Web Publisher Ad ServersProximity MarketingTargeted Messaging Mobile Couponing Carrier Loyalty & CRM Loyalty Programme Management The Rush to Programmatic DMP 196% Creative Production & Delivery Verification & Brand Safety Cross-Screen Targeting App Analytics & AttributionAudience Targeting/Retargeting The Data Ecosystem DMPAnalytics Attribution & Optimsation Data Acquisition & Audience Definition Media Audience3rd Party & “Offline” Data Location & ContextEnd to End Marketing Platforms 1st Party Advertiser & CRM Performance Analytics & Audience Targeting Cross Screen Tracking & Device ID Advertising ID ID for Advertising 477% Device Demographic Location Media Usage Purchase: IntentContext 56% estimated mobile share of total programmatic digital display ad spend in the US in 2015 eMarketer, 2014 Value of content/native, including in-feed advertising in H1 2014 in the UK (UK IAB). Growing levels of native advertising in social media feeds is a key driver of this. £143m (Oracle) (Sizmek) (comScore) (O2) (Twitter) (Yahoo) (Cheetah Mobile) (Rubicon Project FirstPartner EVALUATIO N C O PY