Bermuda Tourism Year-end Statistical Highlights 2018
•
0 recomendaciones•9,169 vistas

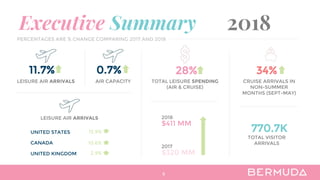
Year-end visitor arrival statistics for 2018 confirm three straight years of economic comeback and uninterrupted growth for the island’s tourism trade.

Recomendados
Recomendados
Más contenido relacionado
Similar a Bermuda Tourism Year-end Statistical Highlights 2018
Similar a Bermuda Tourism Year-end Statistical Highlights 2018 (20)
Más de Glenn Jones
Más de Glenn Jones (18)
Último
Último (20)
Bermuda Tourism Year-end Statistical Highlights 2018
- 1. Executive Summary 2018 4 11.7% LEISURE AIR ARRIVALS 28% TOTAL LEISURE SPENDING (AIR & CRUISE) 34% CRUISE ARRIVALS IN NON-SUMMER MONTHS (SEPT-MAY) LEISURE AIR ARRIVALS UNITED STATES CANADA UNITED KINGDOM 12.9% 10.6% 2.9% $411 MM $320 MM 2017 2018 770.7K TOTAL VISITOR ARRIVALS PERCENTAGES ARE % CHANGE COMPARING 2017 AND 2018 0.7% AIR CAPACITY
- 2. Most Visitor Arrivals Ever 2018 was the second consecutive year of record-breaking total visitor arrivals. Cruise passengers make up the largest share of total arrivals, something the National Tourism Plan sets out to improve by creating better balance between cruise and air passengers over the next five years. For further historical data, reference pg. 10 608,951 534,705 543,332 566,410 528,154 548,664 591,156 630,296 584,283 548,134 547,460 514,329 506,237 567,078 589,855 556,077 571,676 562,676 558,302 549,398 545,594 462,217 489,743 487,315 482,807 521,301 641,717 663,767 555,162 559,048 585,266 655,236 615,145 579,816 584,457 600,261 646,465 692,947 770,683 400,000 450,000 500,000 550,000 600,000 650,000 700,000 750,000 800,000 Arrivals (Air+Cruise+Yacht) 5
- 3. Most Leisure Air Arrivals Since 2002 • Bermuda's 203,697 leisure air arrivals in 2018 is the island's best performance since 2002, when 218,248 leisure travellers arrived by air • While 2018's volume did not best 2002, it outperformed 2006, previously the most recent highwater mark for a successful tourism year For further historical data, reference pg. 10 216,446 218,248 166,943 172,328 170,774 202,097 191,150 157,511 144,479 142,770 144,513 150,940 151,416 141,509 140,087 164,321 182,439 203,697 100,000 120,000 140,000 160,000 180,000 200,000 220,000 240,000 2001 2002 2003 2004 2005 2006 2007 2008 2009 2010 2011 2012 2013 2014 2015 2016 2017 2018 Leisure AirArrivals 6
- 4. Declining Business and VFR Air Visitors 7 191,150 157,511 144,479 142,770 144,513 150,940 151,416 141,385 140,087 164,321 182,439 203,697 42,162 41,836 38,908 38,122 36,288 32,932 32,688 34,165 31,721 32,321 34,774 29,014 67,562 60,808 50,354 49,975 53,461 46,649 50,456 46,583 44,418 43,938 48,089 46,644 - 50,000 100,000 150,000 200,000 YTD 2007 YTD 2008 YTD 2009 YTD 2010 YTD 2011 YTD 2012 YTD 2013 YTD 2014 YTD 2015 YTD 2016 YTD 2017 YTD 2018 Air Arrivals by Purpose of Visit VACATION/LEISURE VISITING FRIENDS & RELATIVES BUSINESS Series6 • There has been a downward trend in Business and VFR air arrivals over the past 12 years, down 31% in each category. • The increase in Leisure air arrivals has partially offset this loss.
- 5. A key objective in Bermuda's cruise travel strategy is to increase the amount of cruise calls to the island in the non-summer months. This targeted effort produced a 34% increase in cruise passengers outside the summer months while holding the summer months of June, July and August flat (+0.7%). Cruise Season Expansion For further information on Cruise Arrivals, reference pg. 12 893 520 1,823 21,847 63,557 41,044 37,473 7,311 1,124602 4,085 41,471 78,687 34,754 66,429 18,620 7,996 0 10,000 20,000 30,000 40,000 50,000 60,000 70,000 80,000 90,000 Jan Feb Mar Apr May Sept Oct Nov Dec Cruise Arrivals During Non-Summer Months 2014-17 Average 2018 8
- 6. 9 Leisure Air Visitors by City 2017 2018 # CHG YOY % CHG YOY New York 57,506 60,190 2,684 4.7% Boston 23,840 30,541 6,701 28.1% Philadelphia 9,171 9,948 777 8.5% Washington, DC 6,444 7,589 1,145 17.8% Toronto 4,126 4,362 236 5.7% Hartford 3,380 3,926 546 16.2% Atlanta 2,309 3,152 843 36.5% Baltimore 2,257 2,612 355 15.7% Chicago 2,282 2,303 21 0.9% San Francisco 1,684 1,652 -32 -1.9% Dallas 1,065 1,195 130 12.2% Growth in Focus and Nurture Cities Air leisure visitors from Bermuda's six primary target cities uniformly performed well in 2018 when compared to 2017. Meantime, five out of six future growth cities (identified in the National Tourism Plan as nurture cities) also delivered year-over-year growth. These are positive signs for the island's tourism future – both near and long term. For further insight on Air Visitor Source Markets, reference pg. 24 * Focus cities shaded in grey
- 7. 10 Leisure Air Visitors FOCUS & NURTURE CITIES