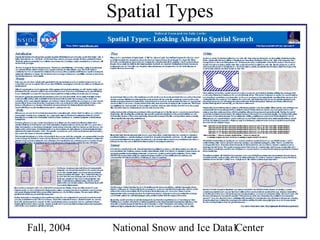
Spatial Types: Looking Ahead to Spatial Search

It is not enough to collect the data and produce data products. In order to be useful the data has to be used. To facilitate data use eventually a search interface has to be developed, probably many. And those interfaces can only be as good as the metadata they have to work with. HDF is not so much a data format as a file format that packages the data with the metadata, so facilitating data access by providing adequate and appropriate metadata starts with data production. In many areas this is not much of a challenge. The temporal coverage of the granules is generally well known, channel and derived parameter names are generally just a matter of convention, etc. But spatial coverage can vary quite a bit, especially for remotely sensed data, and can often be problematic. This paper goes through the five most common spatial types (point, grid, tile, scene, and swath) discusses the problems associated with each, and makes some recommendations for the metadata that needs to be included with the data to facilitate fast, efficient, accurate search when the time comes.

Recomendados
Más contenido relacionado
Más de The HDF-EOS Tools and Information Center
Más de The HDF-EOS Tools and Information Center (20)
Último
Último (20)
Spatial Types: Looking Ahead to Spatial Search
- 1. Spatial Types Fall, 2004 National Snow and Ice Data1 Center
- 2. Point Data Fall, 2004 National Snow and Ice Data2 Center
- 3. Sparse Point Data Fall, 2004 National Snow and Ice Data3 Center
- 4. Dense Point Data Fall, 2004 National Snow and Ice Data4 Center
- 5. Gridded Data Fall, 2004 National Snow and Ice Data5 Center
- 6. MODIS CMG - Coverage Fall, 2004 National Snow and Ice Data6 Center
- 7. SSM/I Ease-grid Fall, 2004 National Snow and Ice Data7 Center
- 8. SSM/I EASE Grid - Coverage Fall, 2004 National Snow and Ice Data8 Center
- 9. Polar Stereo (Sea Ice) Fall, 2004 National Snow and Ice Data9 Center
- 10. Polar Stereo (Sea Ice) - Coverage Fall, 2004 National Snow and Ice Data10 Center
- 11. Polar Stereo (Sea Ice) - Coverage Fall, 2004 National Snow and Ice Data11 Center
- 12. Polar Stereo (Sea Ice) - Coverage Fall, 2004 National Snow and Ice Data12 Center
- 13. Polar Stereo (Sea Ice) - Coverage Fall, 2004 National Snow and Ice Data13 Center
- 14. Polar Stereo (Sea Ice) - Coverage Fall, 2004 National Snow and Ice Data14 Center
- 15. Polar Stereo (Sea Ice) - Coverage Fall, 2004 National Snow and Ice Data15 Center
- 16. Tiles Fall, 2004 National Snow and Ice Data16 Center
- 17. 05v08h Coverage Fall, 2004 National Snow and Ice Data17 Center
- 18. 05v08h w/ lat/lon bounding box Fall, 2004 National Snow and Ice Data18 Center
- 19. 05v08h Spherical Fall, 2004 National Snow and Ice Data19 Center
- 20. AVHRR L1b (Scene) Fall, 2004 National Snow and Ice Data20 Center
- 21. AVHRR L1b (Scene) - Coverage Fall, 2004 National Snow and Ice Data21 Center
- 22. AVHRR L1b (Scene) - Coverage Fall, 2004 National Snow and Ice Data22 Center
- 23. AVHRR L1b (Scene) - Coverage Fall, 2004 National Snow and Ice Data23 Center
- 24. AVHRR L1b (Scene) - Coverage Fall, 2004 National Snow and Ice Data24 Center
- 25. AVHRR L1b (Scene) - Coverage Fall, 2004 National Snow and Ice Data25 Center
- 26. Weird Shape Fall, 2004 National Snow and Ice Data26 Center
- 27. Full Orbit - Coverage Fall, 2004 National Snow and Ice Data27 Center
- 28. Full Orbit - LLBox Fall, 2004 National Snow and Ice Data28 Center
- 29. Full Orbit – Lat/lon Blocks Fall, 2004 National Snow and Ice Data29 Center
- 30. Full Orbit – Spherical Blocks Fall, 2004 National Snow and Ice Data30 Center
- 31. Full Orbit - Coverage Fall, 2004 National Snow and Ice Data31 Center
- 32. Full Orbit - Coverage Fall, 2004 National Snow and Ice Data32 Center
- 33. Full Orbit – Using Backtrack Fall, 2004 National Snow and Ice Data33 Center
- 34. Summary Point Data: use points or multi-points. Grids: Use a lat/lon bounding box if appropriate, otherwise use a spherical n-gon. Accuracy is more important than speed. Tiled Data: A form of regional grid, use a lookup table. Scenes: Use a spherical quadrilateral, maybe up to a spherical decagon for larger scenes. Speed is more important than accuracy. Orbits: The best way to define the coverage of an orbit is to define the orbit. The best way to search for orbital data is to search orbits. Use Backtrack. Fall, 2004 National Snow and Ice Data34 Center
Notas del editor
- Here’s the poster. As you can see there’s a lot of words. There’s even more words on the web site, so if you don’t want to read all the words drop by and I’ll give you web site address. The main point is up here, in the upper left, and it’s this: Historically a lat/lon bounding box was pretty much the best you could do. Nowadays we have more options. Sometimes a lat/lon bounding box is still the best option. Usually not. So we need to seriously reconsider how we define the spatial coverage of the different data types
- Point data – pretty boring.
- Global grids, not much of challenge there.
- Global coverage. Just a keyword will suffice
- Hemispheric grids, also not very challenging.
- A lat/lon bounding box at the collection, or catalog, level works fine.
- Things start to get tricky when the grid is regional. I’ve got a polar example here, but non-polar regional grids have been known to exist.
- Here’s the coverage outlined in the larger context of the projection.
- An this is what that coverage looks like on a flat earth.
- So that’s not a good match for a lat/lon bounding box.
- As we can see more clearly back in the original projection.
- It’s better if we use a spherical polygon connecting the corner points, but still not great. And with Gridded data accuracy is more important than speed. If you don’t know why drop by the poster and I’ll tell you.
- So I recommend a spherical 20-gon, or a 50-gon or …
- When a grid gets too large to fit in a single file it gets tiled. Tiled data is essentially a set of regional grids, and we still want to do spatial search at the collection level. There aren’t very many of them so a lookup table is probably a good method. We’re going to take a look at 05v08h.
- Here’s tile 05v08h
- Not a good fit to a lat/lon bounding box
- Here’s that tile on a round Earth, still not a nice region to work with. Accuracy is still more important than speed, but not so much. So don’t go nutzo on the points – but a set of spherical polygons in a lookup table at the collection level is your best bet
- Scene data is similar, but the coverage isn’t consistent so we have to be a bit more miserly with the search method. Now we’re in the realm where spatial search is at the granule, or inventory, level.
- Again the coverage is not a good fit to a flat Earth.
- A lat/lon bounding box covers a lot of empty space.
- Which is equally evident on a round Earth.
- But if we look at the scene itself, the coverage area isn’t a lat/lon bounding box – but it is almost a spherical rectangle.
- So we can use that same trick and connect the corners with great circle arcs to create a spherical quadralateral. Maybe a few more points, but speed is more important than accuracy. If you don’t know why drop by the poster and I’ll tell you.
- Orbit data is really hard caause it has this weird shape.
- This is a full orbit on a Flat Earth. And it is a weird shape.
- The coverage of a lat/lon bounding box isn’t very helpful, you might as well not even do spatial search.
- So people have gotten creative. They don’t know how to define the coverage of an orbit, but they know how to define the coverage of a partial orbit, so they start building up these blocks. After all an orbit is just an aggregate of partial orbits, so that makes sense. These are lat/lon blocks. One quickly realizes they aren’t terribly accurate, so maybe blocks made out of spherical polygons would be better.
- Using spherical polygons for the blocks is more accurate. And this is actually a pretty clever system – but it’s a database solution to geometric problem. It serves the purpose, but it’s an awful lot of effort. This method is known as NOSE – Nominal Orbit Spatial Extent. They create nominal orbits,usually 360 of them, then they chop them up into these blocks, usually 36 blocks per orbit. That’s nearly 13,000 (12960) blocks.Then when you run the spatial search you search on these blocks it find the blocks that intersect the area of interest. Then you find out what nominal orbit the intersecting blocks are part of. Then you search the data for orbits tagged as matching that nominal orbit. Creation of the blocks is labor intensive. GLAS uses this system, and we conservatively estimate it cost about $30,000 to get the system ready. But then there was trouble with the instrument and they had to redo a lot of it. That was probably another $20,000. And what they did for GLAS can’t be used for AMSR, or MISR, or … it has to be redone for every instrument. It’s a lot of work, and a lot of cost.
- And all that is deemed necessary because orbits have this “weird shape”. Indeed one wonders why NASA would waste the fuel to change the direction of the satellite like this. But what should be obvious by now is the orbit isn’t a weird shape – the planet is.
- On a round Earth orbits have this very ordinary, very predictable, very banal shape. In fact the only complicating factor is that pesky rotation thing. If the Earth didn’t rotate this would just be a ribbon around a sphere. So at NSIDC we’ve taken advantage of the ordinariness and predictability of orbital data.
- What we do at NSIDC is we define the coverage of an orbit by defining the orbit. And we search for orbital data by searching on orbits. That’s what backtrack is. It’s a geometric solution to a geometric problem. And as it turns out it’s more accurate, more efficient, faster, and cheaper than the other solutions.
- And that’s it. I brought some round Earths for everyone. These are really cool because if you unwrap it carefully you can lay it out flat – and then you have a Flat Earth suitable for framing. Any questions?