
Recomendados
Más contenido relacionado
La actualidad más candente
Similar a Financial statement analysis project
Similar a Financial statement analysis project (20)
Último
Último (20)
Financial statement analysis project
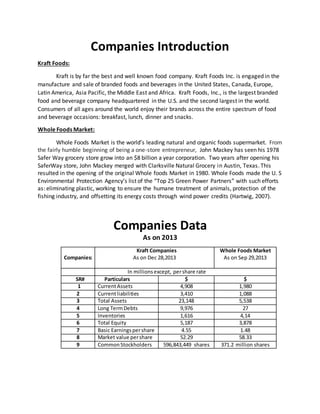
- 1. Companies Introduction Kraft Foods: Kraft is by far the best and well known food company. Kraft Foods Inc. is engaged in the manufacture and sale of branded foods and beverages in the United States, Canada, Europe, Latin America, Asia Pacific, the Middle East and Africa. Kraft Foods, Inc., is the largest branded food and beverage company headquartered in the U.S. and the second largest in the world. Consumers of all ages around the world enjoy their brands across the entire spectrum of food and beverage occasions: breakfast, lunch, dinner and snacks. Whole Foods Market: Whole Foods Market is the world’s leading natural and organic foods supermarket. From the fairly humble beginning of being a one-store entrepreneur, John Mackey has seen his 1978 Safer Way grocery store grow into an $8 billion a year corporation. Two years after opening his SaferWay store, John Mackey merged with Clarksville Natural Grocery in Austin, Texas. This resulted in the opening of the original Whole foods Market in 1980. Whole Foods made the U. S Environmental Protection Agency’s list of the “Top 25 Green Power Partners” with such efforts as: eliminating plastic, working to ensure the humane treatment of animals, protection of the fishing industry, and offsetting its energy costs through wind power credits (Hartwig, 2007). Companies Data As on 2013 Companies: Kraft Companies As on Dec 28,2013 Whole Foods Market As on Sep 29,2013 In millionsexcept, pershare rate SR# Particulars $ $ 1 CurrentAssets 4,908 1,980 2 Currentliabilities 3,410 1,088 3 Total Assets 23,148 5,538 4 Long TermDebts 9,976 27 5 Inventories 1,616 4,14 6 Total Equity 5,187 3,878 7 Basic Earningspershare 4.55 1.48 8 Market value pershare 52.29 58.33 9 CommonStockholders 596,843,449 shares 371.2 million shares
- 2. Ratio Analysis 1. Price EarningsRatio: A valuationratioof a company’scurrentshare price compared toits pershare earnings. Price earnings ratiomeasuresthe amountthatinvestorsare willingtopayforeach dollar of a firm’searningsthe higherthe profitearnings(P/E) ratio,the greaterthe investorconfidence. The price/ earningsratioiscommonlyusedtoassessthe owners’appraisal of share value. Price earningsratioshowsthe multipleof earningsatwhicha stocksells. Formula: P/E ratio = Market value per share ÷ Earning per share CompaniesAnalysis Kraft Foods Whole FoodsMarket P/E RATIO= $52.29/$4.55 = $11.49 P/E RATIO= $58.33/$1.48 = $39.41 2. Debt to EquityRatio: A measure of a company’sfinancial leverage calculatedbydividingitstotal liabilitiesby stockholders’ equity.Itindicateswhatproportionof equityanddebtthe companyisusingto finance itsassets. The debttoequityratio isa measure of the relationshipbetweenthe capital contributedby the creditors andthe capital contributedby shareholders.Italsoshowsthe extenttowhichshareholders’equitycanfulfill acompany’sobligationstocreditorsinthe event of a liquidation. Formula: Debt to Equity Ratio= Total long term debt ÷ Total Equity Companies Analysis Kraft Foods Whole FoodsMarket Debtto EquityRatio= $9976/$5187 = $1.92 *100 = 192% Debtto EquityRatio= $2700/$3878 = $69.62*100 = 70% 3. Current Ratio: The current ratio,one of the mostcommonlycitedfinancial ratios,measure the firm’s abilitytomeetitsshort termobligations. A measure of liquiditycalculatedbydividingthe firm’s currentassetsby itscurrent liabilities.A highercurrentratioindicatesagreaterdegree of liquidity. The currentratiocan give a sense of the efficiencyof acompany’soperatingcycle its abilityitturnitsproduct intocash. Formula: Current Ratio= Current assets ÷ Currentliabilities
- 3. Companies Analysis Kraft Foods Whole FoodsMarket CurrentRatio= $4908/$3410 = 1.4: 1 CurrentRatio= $1980/$1088 = 1.8: 1 4. Quick Ratio: The quick (acid-test) ratio is similar to the current ratio except that it excludes inventory, which is generally the least liquid current asset. A measure of liquidity calculated by dividing the firm’s current assets minus inventory by its current liabilities. An indicator of a company’s short term liquidity. The quick ratio measures a company’s ability to meet its short term obligations with its most liquid assets. Formula: Quick Ratio= Current assets – Inventory Current liabilities Companies Analysis Kraft Foods Whole FoodsMarket Quick Ratio= $4908 - $1616 $3410 = 0.96: 1 Quick Ratio= $1980 - $414 $ 1088 = 104: 1 5. EPS(Earning Per Share): The portion of a company’s profit allocated to each outstanding share of common stock. The firm’s earnings per share (EPS) is generally of interest to present or prospective stockholders and management. EPS (earning per share) represents the number of dollars earned during the period on behalf of each outstanding share of common stock. Earnings per share serves as an indicator of a company’s profitability. Formula: EPS (Earning per Share) = Net Income – Dividends on preferred stock Average outstanding shares Or EPS (Earning per Share) = Earnings available for common stockholders ÷ Number of shares of common stock Outstanding Companies Analysis Kraft Foods Whole FoodsMarket EPS (Earning per Share)=$2,715,000,000/596,843,449 =$4.55 EPS (Earning per Share)= $551/371.2 = $ 1.48
- 4. Comparison of Attributes In the eyes of all above discussed calculations and values, Whole Foods Market proves its financial condition strong than Kraft Foods Ltd. Although at some points Kraft Foods shows stable and productive values but as a whole view, its overall functionality proves not as stable and productive as Whole Foods Market. Given below statistics proves it: Ratios Kraft Foods Ltd. Whole Foods Market Inc. Price earnings ratio $ 11.49 $39.4 Debt to equity ratio 192% 70% Current Ratio 1.4:1 1.8:1 Quick Ratio 0.9:1 1.4:1 Earning per share $4.55 $1.48 The price earningsratio,whicheveryinvestorattentivelynotice inordertomake decisionto make investmentornot,is higherinWhole Foodsmarket,soitisclear bycomparingthat Kraft FoodsLtd needtowork outfor the growth of itsearnings. Price earningsratioof Whole Foods Market is $39.4 Debtto equityratio consideredperfect whenitshowsthe resultof 50% fromapplyingthe debt to equityformulaon company’s values.KraftFoodslimitedresultsshowing192% debtsto equityandincomparisonof it Whole FoodsMarketonlyresponsible for70% debtsto equity. Currentratioreflectsaboutthe balancingof currentassetsand liabilities. WholeFoodsMarket provesmore liquiditytoliabilitiesasitgot 1.8:1 comparedto 1.4:1. ConferringtoquickratioanalysisWhole FoodsMarketshowsmore liquidityascompare toKraft Foods.KraftFoodspossesslowerliquiditypowertomeetfunctionsof liquiditynature in company because the analysisshowsthe resultsof 0.9:1 whichclearlydescribesthatquickratio resultislow.QuickratioanalysisisstronginWhole FoodsMarket,whichis 1.4:1. Earningper share analysisshowsthatKraftFoodscan earn more as pershare,as comparedto Whole FoodsMarket.Whichis a good signforKraft Foodsinsense of profitabilityand development.SoKraftFoods’stockholdersearningmore profitfromthe Whole FoodsMarkets’ stockholders.InEPSratiothe whole Earningsavailableforstockholdersdividedintoall outstandingshareholdersandgivesthe pershare earningview,whichisstronginKraftFoods. Conclusion Ratio analysis of both companies clears that Whole Foods Market is strong in earning per price, debts payments, liquidity and in quick ratio analysis except earnings per share which is $1.48 as compared to $4.55. But as a whole, on the basis of all five ratios which describes about both companies debt payment power on the basis of equity, earnings ,assets compared to liabilities, quick ratio to meet daily payments, whole Foods Market looks more stable in four of all discussed.