SlideShare una empresa de Scribd logo
1 de 50
Introduction:

Hasnain baber ©

We know that planning about future is very necessary for the
every business firm, every govt. institute, every individual and for
every country. Every family is also doing planning for his income
expenditure. As like every business is doing planning for
possibilities of its financial resources & sales and for maximization
its profit.

Definition:

“A time series is a set of observation taken at

specified times, usually at equal intervals”.
“A time series may be defined as a collection of reading belonging to
different time periods of some economic or composite variables”.

By –Ya-Lun-Chau
 Time series establish relation between “cause” & “Effects”.
 One variable is “Time” which is independent variable & and the
second is “Data” which is the dependent variable.
A time series is……
 A set of data depending on the time
 A series of values over a period of time
 Collection of magnitudes belonging to different
time periods of some variable or composite of
variables such as production of steel, per capita
income, gross national income, price of
tobacco, index of industrial production.
• Time is act as a device to set of common stable
reference point.
• In time series, time act as an independent variable
to estimate dependent variables
We explain it from the following example:
Day

No. of Packets of milk sold

Year

Population (in Million)

Monday

90

1921

251

Tuesday

88

1931

279

Wednesday

85

1941

319

Thursday

75

1951

361

Friday

72

1961

439

Saturday

90

1971

548

Sunday

102

1981

685

• From example 1 it is clear that the sale of milk packets is decrease
from Monday to Friday then again its start to increase.
• Same thing in example 2 the population is continuously increase.
CAUSES OF VARIATIONS IN
TIME SERIES DATA
• Social customs, festivals etc.
• Seasons
• The four phase of business : prosperity,
decline, depression, recovery
• Natural calamities: earthquake, epidemic,
flood, drought etc.
• Political movements/changes, war etc.
Importance of Time Series Analysis:-

As the basis of Time series Analysis businessman can predict abou
the changes in economy. There are following points which clear
about the its importance:
1. Profit of experience.
2. Safety from future
3. Utility Studies
4. Sales Forecasting
5. Budgetary Analysis
6. Stock Market Analysis
7. Yield Projections
8. Process and Quality Control
9. Inventory Studies
10. Economic Forecasting
11. Risk Analysis & Evaluation of changes.
12. Census Analysis
Components of Time Series:1.
2.
3.
4.

• Secular Trend or Trend
• Seasonal Variations/Fluctuations
• Cyclical Variations/Fluctuations
• Irregular Variations/Movements
SECULAR TREND OR TREND
• The general tendency of the data to grow or decline
over a long period of time.
• The forces which are constant over a long period (or
even if they vary they do so very gradually) produce
the trend. For e.g., population change, technological
progress, improvement in business organization,
better medical facility etc.
• E.g., Formation of rocks
• Downward trend-declining death rate
• Upward trend-population growth
• Mathematically trend may be Linear or non-

linear
For example,
Population increases over a period of time,price increases over a period
of years,production of goods on the capital market of the country
increases over a period of years.These are the examples of upward trend.
The sales of a commodity may decrease over a period of time because of
better products coming to the market.This is an example of declining
trend or downward.

PURPOSE OF
MEASURING
TREND
Knowledge of
past behavior

Estimation

Study of other
components
SEASONAL
VARIATIONS/FLUCTUATIONS
• The component responsible for the regular rise
or fall (fluctuations) in the time series during a
period not more than 1 year.
• Fluctuations occur in regular sequence
(periodical)
• The period being a year, a month, a week, a
day, or even a fraction of the day, an hour etc.
• Term “SEASONAL” is meant to include any kind of
variation which is of periodic nature and whose repeating
cycles are of relatively short duration.
• The factors that cause seasonal variations are: (a)
Climate & weather condition, (b) Customs traditions &
habits
CHACTERISTICS/FEATURES
OF SEASONAL VARIATIONS
•
•
•
•

Regularity
Fixed proportion
Increase or Decrease
Easy fore cast
PURPOSE OF MEASURING
SEASONAL VARIATIONS
• Analysis of past behavior of the
series
• Forecasting the short time
fluctuations
• Elimination of the seasonal variations
for measuring cyclic variations
EXAMPLES OF SEASONAL
VARIATIONS
• Crops are sown and harvested at certain
times every year and the demand for the
labour gowing up during sowing and
harvesting seasons.
• Demands for wollen clothes goes up in
winter
• Price increases during festivals
• Withdraws from banks are heavy during first
week of the month.
• The number of letter posted on Saturday is
larger.
CYCLIC VARIATIONS
• Cycle refers to recurrent variations in
time series
• Cyclical variations usually last longer
than a year
• Cyclic fluctuations/variations are long
term movements that represent
consistently recurring rises and
declines in activity.
BUSINESS CYCLE
Consists of 4 phases: prosperity, decline, depressions,
recovery
A business cycle showing these oscillatory movements has to
pass through four phases-prosperity, recession, depression
and recovery. In a business, these four phases are
completed by passing one to another in this order.
•
purpose
• Measures of past cyclical behavior
• Forecasting
• Useful in formulating policies in
business
IRREGULAR VARIATIONS
• Also called erratic, random, or
“accidental” variations
• Do not repeat in a definite pattern
• Strikes, fire, wars, famines, floods,
earthquakes
• unpredictable
CHARACTERISTICS
•
•
•
•

Irregular & unpredictable
No definite pattern
Short period of time
No Statistical technique
Measurement of Secular trend:• The following methods are used for calculation
of trend:






Free Hand Curve Method:
Semi – Average Method:
Moving Average Method:
Least Square Method:
e hand Curve Method:• In this method the data is denoted on graph paper. We
take “Time” on ‘x’ axis and “Data” on the ‘y’ axis. On
graph there will be a point for every point of time. We
make a smooth hand curve with the help of this plotted
points.

Example:
Draw a free hand curve on the basis of the
following data:
Years

1989

1990

1991

1992

1993

1994

1995

1996

Profit
(in
‘000)

148

149

149.5

149

150.5

152.2

153.7

153
155
154
153

Trend Line

152
151

150

Profit ('000)

149

Actual Data

148
147
146

145
1989

1990

1991

1992

1993

1994

1995

1996
mi – Average Method:• In this method the given data are divided in two parts,
preferable with the equal number of years.
• For example, if we are given data from 1991 to 2008,
i.e., over a period of 18 years, the two equal parts will be
first nine years, i.e.,1991 to 1999 and from 2000 to
2008. In case of odd number of years like, 9, 13, 17,
etc.., two equal parts can be made simply by ignoring
the middle year. For example, if data are given for 19
years from 1990 to 2007 the two equal parts would be
from 1990 to 1998 and from 2000 to 2008 - the middle
year 1999 will be ignored.
• Example:
Find the trend line from the
following data by Semi – Average Method:Year

1989

Production 150
(M.Ton.)

1990

1991

1992

1993

1994

1995

1996

152

153

151

154

153

156

158

There are total 8 trends. Now we distributed it in equal part.
Now we calculated Average mean for every part.
First Part =

150 + 152 + 153 + 151
4

= 151.50

Second Part =

154 + 153 + 156 + 158 = 155.25
4
Year
(1)

Production
(2)

1989

150

1990

Arithmetic Mean
(3)

152
151.50

1991

153

1992

151

1993

154

1994

153
155.25

1995

156

1996

158
Production
160
158
156
154

155.25
Production

152
151.50

150
148
146
1989

1990

1991

1992

1993

1994

1995

1996
Moving Average Method:• It is one of the most popular method for calculating Long Term
Trend. This method is also used for ‘Seasonal fluctuation’, ‘cyclical
fluctuation’ & ‘irregular fluctuation’. In this method we calculate
the ‘Moving Average for certain years.
• For example: If we calculating ‘Three year’s Moving Average’ then
according to this method:
=(1)+(2)+(3) , (2)+(3)+(4) , (3)+(4)+(5), ……………..
3
3
3
Where (1),(2),(3),………. are the various years of time series.

Example: Find out the five year’s moving Average:
Year

1982

1983

1984

1985

1986

1987

1988

1989

1990

1991

1992

1993

1994

1995

1996

Price

20

25

33

33

27

35

40

43

35

32

37

48

50

37

45
Year
(1)
1982
1983
1984
1985
1986
1987
1988
1989
1990
1991
1992
1993
1994
1995
1996

Price of
sugar (Rs.)
(2)
20
25
33
30
27
35
40
43
35
32
37
48
50
37
45

Five year’s moving
Total
(3)
135
150
165
175
180
185
187
195
202
204
217
-

Five year’s moving
Average (Col 3/5)
(4)
27
30
33
35
36
27
37.4
39
40.4
40.8
43.4
-
Least Square Method:• This method is most widely in practice. When this method is
applied, a trend line is fitted to data in such a manner that
the following two conditions are satisfied: The sum of deviations of the actual values of y and computed
values of y is zero.

 Y  Y   0
c

 i.e., the sum of the squares of the deviation of the actual and
computed values is least from this line. That is why method is
called the method of least squares. The line obtained by this
method is known as the line of `best fit`.
2
Y  Y  is least



c
The Method of least square can be used either to fit a straight line
trend or a parabolic trend.
The straight line trend is represented by the equation:-

= Yc = a + bx
Where,

Y = Trend value to be computed

X = Unit of time (Independent Variable)
a = Constant to be Calculated
b = Constant to be calculated

Example:Draw a straight line trend and estimate trend value for 1996:
Year
1991
1992
1993
1994
1995
Production

8

9

8

9

16
Solution:Year
(1)

Deviation From
1990
X
(2)

Y
(3)

XY
(4)

X2
(5)

Trend
Yc = a + bx
(6)

1991

1

8

8

1

5.2 + 1.6(1) = 6.8

1992

2

9

18

4

5.2 + 1.6(2) = 8.4

1993

3

8

24

9

5.2 + 1.6(3) = 10.0

1994

4

9

36

16

5.2 + 1.6(4) = 11.6

1995

5

16

80

25

5.2 + 1.6(5) = 13.2

N= 5

X

Y

 XY
=50
= 166

X

2

’
= 15
= 55
Now we calculate the value of two constant ‘a’ and ‘b’ with the help
of two equation:-
 Y  Na  b X
 XY  a X  b X
Now we put the value of

2

X , Y ,  XY ,  X 2 ,&N :

50 = 5a + 15(b) …………….
166 = 15a + 55(b) ………………
Or 5a + 15b = 50 ………………
15a + 55b = 166 ………………….

(i)
(ii)
(iii)
(iv)

Equation (iii) Multiply by 3 and subtracted by (iv)
-10b = -16
b = 1.6
Now we put the value of “b” in the equation (iii)
= 5a + 15(1.6) = 50
5a = 26
26
a = 5 = 5.2
As according the value of ‘a’ and ‘b’ the trend line:Yc = a + bx
Y= 5.2 + 1.6X
Now we calculate the trend line for 1996:Y1996 = 5.2 + 1.6 (6) = 14.8
 Shifting The Trend Origin:• In above Example the trend equation is:

Y = 5.2 + 1.6x
Here the base year is 1993 that means actual base of these
year will 1st July 1993. Now we change the base year in
1991. Now the base year is back 2 years unit than
previous base year.

Now we will reduce the twice of the value of the ‘b’
from the value of ‘a’.
Then the new value of ‘a’ = 5.2 – 2(1.6)
Now the trend equation on the basis of year 1991:

Y = 2.0+ 1.6x
Parabolic Curve:Many times the line which draw by “Least Square Method”
is not prove ‘Line of best fit’ because it is not present
actual long term trend So we distributed Time Series in subpart and make following equation:-

Yc = a + bx + cx2
 If this equation is increase up to second degree then it is
“Parabola of second degree” and if it is increase up to third degree
then it “Parabola of third degree”. There are three constant ‘a’, ‘b’
and ‘c’.
Its are calculated by following three equation:-
Parabola of second degree:Y  Na  b X  c X 2


XY  a X  b X 2  c X 3


X 2Y  a X 2  b X 3  c X 4


If we take the deviation from ‘Mean year’ then the all
three equation are presented like this:
Y  Na  C  X 2

XY  b X 2


X 2Y  a X 2  c X 4 

Example:
Draw a parabola of second degree from the following data:Year

1992

1993

1994

1995

1996

Production (000)

5

7

4

9

10

Year

Production

Dev. From Middle
Year
(x)

xY

x2

x2Y

x3

x4

Trend Value
Y = a + bx + cx2

1992

5

-2

-10

4

20

-8

16

5.7

1993

7

-1

-7

1

7

-1

1

5.6

1994

4

0

0

0

0

0

0

6.3

1995

9

1

9

1

9

1

1

8.0

1996

10

2

20

4

40

8

16

10.5

Y

= 35

X

X Y X X
 XY  X
=12 = 10 = 76 = 0 = 34
2

=0

2

3

4
We take deviation from middle year so the
equations are as below:

 Y  Na   X
 XY  b X
 X Y  a X  c X
2

2

2

2

4



2
3
4
Now we put the value of  X , Y ,  XY ,  X ,  X ,  X ,&N

35 = 5a + 10c
12 = 10b
76 = 10a + 34c

………………………… (i)
…………………………
……………………….. (iii)
12
10

From equation (ii) we get b = = 1.2

(ii)
Equation (ii) is multiply by 2 and subtracted from (iii):
10a + 34c = 76
10a + 20c = 70
14c = 6 or c =

……………..
……………..
6
14

= 0.43

Now we put the value of c in equation (i)
5a + 10 (0.43) = 35
5a = 35-4.3 = 5a = 30.7
a = 6.14
Now after putting the value of ‘a’, ‘b’ and ‘c’, Parabola of second
degree is made that is:

Y = 6.34 + 1.2x + 0.43x2

(iv)
(v)
Parabola of Third degree:• There are four constant ‘a’, ‘b’, ‘c’ and ‘d’ which
are calculated by following equation. The main
equation is Yc = a + bx + cx2 + dx3. There are
also four normal equation.
Y  Na  b X  c X 2  d  X 3


XY  a  X  b X 2  c X 3  d  X 4


X 2Y  a  X 2  b X 3  c X 4  d  X 5

X 3Y  a  X 3  b X 4  c X 5  d  X 6

Seasonal Average Method
• Seasonal Averages = Total of Seasonal Values
No. Of Years
• General Averages = Total of Seasonal Averages
No. Of Seasons
• Seasonal Index
=
Seasonal Average
General Average
EXAMPLE:• From the following data calculate quarterly
seasonal indices assuming the absence of any
type of trend:
Year

I

II

III

IV

1989

-

-

127

134

1990

130

122

122

132

1991

120

120

118

128

1992

126

116

121

130

1993

127

118

-

-
Solution:Calculation of quarterly seasonal indices
Year

I

II

III

IV

1989

-

-

127

134

1990

130

122

122

132

1991

120

120

118

128

1992

126

116

121

130

1993

127

118

-

-

Total

503

476

488

524

Average

125.75

119

122

131

Quarterly
Turnover
seasonal
indices
124.44 = 100

101.05

95.6

98.04

105.03

Total

497.75
• General Average = 497.75 = 124.44
4
Quarterly Seasonal variation index =
125.75 x 100
124.44
So as on we calculate the other seasonal
indices
Link Relative Method:
• In this Method the following steps are taken for
calculating the seasonal variation indices
• We calculate the link relatives of seasonal figures.
Link Relative: Current Season’s Figure x 100
Previous Season’s Figure
• We calculate the average of link relative foe each
season.
• Convert These Averages in to chain relatives on
the basis of the first seasons.
• Calculate the chain relatives of the first season on
the base of the last seasons. There will be some
difference between the chain relatives of the first
seasons and the chain relatives calculated by the
pervious Method.
• This difference will be due to effect of long term
changes.
• For correction the chain relatives of the first
season calculated by 1st method is deducted from
the chain relative calculated by the second
method.
• Then Express the corrected chain relatives as
percentage of their averages.
Ratio To Moving Average Method:
• In this method seasonal variation indices are
calculated in following steps:
• We calculate the 12 monthly or 4 quarterly
moving average.
• We use following formula for calculating the
moving average Ratio:
Moving Average Ratio= Original Data x 100
Moving Average
Then we calculate the seasonal variation indices on
the basis of average of seasonal variation.
Ratio To Trend Method:• This method based on Multiple model of Time
Series. In It We use the following Steps:
• We calculate the trend value for various time
duration (Monthly or Quarterly) with the help of
Least Square method
• Then we express the all original data as the
percentage of trend on the basis of the following
formula.
= Original Data x 100
Trend Value
Rest of Process are as same as moving Average
Method
Methods Of Cyclical Variation:-

Residual Method
References cycle analysis method
Direct Method
Harmonic Analysis Method
Residual Method:• Cyclical variations are calculated by Residual Method . This
method is based on the multiple model of the time Series. The
process is as below:

• (a) When yearly data are given:
In class of yearly data there are not any seasonal variations so
original data are effect by three components:
» Trend Value
» Cyclical
» Irregular

(b) When monthly or quarterly data are given:
First we calculate the seasonal variation indices according to
moving average ratio method.
At last we express the cyclical and irregular variation as the
Trend Ratio & Seasonal variation Indices
Measurement of Irregular Variations
• The irregular components in a time series
represent the residue of fluctuations after trend
cycle and seasonal movements have been
accounted for. Thus if the original data is divided
by T,S and C ; we get I i.e. . In Practice the cycle
itself is so erratic and is so interwoven with
irregular movement that is impossible to
separate them.

Más contenido relacionado

La actualidad más candente

Time series analysis; Statistics for Economics
Time series analysis; Statistics for EconomicsTime series analysis; Statistics for Economics
Time series analysis; Statistics for Economicsjyothi s basavaraju
 
Mba 532 2011_part_3_time_series_analysis
Mba 532 2011_part_3_time_series_analysisMba 532 2011_part_3_time_series_analysis
Mba 532 2011_part_3_time_series_analysisChandra Kodituwakku
 
Forecasting and methods of forecasting
Forecasting and methods of forecastingForecasting and methods of forecasting
Forecasting and methods of forecastingMilind Pelagade
 
Time Series, Moving Average
Time Series, Moving AverageTime Series, Moving Average
Time Series, Moving AverageSOMASUNDARAM T
 
Moving average method maths ppt
Moving average method maths pptMoving average method maths ppt
Moving average method maths pptAbhishek Mahto
 
Time Series Analysis, Components and Application in Forecasting
Time Series Analysis, Components and Application in ForecastingTime Series Analysis, Components and Application in Forecasting
Time Series Analysis, Components and Application in ForecastingSundar B N
 
Lesson 2 stationary_time_series
Lesson 2 stationary_time_seriesLesson 2 stationary_time_series
Lesson 2 stationary_time_seriesankit_ppt
 
Auto Correlation Presentation
Auto Correlation PresentationAuto Correlation Presentation
Auto Correlation PresentationIrfan Hussain
 
Autocorrelation- Concept, Causes and Consequences
Autocorrelation- Concept, Causes and ConsequencesAutocorrelation- Concept, Causes and Consequences
Autocorrelation- Concept, Causes and ConsequencesShilpa Chaudhary
 
Business forecasting and timeseries analysis phpapp02
Business forecasting and timeseries analysis phpapp02Business forecasting and timeseries analysis phpapp02
Business forecasting and timeseries analysis phpapp02MD ASADUZZAMAN
 
Trend analysis and time Series Analysis
Trend analysis and time Series Analysis Trend analysis and time Series Analysis
Trend analysis and time Series Analysis Amna Kouser
 
Multicolinearity
MulticolinearityMulticolinearity
MulticolinearityPawan Kawan
 
Ratio to moving average method
Ratio to moving average methodRatio to moving average method
Ratio to moving average methodPandidurai P
 

La actualidad más candente (20)

Time series analysis; Statistics for Economics
Time series analysis; Statistics for EconomicsTime series analysis; Statistics for Economics
Time series analysis; Statistics for Economics
 
Mba 532 2011_part_3_time_series_analysis
Mba 532 2011_part_3_time_series_analysisMba 532 2011_part_3_time_series_analysis
Mba 532 2011_part_3_time_series_analysis
 
Forecasting and methods of forecasting
Forecasting and methods of forecastingForecasting and methods of forecasting
Forecasting and methods of forecasting
 
Time Series, Moving Average
Time Series, Moving AverageTime Series, Moving Average
Time Series, Moving Average
 
Time series.ppt
Time series.pptTime series.ppt
Time series.ppt
 
Moving average method maths ppt
Moving average method maths pptMoving average method maths ppt
Moving average method maths ppt
 
Index number
Index numberIndex number
Index number
 
Time Series Analysis, Components and Application in Forecasting
Time Series Analysis, Components and Application in ForecastingTime Series Analysis, Components and Application in Forecasting
Time Series Analysis, Components and Application in Forecasting
 
Lesson 2 stationary_time_series
Lesson 2 stationary_time_seriesLesson 2 stationary_time_series
Lesson 2 stationary_time_series
 
1634 time series and trend analysis
1634 time series and trend analysis1634 time series and trend analysis
1634 time series and trend analysis
 
Auto Correlation Presentation
Auto Correlation PresentationAuto Correlation Presentation
Auto Correlation Presentation
 
Autocorrelation- Concept, Causes and Consequences
Autocorrelation- Concept, Causes and ConsequencesAutocorrelation- Concept, Causes and Consequences
Autocorrelation- Concept, Causes and Consequences
 
Business forecasting and timeseries analysis phpapp02
Business forecasting and timeseries analysis phpapp02Business forecasting and timeseries analysis phpapp02
Business forecasting and timeseries analysis phpapp02
 
Introduction to Econometrics
Introduction to EconometricsIntroduction to Econometrics
Introduction to Econometrics
 
Time series
Time seriesTime series
Time series
 
Trend analysis and time Series Analysis
Trend analysis and time Series Analysis Trend analysis and time Series Analysis
Trend analysis and time Series Analysis
 
Sampling design ppt
Sampling design pptSampling design ppt
Sampling design ppt
 
Index Number
Index Number Index Number
Index Number
 
Multicolinearity
MulticolinearityMulticolinearity
Multicolinearity
 
Ratio to moving average method
Ratio to moving average methodRatio to moving average method
Ratio to moving average method
 

Destacado

Destacado (7)

Time series Forecasting
Time series ForecastingTime series Forecasting
Time series Forecasting
 
Time Series Analysis Ravi
Time Series Analysis RaviTime Series Analysis Ravi
Time Series Analysis Ravi
 
Analysis of time series
Analysis of time seriesAnalysis of time series
Analysis of time series
 
Time series
Time seriesTime series
Time series
 
Time Series Analysis: Theory and Practice
Time Series Analysis: Theory and PracticeTime Series Analysis: Theory and Practice
Time Series Analysis: Theory and Practice
 
Time Series Analysis
Time Series AnalysisTime Series Analysis
Time Series Analysis
 
Timeseries forecasting
Timeseries forecastingTimeseries forecasting
Timeseries forecasting
 

Similar a Time series

Applied Statistics Chapter 2 Time series (1).ppt
Applied Statistics Chapter 2 Time series (1).pptApplied Statistics Chapter 2 Time series (1).ppt
Applied Statistics Chapter 2 Time series (1).pptswamyvivekp
 
timeseries-100127010913-phpapp02.pptx
timeseries-100127010913-phpapp02.pptxtimeseries-100127010913-phpapp02.pptx
timeseries-100127010913-phpapp02.pptxHarshitSingh334328
 
What Are Data Trends and Patterns, and How Do They Impact Business Decisions?
What Are Data Trends and Patterns, and How Do They Impact Business Decisions?What Are Data Trends and Patterns, and How Do They Impact Business Decisions?
What Are Data Trends and Patterns, and How Do They Impact Business Decisions?Smarten Augmented Analytics
 
time series.pdf
time series.pdftime series.pdf
time series.pdfcollege
 
Module 3 - Time Series.pptx
Module 3 - Time Series.pptxModule 3 - Time Series.pptx
Module 3 - Time Series.pptxnikshaikh786
 
Time Series Analysis.pptx
Time Series Analysis.pptxTime Series Analysis.pptx
Time Series Analysis.pptxSunny429247
 
Enterprise_Planning_TimeSeries_And_Components
Enterprise_Planning_TimeSeries_And_ComponentsEnterprise_Planning_TimeSeries_And_Components
Enterprise_Planning_TimeSeries_And_Componentsnanfei
 
Time Series Analysis (Business Statistics Tutorial )
Time Series Analysis (Business Statistics Tutorial )Time Series Analysis (Business Statistics Tutorial )
Time Series Analysis (Business Statistics Tutorial )Mahmudul Hasan Nakib
 
Trend analysis - Lecture Notes
Trend analysis - Lecture NotesTrend analysis - Lecture Notes
Trend analysis - Lecture NotesDr. Nirav Vyas
 
Demand Forecasting.pptx
Demand Forecasting.pptxDemand Forecasting.pptx
Demand Forecasting.pptxkarthigeyanl
 

Similar a Time series (20)

Applied Statistics Chapter 2 Time series (1).ppt
Applied Statistics Chapter 2 Time series (1).pptApplied Statistics Chapter 2 Time series (1).ppt
Applied Statistics Chapter 2 Time series (1).ppt
 
timeseries-100127010913-phpapp02.pptx
timeseries-100127010913-phpapp02.pptxtimeseries-100127010913-phpapp02.pptx
timeseries-100127010913-phpapp02.pptx
 
What Are Data Trends and Patterns, and How Do They Impact Business Decisions?
What Are Data Trends and Patterns, and How Do They Impact Business Decisions?What Are Data Trends and Patterns, and How Do They Impact Business Decisions?
What Are Data Trends and Patterns, and How Do They Impact Business Decisions?
 
TIME SERIES
TIME SERIESTIME SERIES
TIME SERIES
 
time series.pdf
time series.pdftime series.pdf
time series.pdf
 
Forecasting Methods
Forecasting MethodsForecasting Methods
Forecasting Methods
 
analysix.ppt
analysix.pptanalysix.ppt
analysix.ppt
 
Module 3 - Time Series.pptx
Module 3 - Time Series.pptxModule 3 - Time Series.pptx
Module 3 - Time Series.pptx
 
Time Series Analysis.pptx
Time Series Analysis.pptxTime Series Analysis.pptx
Time Series Analysis.pptx
 
Time series
Time series Time series
Time series
 
Enterprise_Planning_TimeSeries_And_Components
Enterprise_Planning_TimeSeries_And_ComponentsEnterprise_Planning_TimeSeries_And_Components
Enterprise_Planning_TimeSeries_And_Components
 
Time Series Analysis (Business Statistics Tutorial )
Time Series Analysis (Business Statistics Tutorial )Time Series Analysis (Business Statistics Tutorial )
Time Series Analysis (Business Statistics Tutorial )
 
Time series
Time seriesTime series
Time series
 
Seasonality
SeasonalitySeasonality
Seasonality
 
Trend analysis - Lecture Notes
Trend analysis - Lecture NotesTrend analysis - Lecture Notes
Trend analysis - Lecture Notes
 
8134485.ppt
8134485.ppt8134485.ppt
8134485.ppt
 
Trend analysis fo business
Trend analysis fo businessTrend analysis fo business
Trend analysis fo business
 
timeseries.ppt
timeseries.ppttimeseries.ppt
timeseries.ppt
 
Time series analysis
Time series analysisTime series analysis
Time series analysis
 
Demand Forecasting.pptx
Demand Forecasting.pptxDemand Forecasting.pptx
Demand Forecasting.pptx
 

Más de Hasnain Baber

Más de Hasnain Baber (20)

Cultural differences india travel_guide
Cultural differences india travel_guideCultural differences india travel_guide
Cultural differences india travel_guide
 
The eoq model
The eoq modelThe eoq model
The eoq model
 
Why oil prices failing
Why oil prices failingWhy oil prices failing
Why oil prices failing
 
Zimbabwe's inflation
Zimbabwe's inflationZimbabwe's inflation
Zimbabwe's inflation
 
Data analysis
Data analysisData analysis
Data analysis
 
Measure of dispersion
Measure of dispersionMeasure of dispersion
Measure of dispersion
 
India at a glance (economy)
India at a glance (economy)India at a glance (economy)
India at a glance (economy)
 
Index number
Index numberIndex number
Index number
 
Consumer price index number
Consumer price index numberConsumer price index number
Consumer price index number
 
Material handling
Material handlingMaterial handling
Material handling
 
Plant layout
Plant layoutPlant layout
Plant layout
 
Material handling
Material handlingMaterial handling
Material handling
 
Quasi contracts
Quasi contractsQuasi contracts
Quasi contracts
 
Web advertsisng
Web advertsisngWeb advertsisng
Web advertsisng
 
Sales compensation
Sales compensationSales compensation
Sales compensation
 
Non verbal communication
Non verbal communicationNon verbal communication
Non verbal communication
 
MIS
MISMIS
MIS
 
Govt intervention in economy
Govt intervention in economyGovt intervention in economy
Govt intervention in economy
 
Facility management companies
Facility management companiesFacility management companies
Facility management companies
 
Bond markets
Bond marketsBond markets
Bond markets
 

Último

Disha NEET Physics Guide for classes 11 and 12.pdf
Disha NEET Physics Guide for classes 11 and 12.pdfDisha NEET Physics Guide for classes 11 and 12.pdf
Disha NEET Physics Guide for classes 11 and 12.pdfchloefrazer622
 
Measures of Central Tendency: Mean, Median and Mode
Measures of Central Tendency: Mean, Median and ModeMeasures of Central Tendency: Mean, Median and Mode
Measures of Central Tendency: Mean, Median and ModeThiyagu K
 
BASLIQ CURRENT LOOKBOOK LOOKBOOK(1) (1).pdf
BASLIQ CURRENT LOOKBOOK  LOOKBOOK(1) (1).pdfBASLIQ CURRENT LOOKBOOK  LOOKBOOK(1) (1).pdf
BASLIQ CURRENT LOOKBOOK LOOKBOOK(1) (1).pdfSoniaTolstoy
 
BAG TECHNIQUE Bag technique-a tool making use of public health bag through wh...
BAG TECHNIQUE Bag technique-a tool making use of public health bag through wh...BAG TECHNIQUE Bag technique-a tool making use of public health bag through wh...
BAG TECHNIQUE Bag technique-a tool making use of public health bag through wh...Sapna Thakur
 
Advanced Views - Calendar View in Odoo 17
Advanced Views - Calendar View in Odoo 17Advanced Views - Calendar View in Odoo 17
Advanced Views - Calendar View in Odoo 17Celine George
 
Software Engineering Methodologies (overview)
Software Engineering Methodologies (overview)Software Engineering Methodologies (overview)
Software Engineering Methodologies (overview)eniolaolutunde
 
Q4-W6-Restating Informational Text Grade 3
Q4-W6-Restating Informational Text Grade 3Q4-W6-Restating Informational Text Grade 3
Q4-W6-Restating Informational Text Grade 3JemimahLaneBuaron
 
Organic Name Reactions for the students and aspirants of Chemistry12th.pptx
Organic Name Reactions  for the students and aspirants of Chemistry12th.pptxOrganic Name Reactions  for the students and aspirants of Chemistry12th.pptx
Organic Name Reactions for the students and aspirants of Chemistry12th.pptxVS Mahajan Coaching Centre
 
A Critique of the Proposed National Education Policy Reform
A Critique of the Proposed National Education Policy ReformA Critique of the Proposed National Education Policy Reform
A Critique of the Proposed National Education Policy ReformChameera Dedduwage
 
CARE OF CHILD IN INCUBATOR..........pptx
CARE OF CHILD IN INCUBATOR..........pptxCARE OF CHILD IN INCUBATOR..........pptx
CARE OF CHILD IN INCUBATOR..........pptxGaneshChakor2
 
JAPAN: ORGANISATION OF PMDA, PHARMACEUTICAL LAWS & REGULATIONS, TYPES OF REGI...
JAPAN: ORGANISATION OF PMDA, PHARMACEUTICAL LAWS & REGULATIONS, TYPES OF REGI...JAPAN: ORGANISATION OF PMDA, PHARMACEUTICAL LAWS & REGULATIONS, TYPES OF REGI...
JAPAN: ORGANISATION OF PMDA, PHARMACEUTICAL LAWS & REGULATIONS, TYPES OF REGI...anjaliyadav012327
 
Z Score,T Score, Percential Rank and Box Plot Graph
Z Score,T Score, Percential Rank and Box Plot GraphZ Score,T Score, Percential Rank and Box Plot Graph
Z Score,T Score, Percential Rank and Box Plot GraphThiyagu K
 
Russian Call Girls in Andheri Airport Mumbai WhatsApp 9167673311 💞 Full Nigh...
Russian Call Girls in Andheri Airport Mumbai WhatsApp  9167673311 💞 Full Nigh...Russian Call Girls in Andheri Airport Mumbai WhatsApp  9167673311 💞 Full Nigh...
Russian Call Girls in Andheri Airport Mumbai WhatsApp 9167673311 💞 Full Nigh...Pooja Nehwal
 
SOCIAL AND HISTORICAL CONTEXT - LFTVD.pptx
SOCIAL AND HISTORICAL CONTEXT - LFTVD.pptxSOCIAL AND HISTORICAL CONTEXT - LFTVD.pptx
SOCIAL AND HISTORICAL CONTEXT - LFTVD.pptxiammrhaywood
 
microwave assisted reaction. General introduction
microwave assisted reaction. General introductionmicrowave assisted reaction. General introduction
microwave assisted reaction. General introductionMaksud Ahmed
 
mini mental status format.docx
mini    mental       status     format.docxmini    mental       status     format.docx
mini mental status format.docxPoojaSen20
 
Paris 2024 Olympic Geographies - an activity
Paris 2024 Olympic Geographies - an activityParis 2024 Olympic Geographies - an activity
Paris 2024 Olympic Geographies - an activityGeoBlogs
 
Activity 01 - Artificial Culture (1).pdf
Activity 01 - Artificial Culture (1).pdfActivity 01 - Artificial Culture (1).pdf
Activity 01 - Artificial Culture (1).pdfciinovamais
 

Último (20)

Disha NEET Physics Guide for classes 11 and 12.pdf
Disha NEET Physics Guide for classes 11 and 12.pdfDisha NEET Physics Guide for classes 11 and 12.pdf
Disha NEET Physics Guide for classes 11 and 12.pdf
 
Measures of Central Tendency: Mean, Median and Mode
Measures of Central Tendency: Mean, Median and ModeMeasures of Central Tendency: Mean, Median and Mode
Measures of Central Tendency: Mean, Median and Mode
 
Código Creativo y Arte de Software | Unidad 1
Código Creativo y Arte de Software | Unidad 1Código Creativo y Arte de Software | Unidad 1
Código Creativo y Arte de Software | Unidad 1
 
BASLIQ CURRENT LOOKBOOK LOOKBOOK(1) (1).pdf
BASLIQ CURRENT LOOKBOOK  LOOKBOOK(1) (1).pdfBASLIQ CURRENT LOOKBOOK  LOOKBOOK(1) (1).pdf
BASLIQ CURRENT LOOKBOOK LOOKBOOK(1) (1).pdf
 
BAG TECHNIQUE Bag technique-a tool making use of public health bag through wh...
BAG TECHNIQUE Bag technique-a tool making use of public health bag through wh...BAG TECHNIQUE Bag technique-a tool making use of public health bag through wh...
BAG TECHNIQUE Bag technique-a tool making use of public health bag through wh...
 
Advanced Views - Calendar View in Odoo 17
Advanced Views - Calendar View in Odoo 17Advanced Views - Calendar View in Odoo 17
Advanced Views - Calendar View in Odoo 17
 
Software Engineering Methodologies (overview)
Software Engineering Methodologies (overview)Software Engineering Methodologies (overview)
Software Engineering Methodologies (overview)
 
Q4-W6-Restating Informational Text Grade 3
Q4-W6-Restating Informational Text Grade 3Q4-W6-Restating Informational Text Grade 3
Q4-W6-Restating Informational Text Grade 3
 
Organic Name Reactions for the students and aspirants of Chemistry12th.pptx
Organic Name Reactions  for the students and aspirants of Chemistry12th.pptxOrganic Name Reactions  for the students and aspirants of Chemistry12th.pptx
Organic Name Reactions for the students and aspirants of Chemistry12th.pptx
 
A Critique of the Proposed National Education Policy Reform
A Critique of the Proposed National Education Policy ReformA Critique of the Proposed National Education Policy Reform
A Critique of the Proposed National Education Policy Reform
 
CARE OF CHILD IN INCUBATOR..........pptx
CARE OF CHILD IN INCUBATOR..........pptxCARE OF CHILD IN INCUBATOR..........pptx
CARE OF CHILD IN INCUBATOR..........pptx
 
JAPAN: ORGANISATION OF PMDA, PHARMACEUTICAL LAWS & REGULATIONS, TYPES OF REGI...
JAPAN: ORGANISATION OF PMDA, PHARMACEUTICAL LAWS & REGULATIONS, TYPES OF REGI...JAPAN: ORGANISATION OF PMDA, PHARMACEUTICAL LAWS & REGULATIONS, TYPES OF REGI...
JAPAN: ORGANISATION OF PMDA, PHARMACEUTICAL LAWS & REGULATIONS, TYPES OF REGI...
 
Z Score,T Score, Percential Rank and Box Plot Graph
Z Score,T Score, Percential Rank and Box Plot GraphZ Score,T Score, Percential Rank and Box Plot Graph
Z Score,T Score, Percential Rank and Box Plot Graph
 
Russian Call Girls in Andheri Airport Mumbai WhatsApp 9167673311 💞 Full Nigh...
Russian Call Girls in Andheri Airport Mumbai WhatsApp  9167673311 💞 Full Nigh...Russian Call Girls in Andheri Airport Mumbai WhatsApp  9167673311 💞 Full Nigh...
Russian Call Girls in Andheri Airport Mumbai WhatsApp 9167673311 💞 Full Nigh...
 
INDIA QUIZ 2024 RLAC DELHI UNIVERSITY.pptx
INDIA QUIZ 2024 RLAC DELHI UNIVERSITY.pptxINDIA QUIZ 2024 RLAC DELHI UNIVERSITY.pptx
INDIA QUIZ 2024 RLAC DELHI UNIVERSITY.pptx
 
SOCIAL AND HISTORICAL CONTEXT - LFTVD.pptx
SOCIAL AND HISTORICAL CONTEXT - LFTVD.pptxSOCIAL AND HISTORICAL CONTEXT - LFTVD.pptx
SOCIAL AND HISTORICAL CONTEXT - LFTVD.pptx
 
microwave assisted reaction. General introduction
microwave assisted reaction. General introductionmicrowave assisted reaction. General introduction
microwave assisted reaction. General introduction
 
mini mental status format.docx
mini    mental       status     format.docxmini    mental       status     format.docx
mini mental status format.docx
 
Paris 2024 Olympic Geographies - an activity
Paris 2024 Olympic Geographies - an activityParis 2024 Olympic Geographies - an activity
Paris 2024 Olympic Geographies - an activity
 
Activity 01 - Artificial Culture (1).pdf
Activity 01 - Artificial Culture (1).pdfActivity 01 - Artificial Culture (1).pdf
Activity 01 - Artificial Culture (1).pdf
 

Time series

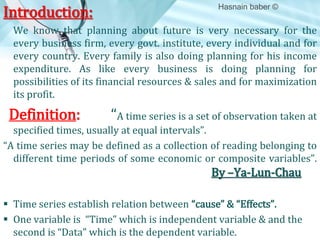
  • 1. Introduction: Hasnain baber © We know that planning about future is very necessary for the every business firm, every govt. institute, every individual and for every country. Every family is also doing planning for his income expenditure. As like every business is doing planning for possibilities of its financial resources & sales and for maximization its profit. Definition: “A time series is a set of observation taken at specified times, usually at equal intervals”. “A time series may be defined as a collection of reading belonging to different time periods of some economic or composite variables”. By –Ya-Lun-Chau  Time series establish relation between “cause” & “Effects”.  One variable is “Time” which is independent variable & and the second is “Data” which is the dependent variable.
  • 2. A time series is……  A set of data depending on the time  A series of values over a period of time  Collection of magnitudes belonging to different time periods of some variable or composite of variables such as production of steel, per capita income, gross national income, price of tobacco, index of industrial production. • Time is act as a device to set of common stable reference point. • In time series, time act as an independent variable to estimate dependent variables
  • 3. We explain it from the following example: Day No. of Packets of milk sold Year Population (in Million) Monday 90 1921 251 Tuesday 88 1931 279 Wednesday 85 1941 319 Thursday 75 1951 361 Friday 72 1961 439 Saturday 90 1971 548 Sunday 102 1981 685 • From example 1 it is clear that the sale of milk packets is decrease from Monday to Friday then again its start to increase. • Same thing in example 2 the population is continuously increase.
  • 4. CAUSES OF VARIATIONS IN TIME SERIES DATA • Social customs, festivals etc. • Seasons • The four phase of business : prosperity, decline, depression, recovery • Natural calamities: earthquake, epidemic, flood, drought etc. • Political movements/changes, war etc.
  • 5. Importance of Time Series Analysis:- As the basis of Time series Analysis businessman can predict abou the changes in economy. There are following points which clear about the its importance: 1. Profit of experience. 2. Safety from future 3. Utility Studies 4. Sales Forecasting 5. Budgetary Analysis 6. Stock Market Analysis 7. Yield Projections 8. Process and Quality Control 9. Inventory Studies 10. Economic Forecasting 11. Risk Analysis & Evaluation of changes. 12. Census Analysis
  • 6. Components of Time Series:1. 2. 3. 4. • Secular Trend or Trend • Seasonal Variations/Fluctuations • Cyclical Variations/Fluctuations • Irregular Variations/Movements
  • 7. SECULAR TREND OR TREND • The general tendency of the data to grow or decline over a long period of time. • The forces which are constant over a long period (or even if they vary they do so very gradually) produce the trend. For e.g., population change, technological progress, improvement in business organization, better medical facility etc. • E.g., Formation of rocks
  • 8. • Downward trend-declining death rate • Upward trend-population growth • Mathematically trend may be Linear or non- linear
  • 9. For example, Population increases over a period of time,price increases over a period of years,production of goods on the capital market of the country increases over a period of years.These are the examples of upward trend. The sales of a commodity may decrease over a period of time because of better products coming to the market.This is an example of declining trend or downward. PURPOSE OF MEASURING TREND Knowledge of past behavior Estimation Study of other components
  • 10. SEASONAL VARIATIONS/FLUCTUATIONS • The component responsible for the regular rise or fall (fluctuations) in the time series during a period not more than 1 year. • Fluctuations occur in regular sequence (periodical) • The period being a year, a month, a week, a day, or even a fraction of the day, an hour etc. • Term “SEASONAL” is meant to include any kind of variation which is of periodic nature and whose repeating cycles are of relatively short duration. • The factors that cause seasonal variations are: (a) Climate & weather condition, (b) Customs traditions & habits
  • 12. PURPOSE OF MEASURING SEASONAL VARIATIONS • Analysis of past behavior of the series • Forecasting the short time fluctuations • Elimination of the seasonal variations for measuring cyclic variations
  • 13. EXAMPLES OF SEASONAL VARIATIONS • Crops are sown and harvested at certain times every year and the demand for the labour gowing up during sowing and harvesting seasons. • Demands for wollen clothes goes up in winter • Price increases during festivals • Withdraws from banks are heavy during first week of the month. • The number of letter posted on Saturday is larger.
  • 14. CYCLIC VARIATIONS • Cycle refers to recurrent variations in time series • Cyclical variations usually last longer than a year • Cyclic fluctuations/variations are long term movements that represent consistently recurring rises and declines in activity.
  • 15. BUSINESS CYCLE Consists of 4 phases: prosperity, decline, depressions, recovery A business cycle showing these oscillatory movements has to pass through four phases-prosperity, recession, depression and recovery. In a business, these four phases are completed by passing one to another in this order. •
  • 16. purpose • Measures of past cyclical behavior • Forecasting • Useful in formulating policies in business
  • 17. IRREGULAR VARIATIONS • Also called erratic, random, or “accidental” variations • Do not repeat in a definite pattern • Strikes, fire, wars, famines, floods, earthquakes • unpredictable
  • 18. CHARACTERISTICS • • • • Irregular & unpredictable No definite pattern Short period of time No Statistical technique
  • 19. Measurement of Secular trend:• The following methods are used for calculation of trend:     Free Hand Curve Method: Semi – Average Method: Moving Average Method: Least Square Method:
  • 20. e hand Curve Method:• In this method the data is denoted on graph paper. We take “Time” on ‘x’ axis and “Data” on the ‘y’ axis. On graph there will be a point for every point of time. We make a smooth hand curve with the help of this plotted points. Example: Draw a free hand curve on the basis of the following data: Years 1989 1990 1991 1992 1993 1994 1995 1996 Profit (in ‘000) 148 149 149.5 149 150.5 152.2 153.7 153
  • 21. 155 154 153 Trend Line 152 151 150 Profit ('000) 149 Actual Data 148 147 146 145 1989 1990 1991 1992 1993 1994 1995 1996
  • 22. mi – Average Method:• In this method the given data are divided in two parts, preferable with the equal number of years. • For example, if we are given data from 1991 to 2008, i.e., over a period of 18 years, the two equal parts will be first nine years, i.e.,1991 to 1999 and from 2000 to 2008. In case of odd number of years like, 9, 13, 17, etc.., two equal parts can be made simply by ignoring the middle year. For example, if data are given for 19 years from 1990 to 2007 the two equal parts would be from 1990 to 1998 and from 2000 to 2008 - the middle year 1999 will be ignored.
  • 23. • Example: Find the trend line from the following data by Semi – Average Method:Year 1989 Production 150 (M.Ton.) 1990 1991 1992 1993 1994 1995 1996 152 153 151 154 153 156 158 There are total 8 trends. Now we distributed it in equal part. Now we calculated Average mean for every part. First Part = 150 + 152 + 153 + 151 4 = 151.50 Second Part = 154 + 153 + 156 + 158 = 155.25 4
  • 26. Moving Average Method:• It is one of the most popular method for calculating Long Term Trend. This method is also used for ‘Seasonal fluctuation’, ‘cyclical fluctuation’ & ‘irregular fluctuation’. In this method we calculate the ‘Moving Average for certain years. • For example: If we calculating ‘Three year’s Moving Average’ then according to this method: =(1)+(2)+(3) , (2)+(3)+(4) , (3)+(4)+(5), …………….. 3 3 3 Where (1),(2),(3),………. are the various years of time series. Example: Find out the five year’s moving Average: Year 1982 1983 1984 1985 1986 1987 1988 1989 1990 1991 1992 1993 1994 1995 1996 Price 20 25 33 33 27 35 40 43 35 32 37 48 50 37 45
  • 27. Year (1) 1982 1983 1984 1985 1986 1987 1988 1989 1990 1991 1992 1993 1994 1995 1996 Price of sugar (Rs.) (2) 20 25 33 30 27 35 40 43 35 32 37 48 50 37 45 Five year’s moving Total (3) 135 150 165 175 180 185 187 195 202 204 217 - Five year’s moving Average (Col 3/5) (4) 27 30 33 35 36 27 37.4 39 40.4 40.8 43.4 -
  • 28. Least Square Method:• This method is most widely in practice. When this method is applied, a trend line is fitted to data in such a manner that the following two conditions are satisfied: The sum of deviations of the actual values of y and computed values of y is zero.  Y  Y   0 c  i.e., the sum of the squares of the deviation of the actual and computed values is least from this line. That is why method is called the method of least squares. The line obtained by this method is known as the line of `best fit`. 2 Y  Y  is least  c
  • 29. The Method of least square can be used either to fit a straight line trend or a parabolic trend. The straight line trend is represented by the equation:- = Yc = a + bx Where, Y = Trend value to be computed X = Unit of time (Independent Variable) a = Constant to be Calculated b = Constant to be calculated Example:Draw a straight line trend and estimate trend value for 1996: Year 1991 1992 1993 1994 1995 Production 8 9 8 9 16
  • 30. Solution:Year (1) Deviation From 1990 X (2) Y (3) XY (4) X2 (5) Trend Yc = a + bx (6) 1991 1 8 8 1 5.2 + 1.6(1) = 6.8 1992 2 9 18 4 5.2 + 1.6(2) = 8.4 1993 3 8 24 9 5.2 + 1.6(3) = 10.0 1994 4 9 36 16 5.2 + 1.6(4) = 11.6 1995 5 16 80 25 5.2 + 1.6(5) = 13.2 N= 5 X Y  XY =50 = 166 X 2 ’ = 15 = 55 Now we calculate the value of two constant ‘a’ and ‘b’ with the help of two equation:-
  • 31.  Y  Na  b X  XY  a X  b X Now we put the value of 2 X , Y ,  XY ,  X 2 ,&N : 50 = 5a + 15(b) ……………. 166 = 15a + 55(b) ……………… Or 5a + 15b = 50 ……………… 15a + 55b = 166 …………………. (i) (ii) (iii) (iv) Equation (iii) Multiply by 3 and subtracted by (iv) -10b = -16 b = 1.6 Now we put the value of “b” in the equation (iii)
  • 32. = 5a + 15(1.6) = 50 5a = 26 26 a = 5 = 5.2 As according the value of ‘a’ and ‘b’ the trend line:Yc = a + bx Y= 5.2 + 1.6X Now we calculate the trend line for 1996:Y1996 = 5.2 + 1.6 (6) = 14.8
  • 33.  Shifting The Trend Origin:• In above Example the trend equation is: Y = 5.2 + 1.6x Here the base year is 1993 that means actual base of these year will 1st July 1993. Now we change the base year in 1991. Now the base year is back 2 years unit than previous base year. Now we will reduce the twice of the value of the ‘b’ from the value of ‘a’. Then the new value of ‘a’ = 5.2 – 2(1.6) Now the trend equation on the basis of year 1991: Y = 2.0+ 1.6x
  • 34. Parabolic Curve:Many times the line which draw by “Least Square Method” is not prove ‘Line of best fit’ because it is not present actual long term trend So we distributed Time Series in subpart and make following equation:- Yc = a + bx + cx2  If this equation is increase up to second degree then it is “Parabola of second degree” and if it is increase up to third degree then it “Parabola of third degree”. There are three constant ‘a’, ‘b’ and ‘c’. Its are calculated by following three equation:-
  • 35. Parabola of second degree:Y  Na  b X  c X 2  XY  a X  b X 2  c X 3  X 2Y  a X 2  b X 3  c X 4  If we take the deviation from ‘Mean year’ then the all three equation are presented like this: Y  Na  C  X 2  XY  b X 2  X 2Y  a X 2  c X 4  
  • 36. Example: Draw a parabola of second degree from the following data:Year 1992 1993 1994 1995 1996 Production (000) 5 7 4 9 10 Year Production Dev. From Middle Year (x) xY x2 x2Y x3 x4 Trend Value Y = a + bx + cx2 1992 5 -2 -10 4 20 -8 16 5.7 1993 7 -1 -7 1 7 -1 1 5.6 1994 4 0 0 0 0 0 0 6.3 1995 9 1 9 1 9 1 1 8.0 1996 10 2 20 4 40 8 16 10.5 Y = 35 X X Y X X  XY  X =12 = 10 = 76 = 0 = 34 2 =0 2 3 4
  • 37. We take deviation from middle year so the equations are as below:  Y  Na   X  XY  b X  X Y  a X  c X 2 2 2 2 4  2 3 4 Now we put the value of  X , Y ,  XY ,  X ,  X ,  X ,&N 35 = 5a + 10c 12 = 10b 76 = 10a + 34c ………………………… (i) ………………………… ……………………….. (iii) 12 10 From equation (ii) we get b = = 1.2 (ii)
  • 38. Equation (ii) is multiply by 2 and subtracted from (iii): 10a + 34c = 76 10a + 20c = 70 14c = 6 or c = …………….. …………….. 6 14 = 0.43 Now we put the value of c in equation (i) 5a + 10 (0.43) = 35 5a = 35-4.3 = 5a = 30.7 a = 6.14 Now after putting the value of ‘a’, ‘b’ and ‘c’, Parabola of second degree is made that is: Y = 6.34 + 1.2x + 0.43x2 (iv) (v)
  • 39. Parabola of Third degree:• There are four constant ‘a’, ‘b’, ‘c’ and ‘d’ which are calculated by following equation. The main equation is Yc = a + bx + cx2 + dx3. There are also four normal equation. Y  Na  b X  c X 2  d  X 3  XY  a  X  b X 2  c X 3  d  X 4  X 2Y  a  X 2  b X 3  c X 4  d  X 5  X 3Y  a  X 3  b X 4  c X 5  d  X 6 
  • 40. Seasonal Average Method • Seasonal Averages = Total of Seasonal Values No. Of Years • General Averages = Total of Seasonal Averages No. Of Seasons • Seasonal Index = Seasonal Average General Average
  • 41. EXAMPLE:• From the following data calculate quarterly seasonal indices assuming the absence of any type of trend: Year I II III IV 1989 - - 127 134 1990 130 122 122 132 1991 120 120 118 128 1992 126 116 121 130 1993 127 118 - -
  • 42. Solution:Calculation of quarterly seasonal indices Year I II III IV 1989 - - 127 134 1990 130 122 122 132 1991 120 120 118 128 1992 126 116 121 130 1993 127 118 - - Total 503 476 488 524 Average 125.75 119 122 131 Quarterly Turnover seasonal indices 124.44 = 100 101.05 95.6 98.04 105.03 Total 497.75
  • 43. • General Average = 497.75 = 124.44 4 Quarterly Seasonal variation index = 125.75 x 100 124.44 So as on we calculate the other seasonal indices
  • 44. Link Relative Method: • In this Method the following steps are taken for calculating the seasonal variation indices • We calculate the link relatives of seasonal figures. Link Relative: Current Season’s Figure x 100 Previous Season’s Figure • We calculate the average of link relative foe each season. • Convert These Averages in to chain relatives on the basis of the first seasons.
  • 45. • Calculate the chain relatives of the first season on the base of the last seasons. There will be some difference between the chain relatives of the first seasons and the chain relatives calculated by the pervious Method. • This difference will be due to effect of long term changes. • For correction the chain relatives of the first season calculated by 1st method is deducted from the chain relative calculated by the second method. • Then Express the corrected chain relatives as percentage of their averages.
  • 46. Ratio To Moving Average Method: • In this method seasonal variation indices are calculated in following steps: • We calculate the 12 monthly or 4 quarterly moving average. • We use following formula for calculating the moving average Ratio: Moving Average Ratio= Original Data x 100 Moving Average Then we calculate the seasonal variation indices on the basis of average of seasonal variation.
  • 47. Ratio To Trend Method:• This method based on Multiple model of Time Series. In It We use the following Steps: • We calculate the trend value for various time duration (Monthly or Quarterly) with the help of Least Square method • Then we express the all original data as the percentage of trend on the basis of the following formula. = Original Data x 100 Trend Value Rest of Process are as same as moving Average Method
  • 48. Methods Of Cyclical Variation:- Residual Method References cycle analysis method Direct Method Harmonic Analysis Method
  • 49. Residual Method:• Cyclical variations are calculated by Residual Method . This method is based on the multiple model of the time Series. The process is as below: • (a) When yearly data are given: In class of yearly data there are not any seasonal variations so original data are effect by three components: » Trend Value » Cyclical » Irregular (b) When monthly or quarterly data are given: First we calculate the seasonal variation indices according to moving average ratio method. At last we express the cyclical and irregular variation as the Trend Ratio & Seasonal variation Indices
  • 50. Measurement of Irregular Variations • The irregular components in a time series represent the residue of fluctuations after trend cycle and seasonal movements have been accounted for. Thus if the original data is divided by T,S and C ; we get I i.e. . In Practice the cycle itself is so erratic and is so interwoven with irregular movement that is impossible to separate them.