SlideShare una empresa de Scribd logo
1 de 6
Descargar para leer sin conexión
Excel 2007
Creating Pivot Tables
Introduction
Pivot Table Reports
Watch the video! (10:41min) - Tips for watching our videos.
Download the example to work along with the video.
Why are They Named Pivot Tables?
You may be wondering why it is called a pivot table. Basically, pivot tables allow you to pivot, or move, data so
that you can produce answers to questions. Once you create a pivot table, you can very easily see what effect
pivoting the data has on the spreadsheet information.
To Create a Pivot Table Report (Part I):
Š Select the cells in your spreadsheet that you want to use in the pivot table report.
Š Select the Insert tab.
Š Click the PivotTable command.
Š Click PivotTable again. Excel selects cells in the actual spreadsheet and the Create PivotTable dialog
box opens.
» Select a table or range is already selected and the Table/Range field shows the range of the
selected data. New Worksheet is also selected by default as the place where the report will be
placed.
Page 1
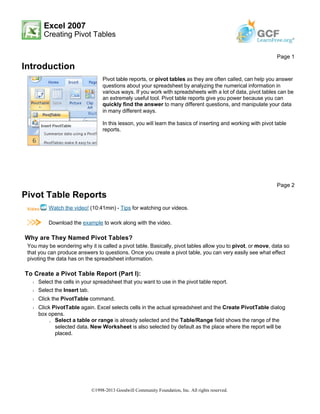
Pivot table reports, or pivot tables as they are often called, can help you answer
questions about your spreadsheet by analyzing the numerical information in
various ways. If you work with spreadsheets with a lot of data, pivot tables can be
an extremely useful tool. Pivot table reports give you power because you can
quickly find the answer to many different questions, and manipulate your data
in many different ways.
In this lesson, you will learn the basics of inserting and working with pivot table
reports.
Page 2
©1998-2013 Goodwill Community Foundation, Inc. All rights reserved.
Š Click Existing Worksheet and select a worksheet, if you do not want the pivot table to appear in a new
worksheet.
Š Click OK.
Creating a Pivot Table Report
If you use the sample spreadsheet to create a pivot table, you can see that the column headings are
salesperson, region, account, order amount, and month. When you create a pivot table, each column label
in your data becomes a field that can be used in the report. The Field List appears on the right side of the
report, while the layout area appears on the left.
Page 3
©1998-2013 Goodwill Community Foundation, Inc. All rights reserved.
To Create a Pivot Table Report (Part 2):
Š Determine what question you want your pivot table report to answer. For example, using the sample
spreadsheet, you might want to know which salesperson sold the greatest dollar amount.
Š Determine the fields that are necessary to answer this question. In this example, salesperson and order
amount.
Š Select the check box next to the Salesperson field in the PivotTable Field List. The field will appear in the
drag and drop area at the bottom of the field list and in the layout area. The order amount data appears on
the right. This is a default setting in Excel – data with numbers will always appear on the right.
Š Select the check box next to the Order Amount field in the PivotTable Field List. The field will appear in
the drag and drop area at the bottom of the field list and in the layout area. All of the salesperson data
appears on the left side as rows.
Š You can now see the answer to your question in the report on the left.
©1998-2013 Goodwill Community Foundation, Inc. All rights reserved.
To Add a Report Filter:
Š Select a field in the Field List. In this example, choose Region. By default, it will appear in the Row Labels
group.
Š Click and drag Region into the Report Filter section.
Š Release the mouse button. The region appears at the top of the report as a filter.
Š The arrow by the Region fields shows (All). To show just the data for a specific region, click the drop-down
arrow and select the region. To see multiple regions, click the Multiple Regions box, select the regions to
display, and then, click OK.
Moving, or Pivoting Data:
Š Click and drag a field from one area to another.
Š Release the mouse button to drop the field in the new area. In this example, we move Region from Report
Page 4
©1998-2013 Goodwill Community Foundation, Inc. All rights reserved.
Filter to Column Label. The pivot table report will change.
OR
Š Right-click one of the rows. A menu will appear.
Š Select Move and then select a move option.
To Create a PivotChart
Š Select the Pivot Chart command from the Options tab. The Insert Chart dialog box appears.
©1998-2013 Goodwill Community Foundation, Inc. All rights reserved.
Š Select the chart you’d like to insert.
Š Click OK. The chart will now appear on the same sheet as the Pivot Table.
The information in the chart includes the information in the pivot table, rather than all the original source data.
Challenge!
Use the Company Sales workbook to complete this challenge.
Page 5
Š Create a pivot table report that calculates the amount each salesperson sold.
Š Filter the report by region.
Š View the data for the salespeople in the North and West region.
Š Who sold the greatest dollar amount in those two regions?
©1998-2013 Goodwill Community Foundation, Inc. All rights reserved.

Más contenido relacionado

La actualidad más candente

Excel Crash Course: Pivot Tables
Excel Crash Course: Pivot TablesExcel Crash Course: Pivot Tables
Excel Crash Course: Pivot TablesBobby Jones
 
How to create pivot table in excel
How to create pivot table in excelHow to create pivot table in excel
How to create pivot table in excelAashirJamil
 
Working with Pivot Tables
Working with Pivot TablesWorking with Pivot Tables
Working with Pivot TablesKingston Tagoe
 
Lesson11 working with charts
Lesson11 working with chartsLesson11 working with charts
Lesson11 working with chartsricsanmae
 
WorldCat Local Lists for Serials Reporting
WorldCat Local Lists for Serials ReportingWorldCat Local Lists for Serials Reporting
WorldCat Local Lists for Serials ReportingDarinlee Needham
 
Creating & Editing Charts In Microsoft Excel 2003
Creating & Editing Charts In Microsoft Excel 2003Creating & Editing Charts In Microsoft Excel 2003
Creating & Editing Charts In Microsoft Excel 2003bud_00
 
Gl2010 m6 ex4_presentation
Gl2010 m6 ex4_presentationGl2010 m6 ex4_presentation
Gl2010 m6 ex4_presentationTracie King
 
The Ultimate Guide to Ad5 e808 adobe audience manager business practitioner e...
The Ultimate Guide to Ad5 e808 adobe audience manager business practitioner e...The Ultimate Guide to Ad5 e808 adobe audience manager business practitioner e...
The Ultimate Guide to Ad5 e808 adobe audience manager business practitioner e...PennyJose1
 
Module 6 (2) type of excel chart
Module 6 (2) type of excel chartModule 6 (2) type of excel chart
Module 6 (2) type of excel chartDr. Shalini Pandey
 
Lesson 11 working with charts
Lesson 11   working with chartsLesson 11   working with charts
Lesson 11 working with chartsguevarra_2000
 
Pivot table presentation
Pivot table presentationPivot table presentation
Pivot table presentationSha Tibnjn
 

La actualidad más candente (20)

Excel 2007 Get Started With Pivot Table Reports
Excel 2007  Get Started With  Pivot Table ReportsExcel 2007  Get Started With  Pivot Table Reports
Excel 2007 Get Started With Pivot Table Reports
 
Pivot Tables
Pivot TablesPivot Tables
Pivot Tables
 
Charts and pivot tables
Charts and pivot tablesCharts and pivot tables
Charts and pivot tables
 
Excel Crash Course: Pivot Tables
Excel Crash Course: Pivot TablesExcel Crash Course: Pivot Tables
Excel Crash Course: Pivot Tables
 
How to create pivot table in excel
How to create pivot table in excelHow to create pivot table in excel
How to create pivot table in excel
 
Working with Pivot Tables
Working with Pivot TablesWorking with Pivot Tables
Working with Pivot Tables
 
Lesson11 working with charts
Lesson11 working with chartsLesson11 working with charts
Lesson11 working with charts
 
WorldCat Local Lists for Serials Reporting
WorldCat Local Lists for Serials ReportingWorldCat Local Lists for Serials Reporting
WorldCat Local Lists for Serials Reporting
 
Ppt on pivot table
Ppt on pivot tablePpt on pivot table
Ppt on pivot table
 
Excel Pivot Tables
Excel Pivot TablesExcel Pivot Tables
Excel Pivot Tables
 
Creating & Editing Charts In Microsoft Excel 2003
Creating & Editing Charts In Microsoft Excel 2003Creating & Editing Charts In Microsoft Excel 2003
Creating & Editing Charts In Microsoft Excel 2003
 
Pivot table
Pivot tablePivot table
Pivot table
 
Print16
Print16Print16
Print16
 
Pivot Tables
Pivot TablesPivot Tables
Pivot Tables
 
Gl2010 m6 ex4_presentation
Gl2010 m6 ex4_presentationGl2010 m6 ex4_presentation
Gl2010 m6 ex4_presentation
 
Pivot Table | Statistics
Pivot Table | StatisticsPivot Table | Statistics
Pivot Table | Statistics
 
The Ultimate Guide to Ad5 e808 adobe audience manager business practitioner e...
The Ultimate Guide to Ad5 e808 adobe audience manager business practitioner e...The Ultimate Guide to Ad5 e808 adobe audience manager business practitioner e...
The Ultimate Guide to Ad5 e808 adobe audience manager business practitioner e...
 
Module 6 (2) type of excel chart
Module 6 (2) type of excel chartModule 6 (2) type of excel chart
Module 6 (2) type of excel chart
 
Lesson 11 working with charts
Lesson 11   working with chartsLesson 11   working with charts
Lesson 11 working with charts
 
Pivot table presentation
Pivot table presentationPivot table presentation
Pivot table presentation
 

Destacado (17)

Print12
Print12Print12
Print12
 
Print14
Print14Print14
Print14
 
Print7
Print7Print7
Print7
 
Print1
Print1Print1
Print1
 
Print13
Print13Print13
Print13
 
Print11
Print11Print11
Print11
 
Print8
Print8Print8
Print8
 
Print4
Print4Print4
Print4
 
Print10
Print10Print10
Print10
 
Print15
Print15Print15
Print15
 
Print17
Print17Print17
Print17
 
Print6.pdf
Print6.pdfPrint6.pdf
Print6.pdf
 
Print5
Print5Print5
Print5
 
Print3
Print3Print3
Print3
 
Print9
Print9Print9
Print9
 
Excel Lesson 1: Excel Basics
Excel Lesson 1: Excel BasicsExcel Lesson 1: Excel Basics
Excel Lesson 1: Excel Basics
 
Print2
Print2Print2
Print2
 

Similar a Print18

ACTG Tableau intro labDownload the TableauLab file and look ov.docx
ACTG   Tableau intro labDownload the TableauLab file and look ov.docxACTG   Tableau intro labDownload the TableauLab file and look ov.docx
ACTG Tableau intro labDownload the TableauLab file and look ov.docxnettletondevon
 
Easy Pivot Tutorial June 2020
Easy Pivot Tutorial June 2020Easy Pivot Tutorial June 2020
Easy Pivot Tutorial June 2020Adhi Wikantyoso
 
Create a PivotTable to analyze worksheet data.pdf
Create a PivotTable to analyze worksheet data.pdfCreate a PivotTable to analyze worksheet data.pdf
Create a PivotTable to analyze worksheet data.pdfAbubakar Bashir
 
Introduction to Business analytics unit3
Introduction to Business analytics unit3Introduction to Business analytics unit3
Introduction to Business analytics unit3jayarellirs
 
This image appears when a project instruction has changed to accommo.docx
This image appears when a project instruction has changed to accommo.docxThis image appears when a project instruction has changed to accommo.docx
This image appears when a project instruction has changed to accommo.docxjuan1826
 
Pivot tableinfo
Pivot tableinfoPivot tableinfo
Pivot tableinfoEsha Saha
 
SACRAO Presentation T4.3.pdf
SACRAO Presentation T4.3.pdfSACRAO Presentation T4.3.pdf
SACRAO Presentation T4.3.pdfPeputraHiring
 
1 Mashing Up Data with PowerPivot When Filter, .docx
1 Mashing Up Data with PowerPivot  When Filter, .docx1 Mashing Up Data with PowerPivot  When Filter, .docx
1 Mashing Up Data with PowerPivot When Filter, .docxkarisariddell
 
Tableau online training || Tableau Server
Tableau online training || Tableau ServerTableau online training || Tableau Server
Tableau online training || Tableau ServerUnited Trainings
 
Tableau online training || Tableau Server
Tableau online training || Tableau ServerTableau online training || Tableau Server
Tableau online training || Tableau ServerUnited Trainings
 
Tableau online training
Tableau online trainingTableau online training
Tableau online trainingsuresh
 
Link to Coffee Shop-- httpextmedia.kaplan.edubusinessMediaAB.docx
Link to Coffee Shop-- httpextmedia.kaplan.edubusinessMediaAB.docxLink to Coffee Shop-- httpextmedia.kaplan.edubusinessMediaAB.docx
Link to Coffee Shop-- httpextmedia.kaplan.edubusinessMediaAB.docxSHIVA101531
 
Data camp - Tableau basics cheat sheet.pdf
Data camp - Tableau basics cheat sheet.pdfData camp - Tableau basics cheat sheet.pdf
Data camp - Tableau basics cheat sheet.pdfGhulamMustafa873251
 
Excel pivot tables (1)
Excel pivot tables (1)Excel pivot tables (1)
Excel pivot tables (1)priyanka8587
 

Similar a Print18 (20)

ACTG Tableau intro labDownload the TableauLab file and look ov.docx
ACTG   Tableau intro labDownload the TableauLab file and look ov.docxACTG   Tableau intro labDownload the TableauLab file and look ov.docx
ACTG Tableau intro labDownload the TableauLab file and look ov.docx
 
Easy Pivot Tutorial June 2020
Easy Pivot Tutorial June 2020Easy Pivot Tutorial June 2020
Easy Pivot Tutorial June 2020
 
Create a PivotTable to analyze worksheet data.pdf
Create a PivotTable to analyze worksheet data.pdfCreate a PivotTable to analyze worksheet data.pdf
Create a PivotTable to analyze worksheet data.pdf
 
Introduction to Business analytics unit3
Introduction to Business analytics unit3Introduction to Business analytics unit3
Introduction to Business analytics unit3
 
This image appears when a project instruction has changed to accommo.docx
This image appears when a project instruction has changed to accommo.docxThis image appears when a project instruction has changed to accommo.docx
This image appears when a project instruction has changed to accommo.docx
 
MS Excel Training 02
MS Excel Training 02MS Excel Training 02
MS Excel Training 02
 
Access3
Access3Access3
Access3
 
Pivot tableinfo
Pivot tableinfoPivot tableinfo
Pivot tableinfo
 
SACRAO Presentation T4.3.pdf
SACRAO Presentation T4.3.pdfSACRAO Presentation T4.3.pdf
SACRAO Presentation T4.3.pdf
 
1 Mashing Up Data with PowerPivot When Filter, .docx
1 Mashing Up Data with PowerPivot  When Filter, .docx1 Mashing Up Data with PowerPivot  When Filter, .docx
1 Mashing Up Data with PowerPivot When Filter, .docx
 
Tableau online training || Tableau Server
Tableau online training || Tableau ServerTableau online training || Tableau Server
Tableau online training || Tableau Server
 
Tableau online training || Tableau Server
Tableau online training || Tableau ServerTableau online training || Tableau Server
Tableau online training || Tableau Server
 
Tableau online training
Tableau online trainingTableau online training
Tableau online training
 
MS Excel 2010 tutorial 6
MS Excel 2010 tutorial 6MS Excel 2010 tutorial 6
MS Excel 2010 tutorial 6
 
Microsoft Excel Tutorial
Microsoft Excel TutorialMicrosoft Excel Tutorial
Microsoft Excel Tutorial
 
Link to Coffee Shop-- httpextmedia.kaplan.edubusinessMediaAB.docx
Link to Coffee Shop-- httpextmedia.kaplan.edubusinessMediaAB.docxLink to Coffee Shop-- httpextmedia.kaplan.edubusinessMediaAB.docx
Link to Coffee Shop-- httpextmedia.kaplan.edubusinessMediaAB.docx
 
07 ms excel
07 ms excel07 ms excel
07 ms excel
 
Tableau+Cheat+Sheet.pdf
Tableau+Cheat+Sheet.pdfTableau+Cheat+Sheet.pdf
Tableau+Cheat+Sheet.pdf
 
Data camp - Tableau basics cheat sheet.pdf
Data camp - Tableau basics cheat sheet.pdfData camp - Tableau basics cheat sheet.pdf
Data camp - Tableau basics cheat sheet.pdf
 
Excel pivot tables (1)
Excel pivot tables (1)Excel pivot tables (1)
Excel pivot tables (1)
 

Más de Hassan Samoon

Financial Management 4th and 5th chapters
Financial Management 4th and 5th chaptersFinancial Management 4th and 5th chapters
Financial Management 4th and 5th chaptersHassan Samoon
 
The Value of Money - problems and solutions
The Value of Money - problems and solutionsThe Value of Money - problems and solutions
The Value of Money - problems and solutionsHassan Samoon
 
Introduction to cost & management accounting
Introduction to cost & management accountingIntroduction to cost & management accounting
Introduction to cost & management accountingHassan Samoon
 
Presentation on accounting cycle
Presentation on accounting cyclePresentation on accounting cycle
Presentation on accounting cycleHassan Samoon
 
Business communication
Business communicationBusiness communication
Business communicationHassan Samoon
 
Business Communication Complete Topics
Business Communication Complete TopicsBusiness Communication Complete Topics
Business Communication Complete TopicsHassan Samoon
 
MIS MCQs by hassan samoon
MIS MCQs by hassan samoonMIS MCQs by hassan samoon
MIS MCQs by hassan samoonHassan Samoon
 
Mason vs. burningham
Mason vs. burninghamMason vs. burningham
Mason vs. burninghamHassan Samoon
 
Hyde vs wrench. pptx
Hyde vs wrench. pptxHyde vs wrench. pptx
Hyde vs wrench. pptxHassan Samoon
 
Mis 1st chapter notes foundation of is in business
Mis 1st chapter notes foundation of is in businessMis 1st chapter notes foundation of is in business
Mis 1st chapter notes foundation of is in businessHassan Samoon
 
presentation, analysis and interpretation of data by hassan samoon
presentation, analysis and interpretation of data by hassan samoonpresentation, analysis and interpretation of data by hassan samoon
presentation, analysis and interpretation of data by hassan samoonHassan Samoon
 
Fielder Contingency theory of leadership by Hassan Samoon
Fielder Contingency theory of leadership by Hassan SamoonFielder Contingency theory of leadership by Hassan Samoon
Fielder Contingency theory of leadership by Hassan SamoonHassan Samoon
 

Más de Hassan Samoon (13)

Financial Management 4th and 5th chapters
Financial Management 4th and 5th chaptersFinancial Management 4th and 5th chapters
Financial Management 4th and 5th chapters
 
The Value of Money - problems and solutions
The Value of Money - problems and solutionsThe Value of Money - problems and solutions
The Value of Money - problems and solutions
 
Introduction to cost & management accounting
Introduction to cost & management accountingIntroduction to cost & management accounting
Introduction to cost & management accounting
 
Presentation on accounting cycle
Presentation on accounting cyclePresentation on accounting cycle
Presentation on accounting cycle
 
Business communication
Business communicationBusiness communication
Business communication
 
Business Communication Complete Topics
Business Communication Complete TopicsBusiness Communication Complete Topics
Business Communication Complete Topics
 
MIS MCQs by hassan samoon
MIS MCQs by hassan samoonMIS MCQs by hassan samoon
MIS MCQs by hassan samoon
 
Mason vs. burningham
Mason vs. burninghamMason vs. burningham
Mason vs. burningham
 
Hyde vs wrench. pptx
Hyde vs wrench. pptxHyde vs wrench. pptx
Hyde vs wrench. pptx
 
Mis 1st chapter notes foundation of is in business
Mis 1st chapter notes foundation of is in businessMis 1st chapter notes foundation of is in business
Mis 1st chapter notes foundation of is in business
 
presentation, analysis and interpretation of data by hassan samoon
presentation, analysis and interpretation of data by hassan samoonpresentation, analysis and interpretation of data by hassan samoon
presentation, analysis and interpretation of data by hassan samoon
 
Fielder Contingency theory of leadership by Hassan Samoon
Fielder Contingency theory of leadership by Hassan SamoonFielder Contingency theory of leadership by Hassan Samoon
Fielder Contingency theory of leadership by Hassan Samoon
 
Economic PPT
Economic PPTEconomic PPT
Economic PPT
 

Último

JAPAN: ORGANISATION OF PMDA, PHARMACEUTICAL LAWS & REGULATIONS, TYPES OF REGI...
JAPAN: ORGANISATION OF PMDA, PHARMACEUTICAL LAWS & REGULATIONS, TYPES OF REGI...JAPAN: ORGANISATION OF PMDA, PHARMACEUTICAL LAWS & REGULATIONS, TYPES OF REGI...
JAPAN: ORGANISATION OF PMDA, PHARMACEUTICAL LAWS & REGULATIONS, TYPES OF REGI...anjaliyadav012327
 
Measures of Central Tendency: Mean, Median and Mode
Measures of Central Tendency: Mean, Median and ModeMeasures of Central Tendency: Mean, Median and Mode
Measures of Central Tendency: Mean, Median and ModeThiyagu K
 
A Critique of the Proposed National Education Policy Reform
A Critique of the Proposed National Education Policy ReformA Critique of the Proposed National Education Policy Reform
A Critique of the Proposed National Education Policy ReformChameera Dedduwage
 
Nutritional Needs Presentation - HLTH 104
Nutritional Needs Presentation - HLTH 104Nutritional Needs Presentation - HLTH 104
Nutritional Needs Presentation - HLTH 104misteraugie
 
The Most Excellent Way | 1 Corinthians 13
The Most Excellent Way | 1 Corinthians 13The Most Excellent Way | 1 Corinthians 13
The Most Excellent Way | 1 Corinthians 13Steve Thomason
 
Web & Social Media Analytics Previous Year Question Paper.pdf
Web & Social Media Analytics Previous Year Question Paper.pdfWeb & Social Media Analytics Previous Year Question Paper.pdf
Web & Social Media Analytics Previous Year Question Paper.pdfJayanti Pande
 
Software Engineering Methodologies (overview)
Software Engineering Methodologies (overview)Software Engineering Methodologies (overview)
Software Engineering Methodologies (overview)eniolaolutunde
 
Separation of Lanthanides/ Lanthanides and Actinides
Separation of Lanthanides/ Lanthanides and ActinidesSeparation of Lanthanides/ Lanthanides and Actinides
Separation of Lanthanides/ Lanthanides and ActinidesFatimaKhan178732
 
9548086042 for call girls in Indira Nagar with room service
9548086042  for call girls in Indira Nagar  with room service9548086042  for call girls in Indira Nagar  with room service
9548086042 for call girls in Indira Nagar with room servicediscovermytutordmt
 
Activity 01 - Artificial Culture (1).pdf
Activity 01 - Artificial Culture (1).pdfActivity 01 - Artificial Culture (1).pdf
Activity 01 - Artificial Culture (1).pdfciinovamais
 
Beyond the EU: DORA and NIS 2 Directive's Global Impact
Beyond the EU: DORA and NIS 2 Directive's Global ImpactBeyond the EU: DORA and NIS 2 Directive's Global Impact
Beyond the EU: DORA and NIS 2 Directive's Global ImpactPECB
 
CARE OF CHILD IN INCUBATOR..........pptx
CARE OF CHILD IN INCUBATOR..........pptxCARE OF CHILD IN INCUBATOR..........pptx
CARE OF CHILD IN INCUBATOR..........pptxGaneshChakor2
 
SOCIAL AND HISTORICAL CONTEXT - LFTVD.pptx
SOCIAL AND HISTORICAL CONTEXT - LFTVD.pptxSOCIAL AND HISTORICAL CONTEXT - LFTVD.pptx
SOCIAL AND HISTORICAL CONTEXT - LFTVD.pptxiammrhaywood
 
Arihant handbook biology for class 11 .pdf
Arihant handbook biology for class 11 .pdfArihant handbook biology for class 11 .pdf
Arihant handbook biology for class 11 .pdfchloefrazer622
 
Measures of Dispersion and Variability: Range, QD, AD and SD
Measures of Dispersion and Variability: Range, QD, AD and SDMeasures of Dispersion and Variability: Range, QD, AD and SD
Measures of Dispersion and Variability: Range, QD, AD and SDThiyagu K
 
POINT- BIOCHEMISTRY SEM 2 ENZYMES UNIT 5.pptx
POINT- BIOCHEMISTRY SEM 2 ENZYMES UNIT 5.pptxPOINT- BIOCHEMISTRY SEM 2 ENZYMES UNIT 5.pptx
POINT- BIOCHEMISTRY SEM 2 ENZYMES UNIT 5.pptxSayali Powar
 

Último (20)

Código Creativo y Arte de Software | Unidad 1
Código Creativo y Arte de Software | Unidad 1Código Creativo y Arte de Software | Unidad 1
Código Creativo y Arte de Software | Unidad 1
 
JAPAN: ORGANISATION OF PMDA, PHARMACEUTICAL LAWS & REGULATIONS, TYPES OF REGI...
JAPAN: ORGANISATION OF PMDA, PHARMACEUTICAL LAWS & REGULATIONS, TYPES OF REGI...JAPAN: ORGANISATION OF PMDA, PHARMACEUTICAL LAWS & REGULATIONS, TYPES OF REGI...
JAPAN: ORGANISATION OF PMDA, PHARMACEUTICAL LAWS & REGULATIONS, TYPES OF REGI...
 
Measures of Central Tendency: Mean, Median and Mode
Measures of Central Tendency: Mean, Median and ModeMeasures of Central Tendency: Mean, Median and Mode
Measures of Central Tendency: Mean, Median and Mode
 
A Critique of the Proposed National Education Policy Reform
A Critique of the Proposed National Education Policy ReformA Critique of the Proposed National Education Policy Reform
A Critique of the Proposed National Education Policy Reform
 
Nutritional Needs Presentation - HLTH 104
Nutritional Needs Presentation - HLTH 104Nutritional Needs Presentation - HLTH 104
Nutritional Needs Presentation - HLTH 104
 
The Most Excellent Way | 1 Corinthians 13
The Most Excellent Way | 1 Corinthians 13The Most Excellent Way | 1 Corinthians 13
The Most Excellent Way | 1 Corinthians 13
 
Web & Social Media Analytics Previous Year Question Paper.pdf
Web & Social Media Analytics Previous Year Question Paper.pdfWeb & Social Media Analytics Previous Year Question Paper.pdf
Web & Social Media Analytics Previous Year Question Paper.pdf
 
Mattingly "AI & Prompt Design: Structured Data, Assistants, & RAG"
Mattingly "AI & Prompt Design: Structured Data, Assistants, & RAG"Mattingly "AI & Prompt Design: Structured Data, Assistants, & RAG"
Mattingly "AI & Prompt Design: Structured Data, Assistants, & RAG"
 
Software Engineering Methodologies (overview)
Software Engineering Methodologies (overview)Software Engineering Methodologies (overview)
Software Engineering Methodologies (overview)
 
Separation of Lanthanides/ Lanthanides and Actinides
Separation of Lanthanides/ Lanthanides and ActinidesSeparation of Lanthanides/ Lanthanides and Actinides
Separation of Lanthanides/ Lanthanides and Actinides
 
9548086042 for call girls in Indira Nagar with room service
9548086042  for call girls in Indira Nagar  with room service9548086042  for call girls in Indira Nagar  with room service
9548086042 for call girls in Indira Nagar with room service
 
Activity 01 - Artificial Culture (1).pdf
Activity 01 - Artificial Culture (1).pdfActivity 01 - Artificial Culture (1).pdf
Activity 01 - Artificial Culture (1).pdf
 
Beyond the EU: DORA and NIS 2 Directive's Global Impact
Beyond the EU: DORA and NIS 2 Directive's Global ImpactBeyond the EU: DORA and NIS 2 Directive's Global Impact
Beyond the EU: DORA and NIS 2 Directive's Global Impact
 
CARE OF CHILD IN INCUBATOR..........pptx
CARE OF CHILD IN INCUBATOR..........pptxCARE OF CHILD IN INCUBATOR..........pptx
CARE OF CHILD IN INCUBATOR..........pptx
 
SOCIAL AND HISTORICAL CONTEXT - LFTVD.pptx
SOCIAL AND HISTORICAL CONTEXT - LFTVD.pptxSOCIAL AND HISTORICAL CONTEXT - LFTVD.pptx
SOCIAL AND HISTORICAL CONTEXT - LFTVD.pptx
 
Arihant handbook biology for class 11 .pdf
Arihant handbook biology for class 11 .pdfArihant handbook biology for class 11 .pdf
Arihant handbook biology for class 11 .pdf
 
Measures of Dispersion and Variability: Range, QD, AD and SD
Measures of Dispersion and Variability: Range, QD, AD and SDMeasures of Dispersion and Variability: Range, QD, AD and SD
Measures of Dispersion and Variability: Range, QD, AD and SD
 
INDIA QUIZ 2024 RLAC DELHI UNIVERSITY.pptx
INDIA QUIZ 2024 RLAC DELHI UNIVERSITY.pptxINDIA QUIZ 2024 RLAC DELHI UNIVERSITY.pptx
INDIA QUIZ 2024 RLAC DELHI UNIVERSITY.pptx
 
Advance Mobile Application Development class 07
Advance Mobile Application Development class 07Advance Mobile Application Development class 07
Advance Mobile Application Development class 07
 
POINT- BIOCHEMISTRY SEM 2 ENZYMES UNIT 5.pptx
POINT- BIOCHEMISTRY SEM 2 ENZYMES UNIT 5.pptxPOINT- BIOCHEMISTRY SEM 2 ENZYMES UNIT 5.pptx
POINT- BIOCHEMISTRY SEM 2 ENZYMES UNIT 5.pptx
 

Print18

  • 1. Excel 2007 Creating Pivot Tables Introduction Pivot Table Reports Watch the video! (10:41min) - Tips for watching our videos. Download the example to work along with the video. Why are They Named Pivot Tables? You may be wondering why it is called a pivot table. Basically, pivot tables allow you to pivot, or move, data so that you can produce answers to questions. Once you create a pivot table, you can very easily see what effect pivoting the data has on the spreadsheet information. To Create a Pivot Table Report (Part I): Š Select the cells in your spreadsheet that you want to use in the pivot table report. Š Select the Insert tab. Š Click the PivotTable command. Š Click PivotTable again. Excel selects cells in the actual spreadsheet and the Create PivotTable dialog box opens. » Select a table or range is already selected and the Table/Range field shows the range of the selected data. New Worksheet is also selected by default as the place where the report will be placed. Page 1 Pivot table reports, or pivot tables as they are often called, can help you answer questions about your spreadsheet by analyzing the numerical information in various ways. If you work with spreadsheets with a lot of data, pivot tables can be an extremely useful tool. Pivot table reports give you power because you can quickly find the answer to many different questions, and manipulate your data in many different ways. In this lesson, you will learn the basics of inserting and working with pivot table reports. Page 2 ©1998-2013 Goodwill Community Foundation, Inc. All rights reserved.
  • 2. Š Click Existing Worksheet and select a worksheet, if you do not want the pivot table to appear in a new worksheet. Š Click OK. Creating a Pivot Table Report If you use the sample spreadsheet to create a pivot table, you can see that the column headings are salesperson, region, account, order amount, and month. When you create a pivot table, each column label in your data becomes a field that can be used in the report. The Field List appears on the right side of the report, while the layout area appears on the left. Page 3 ©1998-2013 Goodwill Community Foundation, Inc. All rights reserved.
  • 3. To Create a Pivot Table Report (Part 2): Š Determine what question you want your pivot table report to answer. For example, using the sample spreadsheet, you might want to know which salesperson sold the greatest dollar amount. Š Determine the fields that are necessary to answer this question. In this example, salesperson and order amount. Š Select the check box next to the Salesperson field in the PivotTable Field List. The field will appear in the drag and drop area at the bottom of the field list and in the layout area. The order amount data appears on the right. This is a default setting in Excel – data with numbers will always appear on the right. Š Select the check box next to the Order Amount field in the PivotTable Field List. The field will appear in the drag and drop area at the bottom of the field list and in the layout area. All of the salesperson data appears on the left side as rows. Š You can now see the answer to your question in the report on the left. ©1998-2013 Goodwill Community Foundation, Inc. All rights reserved.
  • 4. To Add a Report Filter: Š Select a field in the Field List. In this example, choose Region. By default, it will appear in the Row Labels group. Š Click and drag Region into the Report Filter section. Š Release the mouse button. The region appears at the top of the report as a filter. Š The arrow by the Region fields shows (All). To show just the data for a specific region, click the drop-down arrow and select the region. To see multiple regions, click the Multiple Regions box, select the regions to display, and then, click OK. Moving, or Pivoting Data: Š Click and drag a field from one area to another. Š Release the mouse button to drop the field in the new area. In this example, we move Region from Report Page 4 ©1998-2013 Goodwill Community Foundation, Inc. All rights reserved.
  • 5. Filter to Column Label. The pivot table report will change. OR Š Right-click one of the rows. A menu will appear. Š Select Move and then select a move option. To Create a PivotChart Š Select the Pivot Chart command from the Options tab. The Insert Chart dialog box appears. ©1998-2013 Goodwill Community Foundation, Inc. All rights reserved.
  • 6. Š Select the chart you’d like to insert. Š Click OK. The chart will now appear on the same sheet as the Pivot Table. The information in the chart includes the information in the pivot table, rather than all the original source data. Challenge! Use the Company Sales workbook to complete this challenge. Page 5 Š Create a pivot table report that calculates the amount each salesperson sold. Š Filter the report by region. Š View the data for the salespeople in the North and West region. Š Who sold the greatest dollar amount in those two regions? ©1998-2013 Goodwill Community Foundation, Inc. All rights reserved.