SlideShare una empresa de Scribd logo
1 de 1
Descargar para leer sin conexión
Analysing	
  your	
  data	


       1. Make	
  sure	
  you	
  have	
  put	
  all	
  your	
  data	
  in	
  to	
  your	
  spreadsheet	
  
          You	
  need	
  to	
  have	
  included	
  at	
  least	
  15	
  sets	
  of	
  data	


       2. Use	
  a	
  variety	
  of	
  formulae/	
  functions	
  to	
  help	
  you	
  analyse	
  your	
  data	


       • =AVERAGE(Cells	
  you	
  want	
  to	
  average)	
  	
  Calculates	
  the	
  average	
  of	
  a	
  
          selection	
  of	
  cells	
  
       • =MIN(Cells	
  you	
  want	
  to	
  find	
  the	
  minimum	
  of)	
  Finds	
  the	
  minimum	
  number	
  
          in	
  a	
  selection	
  of	
  cells	
  
       • =MAX(Cells	
  you	
  want	
  to	
  find	
  the	
  maximum	
  of)	
  Finds	
  the	
  maximum	
  
          number	
  in	
  a	
  selection	
  of	
  cells	
  
       • =SUM(Cells	
  you	
  want	
  to	
  find	
  the	
  total	
  of)	
  Finds	
  the	
  total	
  of	
  a	
  set	
  of	
  
          numbers	
  
       • =COUNTIF(Cells	
  you	
  want	
  to	
  count,”Y”)	
  Counts	
  the	
  numbers	
  of	
  Ys	
  in	
  a	
  
          selection	
  of	
  cells,	
  you	
  can	
  get	
  it	
  to	
  count	
  whatever	
  your	
  want	
  by	
  changing	
  
          what	
  is	
  in	
  between	
  the	
  “”	


       3. Calculate	
  percentages	


          e.g	
  
       • Count	
  how	
  many	
  males	
  answered	
  your	
  questionnaire	
  
       • Divide	
  the	
  number	
  of	
  males	
  by	
  the	
  total	
  number	
  of	
  people	
  who	
  answered	
  
          your	
  questionnaire	
  
       • Format	
  your	
  result	
  to	
  a	
  percentage	
  using	
  the	
  percentage	
  button	
  
       What	
  other	
  percentages	
  could	
  you	
  calculate?	
  
       4. Create	
  some	
  graphs/charts	
  of	
  your	
  data	
  

            e.g.	
  	
  
       •    a	
  pie	
  chart	
  of	
  how	
  much	
  people	
  said	
  they	
  would	
  pay	
  
       •    a	
  bar	
  chart	
  of	
  what	
  people	
  want	
  to	
  see	


Más contenido relacionado

Similar a Analyse Data

An-Introduction-to-SPSS-Workshop-SessionV2-2.pptx
An-Introduction-to-SPSS-Workshop-SessionV2-2.pptxAn-Introduction-to-SPSS-Workshop-SessionV2-2.pptx
An-Introduction-to-SPSS-Workshop-SessionV2-2.pptxCharlou Bautista
 
statistical inference.pptx
statistical inference.pptxstatistical inference.pptx
statistical inference.pptxsuerie2
 
Data Collection & Analysis Educational Presentation in Pink and Blue Lined St...
Data Collection & Analysis Educational Presentation in Pink and Blue Lined St...Data Collection & Analysis Educational Presentation in Pink and Blue Lined St...
Data Collection & Analysis Educational Presentation in Pink and Blue Lined St...MalikQadeer8
 
New Microsoft PowerPoint Presentation.pptx
New Microsoft PowerPoint Presentation.pptxNew Microsoft PowerPoint Presentation.pptx
New Microsoft PowerPoint Presentation.pptxSamirkumar497189
 
Lecture 2 What is Statistics, Anyway
Lecture 2 What is Statistics, AnywayLecture 2 What is Statistics, Anyway
Lecture 2 What is Statistics, AnywayJason Edington
 
statics engineering mechanics slides.pdf
statics engineering mechanics slides.pdfstatics engineering mechanics slides.pdf
statics engineering mechanics slides.pdfAurangzebRashidMasud2
 
MS-EXCEL Assignment Help
MS-EXCEL Assignment HelpMS-EXCEL Assignment Help
MS-EXCEL Assignment HelpRahul Kataria
 
DATA ANALYTICS ASSIGNMENT.pptx
DATA ANALYTICS ASSIGNMENT.pptxDATA ANALYTICS ASSIGNMENT.pptx
DATA ANALYTICS ASSIGNMENT.pptxSamirkumar497189
 
PSUnit_IV_Lesson_1_Computing_the_Point_Estimate_of_a_Population_Mean.pptx
PSUnit_IV_Lesson_1_Computing_the_Point_Estimate_of_a_Population_Mean.pptxPSUnit_IV_Lesson_1_Computing_the_Point_Estimate_of_a_Population_Mean.pptx
PSUnit_IV_Lesson_1_Computing_the_Point_Estimate_of_a_Population_Mean.pptxErwin806347
 
L8 scientific visualization of data
L8 scientific visualization of dataL8 scientific visualization of data
L8 scientific visualization of dataSeppo Karrila
 
Software fundamentals
Software fundamentalsSoftware fundamentals
Software fundamentalsSusan Winters
 
How To Plan An Experiment
How To Plan An ExperimentHow To Plan An Experiment
How To Plan An Experimentshas595
 
Introduction - Using Stata
Introduction - Using StataIntroduction - Using Stata
Introduction - Using StataRyan Herzog
 

Similar a Analyse Data (20)

An-Introduction-to-SPSS-Workshop-SessionV2-2.pptx
An-Introduction-to-SPSS-Workshop-SessionV2-2.pptxAn-Introduction-to-SPSS-Workshop-SessionV2-2.pptx
An-Introduction-to-SPSS-Workshop-SessionV2-2.pptx
 
statistical inference.pptx
statistical inference.pptxstatistical inference.pptx
statistical inference.pptx
 
Data Collection & Analysis Educational Presentation in Pink and Blue Lined St...
Data Collection & Analysis Educational Presentation in Pink and Blue Lined St...Data Collection & Analysis Educational Presentation in Pink and Blue Lined St...
Data Collection & Analysis Educational Presentation in Pink and Blue Lined St...
 
New Microsoft PowerPoint Presentation.pptx
New Microsoft PowerPoint Presentation.pptxNew Microsoft PowerPoint Presentation.pptx
New Microsoft PowerPoint Presentation.pptx
 
Lecture 2 What is Statistics, Anyway
Lecture 2 What is Statistics, AnywayLecture 2 What is Statistics, Anyway
Lecture 2 What is Statistics, Anyway
 
Lec 3.pptx
Lec 3.pptxLec 3.pptx
Lec 3.pptx
 
Sampling
SamplingSampling
Sampling
 
Introduction to Descriptive Statistics
Introduction to Descriptive StatisticsIntroduction to Descriptive Statistics
Introduction to Descriptive Statistics
 
Spss (1)
Spss (1)Spss (1)
Spss (1)
 
Getting Started with R
Getting Started with RGetting Started with R
Getting Started with R
 
statics engineering mechanics slides.pdf
statics engineering mechanics slides.pdfstatics engineering mechanics slides.pdf
statics engineering mechanics slides.pdf
 
Organizing data
Organizing dataOrganizing data
Organizing data
 
MS-EXCEL Assignment Help
MS-EXCEL Assignment HelpMS-EXCEL Assignment Help
MS-EXCEL Assignment Help
 
DATA ANALYTICS ASSIGNMENT.pptx
DATA ANALYTICS ASSIGNMENT.pptxDATA ANALYTICS ASSIGNMENT.pptx
DATA ANALYTICS ASSIGNMENT.pptx
 
PSUnit_IV_Lesson_1_Computing_the_Point_Estimate_of_a_Population_Mean.pptx
PSUnit_IV_Lesson_1_Computing_the_Point_Estimate_of_a_Population_Mean.pptxPSUnit_IV_Lesson_1_Computing_the_Point_Estimate_of_a_Population_Mean.pptx
PSUnit_IV_Lesson_1_Computing_the_Point_Estimate_of_a_Population_Mean.pptx
 
L8 scientific visualization of data
L8 scientific visualization of dataL8 scientific visualization of data
L8 scientific visualization of data
 
1628 statistics
1628 statistics1628 statistics
1628 statistics
 
Software fundamentals
Software fundamentalsSoftware fundamentals
Software fundamentals
 
How To Plan An Experiment
How To Plan An ExperimentHow To Plan An Experiment
How To Plan An Experiment
 
Introduction - Using Stata
Introduction - Using StataIntroduction - Using Stata
Introduction - Using Stata
 

Último

How to convert PDF to text with Nanonets
How to convert PDF to text with NanonetsHow to convert PDF to text with Nanonets
How to convert PDF to text with Nanonetsnaman860154
 
How to Troubleshoot Apps for the Modern Connected Worker
How to Troubleshoot Apps for the Modern Connected WorkerHow to Troubleshoot Apps for the Modern Connected Worker
How to Troubleshoot Apps for the Modern Connected WorkerThousandEyes
 
08448380779 Call Girls In Greater Kailash - I Women Seeking Men
08448380779 Call Girls In Greater Kailash - I Women Seeking Men08448380779 Call Girls In Greater Kailash - I Women Seeking Men
08448380779 Call Girls In Greater Kailash - I Women Seeking MenDelhi Call girls
 
Integration and Automation in Practice: CI/CD in Mule Integration and Automat...
Integration and Automation in Practice: CI/CD in Mule Integration and Automat...Integration and Automation in Practice: CI/CD in Mule Integration and Automat...
Integration and Automation in Practice: CI/CD in Mule Integration and Automat...Patryk Bandurski
 
Presentation on how to chat with PDF using ChatGPT code interpreter
Presentation on how to chat with PDF using ChatGPT code interpreterPresentation on how to chat with PDF using ChatGPT code interpreter
Presentation on how to chat with PDF using ChatGPT code interpreternaman860154
 
Pigging Solutions in Pet Food Manufacturing
Pigging Solutions in Pet Food ManufacturingPigging Solutions in Pet Food Manufacturing
Pigging Solutions in Pet Food ManufacturingPigging Solutions
 
Azure Monitor & Application Insight to monitor Infrastructure & Application
Azure Monitor & Application Insight to monitor Infrastructure & ApplicationAzure Monitor & Application Insight to monitor Infrastructure & Application
Azure Monitor & Application Insight to monitor Infrastructure & ApplicationAndikSusilo4
 
Neo4j - How KGs are shaping the future of Generative AI at AWS Summit London ...
Neo4j - How KGs are shaping the future of Generative AI at AWS Summit London ...Neo4j - How KGs are shaping the future of Generative AI at AWS Summit London ...
Neo4j - How KGs are shaping the future of Generative AI at AWS Summit London ...Neo4j
 
Understanding the Laravel MVC Architecture
Understanding the Laravel MVC ArchitectureUnderstanding the Laravel MVC Architecture
Understanding the Laravel MVC ArchitecturePixlogix Infotech
 
Key Features Of Token Development (1).pptx
Key  Features Of Token  Development (1).pptxKey  Features Of Token  Development (1).pptx
Key Features Of Token Development (1).pptxLBM Solutions
 
A Domino Admins Adventures (Engage 2024)
A Domino Admins Adventures (Engage 2024)A Domino Admins Adventures (Engage 2024)
A Domino Admins Adventures (Engage 2024)Gabriella Davis
 
The 7 Things I Know About Cyber Security After 25 Years | April 2024
The 7 Things I Know About Cyber Security After 25 Years | April 2024The 7 Things I Know About Cyber Security After 25 Years | April 2024
The 7 Things I Know About Cyber Security After 25 Years | April 2024Rafal Los
 
Maximizing Board Effectiveness 2024 Webinar.pptx
Maximizing Board Effectiveness 2024 Webinar.pptxMaximizing Board Effectiveness 2024 Webinar.pptx
Maximizing Board Effectiveness 2024 Webinar.pptxOnBoard
 
Beyond Boundaries: Leveraging No-Code Solutions for Industry Innovation
Beyond Boundaries: Leveraging No-Code Solutions for Industry InnovationBeyond Boundaries: Leveraging No-Code Solutions for Industry Innovation
Beyond Boundaries: Leveraging No-Code Solutions for Industry InnovationSafe Software
 
Factors to Consider When Choosing Accounts Payable Services Providers.pptx
Factors to Consider When Choosing Accounts Payable Services Providers.pptxFactors to Consider When Choosing Accounts Payable Services Providers.pptx
Factors to Consider When Choosing Accounts Payable Services Providers.pptxKatpro Technologies
 
SQL Database Design For Developers at php[tek] 2024
SQL Database Design For Developers at php[tek] 2024SQL Database Design For Developers at php[tek] 2024
SQL Database Design For Developers at php[tek] 2024Scott Keck-Warren
 
Swan(sea) Song – personal research during my six years at Swansea ... and bey...
Swan(sea) Song – personal research during my six years at Swansea ... and bey...Swan(sea) Song – personal research during my six years at Swansea ... and bey...
Swan(sea) Song – personal research during my six years at Swansea ... and bey...Alan Dix
 
Transforming Data Streams with Kafka Connect: An Introduction to Single Messa...
Transforming Data Streams with Kafka Connect: An Introduction to Single Messa...Transforming Data Streams with Kafka Connect: An Introduction to Single Messa...
Transforming Data Streams with Kafka Connect: An Introduction to Single Messa...HostedbyConfluent
 
04-2024-HHUG-Sales-and-Marketing-Alignment.pptx
04-2024-HHUG-Sales-and-Marketing-Alignment.pptx04-2024-HHUG-Sales-and-Marketing-Alignment.pptx
04-2024-HHUG-Sales-and-Marketing-Alignment.pptxHampshireHUG
 
Injustice - Developers Among Us (SciFiDevCon 2024)
Injustice - Developers Among Us (SciFiDevCon 2024)Injustice - Developers Among Us (SciFiDevCon 2024)
Injustice - Developers Among Us (SciFiDevCon 2024)Allon Mureinik
 

Último (20)

How to convert PDF to text with Nanonets
How to convert PDF to text with NanonetsHow to convert PDF to text with Nanonets
How to convert PDF to text with Nanonets
 
How to Troubleshoot Apps for the Modern Connected Worker
How to Troubleshoot Apps for the Modern Connected WorkerHow to Troubleshoot Apps for the Modern Connected Worker
How to Troubleshoot Apps for the Modern Connected Worker
 
08448380779 Call Girls In Greater Kailash - I Women Seeking Men
08448380779 Call Girls In Greater Kailash - I Women Seeking Men08448380779 Call Girls In Greater Kailash - I Women Seeking Men
08448380779 Call Girls In Greater Kailash - I Women Seeking Men
 
Integration and Automation in Practice: CI/CD in Mule Integration and Automat...
Integration and Automation in Practice: CI/CD in Mule Integration and Automat...Integration and Automation in Practice: CI/CD in Mule Integration and Automat...
Integration and Automation in Practice: CI/CD in Mule Integration and Automat...
 
Presentation on how to chat with PDF using ChatGPT code interpreter
Presentation on how to chat with PDF using ChatGPT code interpreterPresentation on how to chat with PDF using ChatGPT code interpreter
Presentation on how to chat with PDF using ChatGPT code interpreter
 
Pigging Solutions in Pet Food Manufacturing
Pigging Solutions in Pet Food ManufacturingPigging Solutions in Pet Food Manufacturing
Pigging Solutions in Pet Food Manufacturing
 
Azure Monitor & Application Insight to monitor Infrastructure & Application
Azure Monitor & Application Insight to monitor Infrastructure & ApplicationAzure Monitor & Application Insight to monitor Infrastructure & Application
Azure Monitor & Application Insight to monitor Infrastructure & Application
 
Neo4j - How KGs are shaping the future of Generative AI at AWS Summit London ...
Neo4j - How KGs are shaping the future of Generative AI at AWS Summit London ...Neo4j - How KGs are shaping the future of Generative AI at AWS Summit London ...
Neo4j - How KGs are shaping the future of Generative AI at AWS Summit London ...
 
Understanding the Laravel MVC Architecture
Understanding the Laravel MVC ArchitectureUnderstanding the Laravel MVC Architecture
Understanding the Laravel MVC Architecture
 
Key Features Of Token Development (1).pptx
Key  Features Of Token  Development (1).pptxKey  Features Of Token  Development (1).pptx
Key Features Of Token Development (1).pptx
 
A Domino Admins Adventures (Engage 2024)
A Domino Admins Adventures (Engage 2024)A Domino Admins Adventures (Engage 2024)
A Domino Admins Adventures (Engage 2024)
 
The 7 Things I Know About Cyber Security After 25 Years | April 2024
The 7 Things I Know About Cyber Security After 25 Years | April 2024The 7 Things I Know About Cyber Security After 25 Years | April 2024
The 7 Things I Know About Cyber Security After 25 Years | April 2024
 
Maximizing Board Effectiveness 2024 Webinar.pptx
Maximizing Board Effectiveness 2024 Webinar.pptxMaximizing Board Effectiveness 2024 Webinar.pptx
Maximizing Board Effectiveness 2024 Webinar.pptx
 
Beyond Boundaries: Leveraging No-Code Solutions for Industry Innovation
Beyond Boundaries: Leveraging No-Code Solutions for Industry InnovationBeyond Boundaries: Leveraging No-Code Solutions for Industry Innovation
Beyond Boundaries: Leveraging No-Code Solutions for Industry Innovation
 
Factors to Consider When Choosing Accounts Payable Services Providers.pptx
Factors to Consider When Choosing Accounts Payable Services Providers.pptxFactors to Consider When Choosing Accounts Payable Services Providers.pptx
Factors to Consider When Choosing Accounts Payable Services Providers.pptx
 
SQL Database Design For Developers at php[tek] 2024
SQL Database Design For Developers at php[tek] 2024SQL Database Design For Developers at php[tek] 2024
SQL Database Design For Developers at php[tek] 2024
 
Swan(sea) Song – personal research during my six years at Swansea ... and bey...
Swan(sea) Song – personal research during my six years at Swansea ... and bey...Swan(sea) Song – personal research during my six years at Swansea ... and bey...
Swan(sea) Song – personal research during my six years at Swansea ... and bey...
 
Transforming Data Streams with Kafka Connect: An Introduction to Single Messa...
Transforming Data Streams with Kafka Connect: An Introduction to Single Messa...Transforming Data Streams with Kafka Connect: An Introduction to Single Messa...
Transforming Data Streams with Kafka Connect: An Introduction to Single Messa...
 
04-2024-HHUG-Sales-and-Marketing-Alignment.pptx
04-2024-HHUG-Sales-and-Marketing-Alignment.pptx04-2024-HHUG-Sales-and-Marketing-Alignment.pptx
04-2024-HHUG-Sales-and-Marketing-Alignment.pptx
 
Injustice - Developers Among Us (SciFiDevCon 2024)
Injustice - Developers Among Us (SciFiDevCon 2024)Injustice - Developers Among Us (SciFiDevCon 2024)
Injustice - Developers Among Us (SciFiDevCon 2024)
 

Analyse Data

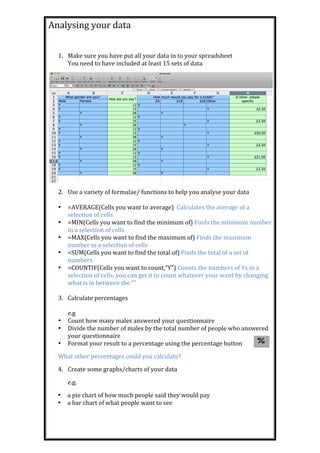
  • 1. Analysing  your  data     1. Make  sure  you  have  put  all  your  data  in  to  your  spreadsheet   You  need  to  have  included  at  least  15  sets  of  data     2. Use  a  variety  of  formulae/  functions  to  help  you  analyse  your  data     • =AVERAGE(Cells  you  want  to  average)    Calculates  the  average  of  a   selection  of  cells   • =MIN(Cells  you  want  to  find  the  minimum  of)  Finds  the  minimum  number   in  a  selection  of  cells   • =MAX(Cells  you  want  to  find  the  maximum  of)  Finds  the  maximum   number  in  a  selection  of  cells   • =SUM(Cells  you  want  to  find  the  total  of)  Finds  the  total  of  a  set  of   numbers   • =COUNTIF(Cells  you  want  to  count,”Y”)  Counts  the  numbers  of  Ys  in  a   selection  of  cells,  you  can  get  it  to  count  whatever  your  want  by  changing   what  is  in  between  the  “”     3. Calculate  percentages     e.g   • Count  how  many  males  answered  your  questionnaire   • Divide  the  number  of  males  by  the  total  number  of  people  who  answered   your  questionnaire   • Format  your  result  to  a  percentage  using  the  percentage  button   What  other  percentages  could  you  calculate?   4. Create  some  graphs/charts  of  your  data   e.g.     • a  pie  chart  of  how  much  people  said  they  would  pay   • a  bar  chart  of  what  people  want  to  see