eubiologics 206650 Algorithm Investment Report
•
1 recomendación•100 vistas

This document provides a summary of financial performance and stock price analysis for an algorithm company over several periods from 2017-2021. It includes tables with metrics like sales, operating profit, net income, debt ratios, and stock prices. A section analyzes the company's stock price rise probability and compares it to sector averages. It suggests a prospective purchase amount based on the current stock price being very low compared to the indication price range.
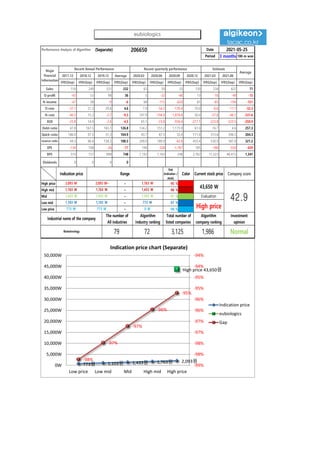
![[Price for scheduled purchasing]
Arbitrarily made
Algorithm stocks Trading Strategies (Separate) 206650 Date
Period
Gap
(Indication /
stock)
Color
low price 773 W 773 W ~ 0 W -98 % 621,061 W 803
Low mid 1,103 W 1,103 W ~ 773 W -97 % 616,280 W 559
Mid 1,433 W 1,433 W ~ 1,103 W -97 % 611,499 W 427
High mid 1,763 W 1,763 W ~ 1,433 W -96 % 606,718 W 344
Suggested Purchase
Amount 632,260 W
Number of stocks
purchased 14
Indication price Range Buying / Selling Buying / Selling [Stocks]
High price 2,093 W 2,093 W~ ~ 1,763 W -95 % 601,937 W 288
2021-05-25
3 months
Current stock price Evaluation
Stock price rise
probability score
Investment opinion Prospective purchase amount
43,650 W High price 45.5 Normal 2,500,000 W
Stock price rise
probability score
A Sector 53.2 50.1 42.3 51.6 45.0 51.4
45.5
B Sector 15.8 45.4 51.6 51.6 29.6 27.9
Total average 34.5 47.8 34.1 21.7 37.3 39.7
2020.12.23 2021.01.25 2021.02.24 2021.03.25 2021.04.22 2021.05.24
2021.02.24 2021.03.25 2021.04.22 2021.05.24
Total of
increase rate
Total score
A Sector -6 % -18 % 18 % -15 % 12 %
-4 % 45.7
B Sector 65 % -76 % 50 % -74 % -6 %
Total average 28 % -40 % -57 % 42 % 6 %
2021.01.25
-6%
-18%
18%
-15%
12%
65%
-76%
50%
-74%
-6%
28%
-40%
-57%
42%
6%
-100%
-80%
-60%
-40%
-20%
0%
20%
40%
60%
80%
2021.01.25 2021.02.24 2021.03.25 2021.04.22 2021.05.24
Increase rate of stock price rise
A sector
B sector
Total average
eubiologics
53
50
42
52
45
51
16
45
26
52
30 28
34
48
34
22
37 40
0
10
20
30
40
50
60
2020.12.23 2021.01.25 2021.02.24 2021.03.25 2021.04.22 2021.05.24
Stock price rise probability score
A sector
B sector
Total average](data:image/gif;base64,R0lGODlhAQABAIAAAAAAAP///yH5BAEAAAAALAAAAAABAAEAAAIBRAA7)
Recomendados
Recomendados
Más contenido relacionado
La actualidad más candente
La actualidad más candente (20)
Similar a eubiologics 206650 Algorithm Investment Report
Similar a eubiologics 206650 Algorithm Investment Report (20)
Más de 알고리즘 기업분석 컨설팅-알기컨,algikeon
Más de 알고리즘 기업분석 컨설팅-알기컨,algikeon (20)
Último
Último (20)
eubiologics 206650 Algorithm Investment Report
- 1. Performance Analysis of Algorithm (Separate) 206650 Date Period 3 months 100-m won 2017.12 2018.12 2019.12 Average 2020.03 2020.06 2020.09 2020.12 2021.03 2021.06 IFRS(Sep) IFRS(Sep) IFRS(Sep) IFRS(Sep) IFRS(Sep) IFRS(Sep) IFRS(Sep) IFRS(Sep) IFRS(Sep) IFRS(Sep) IFRS(Sep) Sales 116 249 331 232 63 59 33 130 234 422 71 O-profit -43 53 98 36 5 -32 -46 13 -16 -49 -15 N-income -47 38 -9 -6 68 -115 -620 65 -65 -194 -151 O-rate -37.1 21.3 29.6 4.6 7.9 -54.2 -139.4 10.0 -6.6 -11.7 -32.3 N-rate -40.5 15.3 -2.7 -9.3 107.9 -194.9 -1,878.8 50.0 -27.8 -46.1 -331.6 ROE -25.8 14.9 -2.6 -4.5 65.1 -23.8 -936.4 -217.1 -223.8 -223.5 -259.9 Debt-ratio 47.8 167.5 165.1 126.8 134.2 151.2 1,175.9 61.0 16.7 4.6 257.3 Quick-ratio 186.0 97.5 31.3 104.9 43.7 67.5 33.4 171.0 313.6 596.5 204.3 reserve-ratio 44.3 98.4 158.2 100.3 209.0 189.9 -42.8 453.4 530.9 587.0 321.2 EPS -134 108 -26 -17 194 -328 -1,767 185 -186 -554 -429 BPS 519 727 998 748 1,192 1,163 248 2,762 11,323 46,415 1,341 Dividends 0 0 0 0 2021-05-25 Major Financial Information Recent Annual Performance Recent quarterly performance Estimate Average Gap (Indication / stock) Color High price ~ -95 % High mid ~ -96 % Mid ~ -97 % Low mid ~ -97 % Low price ~ -98 % Normal 773 W 773 W 0 W Industrial name of the company The number of All industries Algorithm Industry ranking Total number of listed companies Algorithm company ranking Investment opinion Biotechnology 79 72 3,125 1,986 1,763 W 1,763 W 1,433 W 1,433 W 1,433 W 1,103 W Evaluation 2,093 W 2,093 W~ 1,763 W 43,650 W 42.9 1,103 W 1,103 W 773 W High price Indication price Range Current stock price Company score 773원 1,103원 1,433원 1,763원 2,093원 High price 43,650원 -98% -97% -97% -96% -95% -99% -98% -98% -97% -97% -96% -96% -95% -95% -94% -94% 0W 5,000W 10,000W 15,000W 20,000W 25,000W 30,000W 35,000W 40,000W 45,000W 50,000W Low price Low mid Mid High mid High price Indication price chart (Separate) Indication price eubiologics Gap eubiologics
- 2. [Price for scheduled purchasing] Arbitrarily made Algorithm stocks Trading Strategies (Separate) 206650 Date Period Gap (Indication / stock) Color low price 773 W 773 W ~ 0 W -98 % 621,061 W 803 Low mid 1,103 W 1,103 W ~ 773 W -97 % 616,280 W 559 Mid 1,433 W 1,433 W ~ 1,103 W -97 % 611,499 W 427 High mid 1,763 W 1,763 W ~ 1,433 W -96 % 606,718 W 344 Suggested Purchase Amount 632,260 W Number of stocks purchased 14 Indication price Range Buying / Selling Buying / Selling [Stocks] High price 2,093 W 2,093 W~ ~ 1,763 W -95 % 601,937 W 288 2021-05-25 3 months Current stock price Evaluation Stock price rise probability score Investment opinion Prospective purchase amount 43,650 W High price 45.5 Normal 2,500,000 W Stock price rise probability score A Sector 53.2 50.1 42.3 51.6 45.0 51.4 45.5 B Sector 15.8 45.4 51.6 51.6 29.6 27.9 Total average 34.5 47.8 34.1 21.7 37.3 39.7 2020.12.23 2021.01.25 2021.02.24 2021.03.25 2021.04.22 2021.05.24 2021.02.24 2021.03.25 2021.04.22 2021.05.24 Total of increase rate Total score A Sector -6 % -18 % 18 % -15 % 12 % -4 % 45.7 B Sector 65 % -76 % 50 % -74 % -6 % Total average 28 % -40 % -57 % 42 % 6 % 2021.01.25 -6% -18% 18% -15% 12% 65% -76% 50% -74% -6% 28% -40% -57% 42% 6% -100% -80% -60% -40% -20% 0% 20% 40% 60% 80% 2021.01.25 2021.02.24 2021.03.25 2021.04.22 2021.05.24 Increase rate of stock price rise A sector B sector Total average eubiologics 53 50 42 52 45 51 16 45 26 52 30 28 34 48 34 22 37 40 0 10 20 30 40 50 60 2020.12.23 2021.01.25 2021.02.24 2021.03.25 2021.04.22 2021.05.24 Stock price rise probability score A sector B sector Total average
- 3. may ded by Compliance notice ① The information provided by The Algorithm Company Analysis Consulting is obtained through reliable data and information and The Algorithm Company Analysis Program (TACAP), but its accuracy or completeness are not guaranteed. Furthermore, it may change over time.Therefore, we are not legally responsible for the results of the data provided by The Algorithm Company Analysis Consulting because of information errors or omissions. ② The Algorithm Company Analysis Consulting and all the information provided on it site are reference materials for investment decisions and the final responsibility of investment is up to users utilizing this information. ③ The Algorithm Company Analysis Consulting and its site do not do anything that violates the related laws such as discretionary transaction. ④ Users can not reallocate and recycle the information provided by The Algorithm Company Analysis Consulting firm let alone the information provided by its Site. ⑤ Be sure to know about application period of this algorithm analysis report in order to improve its accuracy. Tel : 070 - 4667 - 5009 Email : tacac@tacac.co.kr Homepage : tacac.co.kr Blog : tacac.blog.me SERVICES M&A, IPO, RECOVER, CORPORATE RESTRUCTURING, MANAGEMENT OF TECHNOLOGY, BUSINESS STRATEGY, FAMILY BUSINESS Request : http://tacac.co.kr/?page_id=1374