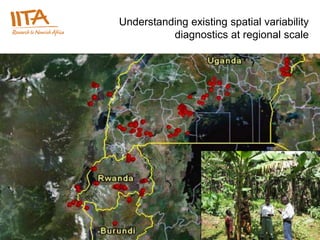
Understanding existing spatial variability diagnostics at regional scale
•
1 recomendación•469 vistas

Understanding existing spatial variability diagnostics at: regional,village and farm scale.Understanding existing cropping systems,Testing the hypotheses in the field

Recomendados
Recomendados
Más contenido relacionado
Destacado
Destacado (10)
Más de International Institute of Tropical Agriculture
Más de International Institute of Tropical Agriculture (20)
Último
Último (20)
Understanding existing spatial variability diagnostics at regional scale
- 1. Understanding existing spatial variability diagnostics at regional scale International Institute of Tropical Agriculture – Institut international d’agriculture tropicale – www.iita.org
- 2. Understanding existing spatial variability diagnostics at regional scale 70 60 Yield t ha -1 cycle -1 50 40 30 20 10 0 Uganda Rwanda Burundi North Kivu South Kivu Sites (n) 9 5 5 4 4 Farms (n) 84 128 147 120 120 Cycle = the period between subsequent harvests from a single mat. This value is around 1 year at 1200 m.a.s.l. but increases with altitude Sites = nr. of districts (Uganda) or villages (Rwanda, Burundi, North Kivu, South Kivu) The top and bottom of the error bars represent the maximum and minimum site average yield per region/country International Institute of Tropical Agriculture – Institut international d’agriculture tropicale – www.iita.org
- 3. Understanding existing spatial variability from Lake Victoria basin to Albertine rift East Rwanda Rusizi East Burundi Kivu Semliki SW Uganda Region Central Uganda 25 t/ha/cycle 45 t/ha/cycle 15 t/ha/cycle 1600- 2100m 1100m 1300-1400m Rainfall Pest and disease pressure Soil fertility Plant densities International Institute of Tropical Agriculture – Institut international d’agriculture tropicale – www.iita.org
- 4. Understanding existing spatial variability diagnostics at regional scale 5.0 Drought major constraint <1200 mm/yr 4.5 Soil fertility highly variable, but generally better near Albertine rift 4.0 High foliar K conc = high productive sites 3.5 Pest pressure low > 1300m BBTV and BXW ‘restricted’ to hotspots 3.0 K (% of dry matter) Conclusion: abiotic stresses very important 2.5 2.0 Cy oke 1.5 Ka ga-2 R G an G ga-1u Ci ale Ki Ki N Bu Lu i Ki ung M ala Lu nd uh Kbam an ite g Bi ite ru bo b ze bu o un al b rh rh ng hi o- an t ng iva a ye ol h o go a i International Institute of Tropical Agriculture – Institut international d’agriculture tropicale – www.iita.org
- 5. Yield gap analysis in Uganda International Institute of Tropical Agriculture – Institut international d’agriculture tropicale – www.iita.org
- 6. Understanding existing spatial variability diagnostics at village scale Poor Medium Rich ‘Poor’ versus ‘Rich’ farmers: Number of farms 17 28 5 • Yields Banana performance Bunch weight 16.2b 16.4b 20.1a • Arable land Average spacing (m) 2.2 2.3 2.2 • Hired labor Land, livestock, and labor • Livestock Tot. arable land (ha) 0.32b* 0.48b 0.55a • External revenues % land und. banana 70 70 70 • Commercialization Hired labor (man/day) 0.5b 0.8b 3.2a Cows (nr) 0.77 2.2 3.0 Conclusion: Soil Org Carbon (%) 1.3 1.3 1.4 Large differences in access Weevil damage (XT %) 4.0 5.4 4.4 to resources → technology Income sources choice Earning salary % 0b 4b 40a Ext. financial sup. % 24b 50ab 80a PhD thesis ongoing on farmer % farms selling ban. 47b 75a 100a innovation in GL region *Letters behind numbers in the same row indicate significant differences (p<0.1) International Institute of Tropical Agriculture – Institut international d’agriculture tropicale – www.iita.org
- 7. Understanding existing spatial variability diagnostics at farm scale Delstanche, van Asten, Gaidashova, Delvaux – Eurosoil conference MSc thesis I.A. Newton Most still needs to be published International Institute of Tropical Agriculture – Institut international d’agriculture tropicale – www.iita.org
- 8. Understanding existing temporal variability on-farm monitoring study in SW Uganda 150 plants - 10 farms - 2 years • Peak production May – Oct → prices are low • Low production Nov – Feb → prices are high Sucker emergence → Harvest date • Give preference to suckers emerged in Q1 over those that emerged in Q4 • Farmers prefer desuckering in Dec-Jan, but they should then leave the smallest, not the biggest suckers Got Matooke for Christmas → Birabwa, van Asten, Newton, Taulya, Mombasa presentation – to submit to Act Hort International Institute of Tropical Agriculture – Institut international d’agriculture tropicale – www.iita.org
- 9. Understanding existing cropping systems Comparing banana-coffee mono and intercrop APEP-funded project 300 farmer fields in Uganda • Bananas do not reduce (<13%) coffee yields, but Robusta banana yields • Banana intercrop generates + 700 $/ha/yr in Robusta + 1900 $/ha/yr in Arabica PhD research on banana-coffee systems has started in Burundi under CIALCA-II van Asten, Mukasa, Uringi poster Mombasa – Act Hort, to be submitted R4D review feature story International Institute of Tropical Agriculture – Institut international d’agriculture tropicale – www.iita.org
- 10. Cycle 1 Cycle 2 Cycle 3 Pushing system components to their boundaries A 90 A 75 2005 - 1034mm 2006 - 1334mm 2007 - 1633mm Drought trials 60 45 30 15 Pot trials 0 Sept 2004 Mar 2005 Sept 2005 Mar 2006 Sept 2006 Mar 2007 Sept 2007 Rainfall (mm) a. Four cultivars (AAA-EA, AAA, ABB, AB) Cycle 1 Cycle 2 b. Three moisture treatments B 90 2005 - 1206mm 75 pF 1.8 – 2.1 2006 - 1380mm no stress: 60 2007 - 935mm 45 moderate stress: pF 2.5 – 2.7 30 pF 2.8 – 2.9 15 strong stress: 0 Dec 2004 June 2005 Dec 2005 June 2006 Dec 2006 June 2007 Dec 2007 c. Measure stress (e.g. stomatal conductance) C Saturation (pF 0) Field capacity (pF 2) Wilting point (pF 4.2) 0-30 cm 30-60 cm 60-90 cm 0.45 c. Determine water use efficiency 0.35 d. Use findings to validate field results Volumetric moisture content (m 3 m-3) 0.25 0.15 Interim results: bananas don't look stressed 0.05 April 2005 Nov 2005 June 2006 Dec 2006 July 2007 when they actually are! D Saturation (pF 0) Field capacity (pF 2) Wilting point (pF 4.2) 0-30 cm 30-60 cm 60-90 cm 0.45 Planning field trial in CIALCA-II project 0.35 0.25 Results from the above not published thus far 0.15 Field trial results - Nyombi et al (PhD reseach) in 2009 0.05 June 2005 Jan 2006 Aug 2006 Feb 2007 Sept 2007 International Institute of Tropical Agriculture – Institut international d’agriculture tropicale – www.iita.org
- 11. Testing the hypotheses in the field Nutrient omission trials 8000 1. Setup Banana finger biomass (kg ha -1) a. Central and Southwest Uganda b. N, P, K, Mg, Zn, S, B, Mo 6000 c. Target yield 50 t/ha/yr 4000 2. Preliminary findings after 2-3 cycles a. K is most deficient 2000 b. Fertilized yields poor (< 30 t/ha/yr) 0N-0P-0K 0N-50P-600K 150N-50P-600K 400N-0P-600K c. Drought stress is a major problem 400N-50P-0K 400N-50P-600K 400N-50P-250K Max dillution Max concentration d. Ferralsols soils → poor root systems 0 0 200 400 600 800 e. Fertilizer improves sensory quality K uptake (kg ha-1) 0 6.0 FULL 5.5 Rooting depth (cm) 5.0 4.5 4.0 -50 3.5 3.0 2.5 2.0 1.5 -100 1.0 0.5 0.0 -150 -100 -50 0 50 100 150 Horizontal distance from center of pseudostem -K (cm) Nyombi, van Asten, et al.: Draft ready → submit Feb 2009 Taulya, van Asten, et al: Global plant sci book - submittedAgriculture – Institut international d’agriculture tropicale – www.iita.org International Institute of Tropical
- 12. Testing the hypotheses in the field Optimal mulch thickness On-station trial at ISAR, Rwanda 1. 0 cm mulch 2. 5 cm mulch 3. 10 cm mulch 4. 20 cm mulch With and without shading 30 Soil Moisture Conten (Vol %) Soil moisture monitoring → 5 cm already very effective 20 Mulch rates Soil chemical properties 0 cm 1.00 → improvement proportional to application 10 5 cm 2.00 10 cm 3.00 Van Asten, Twagirayezu, Gaidashova 0 20 cm 4.00 Rwanda Agricultural Conference 1 2 3 5 6 7 8 9 10 11 12 Presentation and paper, 2007. Week Number (1 = 9 Sept) International Institute of Tropical Agriculture – Institut international d’agriculture tropicale – www.iita.org
- 13. Testing the hypotheses in the field Mulch and zero-tillage trials Setup in CIALCA project 8 researcher-managed trials in Rwanda, Burundi, and DRC 1. Mulch removal + tillage 2. Self-mulch + no-till 3. Trypsacum + no-till 4. Hyparrhenia + no-till All intercropped with bush beans Objectives • Impact on nutrient stocks and flows PhD thesis Syldie Bizimana (ISABU - Burundi) • Impact on soil physics and root systems PhD thesis Tony Muliele (INERA - DR Congo) • Impact on banana + bean crop performance MSc thesis Agnes Mukdandida (ISAR- Rwanda) International Institute of Tropical Agriculture – Institut international d’agriculture tropicale – www.iita.org
- 14. Testing the hypotheses in the field other field and lab trials Planting density trials in Rwanda • from 1000 – 5000 plants/ha • 3 different cultivars • 3 contrasting agro-ecologies • compare with farmer practices PhD thesis Telesphore Ndabamenye (ISAR-Rwanda) CIALCA-Bioversity sponsored Abuscular Mychorrizal Fungi (AMF) • On-farm diagnostics and pot trials Rwanda • Diagnostics and field trial in Kenya, Uganda Mulch x Nematode trial in Rwanda • Establish yield loss due to P. Goodeyi PhD thesis Svetlana Gaidashova (ISAR-Rwanda) Collaboration in Kenya with TSBF AMF research presented in Mombasa conference Paper on AMF on-farm diagnostics to be submitted International Institute of Tropical Agriculture – Institut international d’agriculture tropicale – www.iita.org
- 15. Crop growth and nutrient response models Ugandan potential yield – 112 t/ha/yr Crop growth model based on: A 1. Light interception and L.U.E. 2. Temperature sum and biomass partitioning 3. Water limited yield 4. Nutrient (N, P, K) limited yield (QUEFTS) PhD research of Kenneth Nyombi (Wageningen University) + B = C DTR dDLAI/dt LAI DAvtmp RAIN PARINT dGLAI/dt EVAPO RNINTC KDF TRANRF SLA WATER RN PTRAN W lv, g W lv,d TRAN Tsum EXPLOR (dW/dt) lv,d (dW/dt) lv dTsum/dt dW/dt W st (dW/dt) st LUE Tbase DRAIN W rt W rt,d (dW/dt) rt,d (dW/dt) rt W co (dW/dt) co W su (dW/dt) su W bu (dW/dt) bu International Institute of Tropical Agriculture – Institut international d’agriculture tropicale – www.iita.org
- 16. On-farm testing of best-bet technologies the APEP project APEP demo plots Uganda matooke farm gate bunch price • application of blanket NPK fertilizer 300 • 94 demos versus 84 control Bunch price (USH/kg) • Demos yield 25 – 100% 200 • MRR > 500% close to Kampala 100 • MRR < 100% beyond Masaka 0 Conclusion: 0 50 100 150 200 250 300 350 Distance to Kam pala Fertilizer only profitable near Kampala New fertilizer recommendations Banana and Coffee taking into account • nutrient deficiencies (= region) • target yield (= resource availability) Van Asten et al., APEP final technical report Wairegi, van Asten, et al. AFNET conference paper Van Asten et al., Mombasa presentation, Act Hort International Institute of Tropical Agriculture – Institut international d’agriculture tropicale – www.iita.org
- 17. Understanding existing cropping systems Comparing banana-coffee mono and intercrop APEP-funded project 300 farmer fields in Uganda • Bananas do not reduce (<13%) coffee yields, but Robusta banana yields • Banana intercrop generates + 700 $/ha/yr in Robusta + 1900 $/ha/yr in Arabica PhD research on banana-coffee systems has started in Burundi under CIALCA-II van Asten, Mukasa, Uringi poster Mombasa – Act Hort, to be submitted R4D review feature story International Institute of Tropical Agriculture – Institut international d’agriculture tropicale – www.iita.org
- 18. Projected banana-coffee work Capacity development Output 4 Partnerships & training materials Capacity & Scientific synergies synergies Output 1 Output 2 Output 3 Crop physiology Agronomy Socio-economics Effect of banana shade under Identify and test improved soil Strengthen coffee-value chain different levels of water and and water management through: nutrient stress on: technologies Determinants for investments Coffee yield (quantity, quality) Identify drivers of productivity Access to input markets Photosynthetic capacity Map nutrient deficiencies Output markets (niches) Pest & disease pressure Participatory testing Organisational structures Trade-off analysis Cost-benefit analysis Plant arrangement Improved soil and Empowerment of Strengthening recommendations water practices coffee-value chain coffee actors organ plant field farm farm organisation market IITA NARO AIT IFPRI Figure 2: Relational diagram showing the relationship between the research conducted for the four outputs, the spatial level that the research activities primarily target, and the technical backstopping domains of the project research partners. International Institute of Tropical Agriculture – Institut international d’agriculture tropicale – www.iita.org