Analysis of the economic performance of peri-urban and rural smallholder pig producer enterprises in Masaka and Mukono Districts of Uganda
•Descargar como PPTX, PDF•
1 recomendación•615 vistas

Poster prepared by Peter Lule for the 6th All Africa Conference on Animal Agriculture, Nairobi, Kenya, 27-30 October 2014
Recomendados

Recomendados
Más contenido relacionado
Similar a Analysis of the economic performance of peri-urban and rural smallholder pig producer enterprises in Masaka and Mukono Districts of Uganda
Similar a Analysis of the economic performance of peri-urban and rural smallholder pig producer enterprises in Masaka and Mukono Districts of Uganda (20)
Más de ILRI
Más de ILRI (20)
Último
Último (20)
Analysis of the economic performance of peri-urban and rural smallholder pig producer enterprises in Masaka and Mukono Districts of Uganda
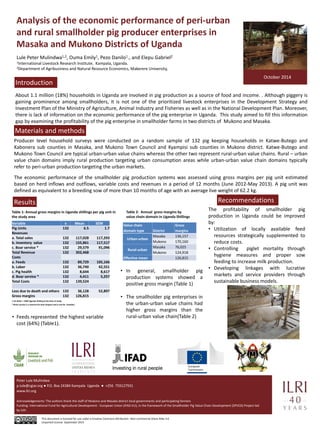
- 1. Analysis of the economic performance of peri-urban and rural smallholder pig producer enterprises in Masaka and Mukono Districts of Uganda Lule Peter Mulindwa1,2, Ouma Emily1, Pezo Danilo1., and Elepu Gabriel2 1International Livestock Research Institute, Kampala, Uganda. 2Department of Agribusiness and Natural Resource Economics, Makerere University, About 1.1 million (18%) households in Uganda are involved in pig production as a source of food and income. . Although piggery is gaining prominence among smallholders, it is not one of the prioritized livestock enterprises in the Development Strategy and Investment Plan of the Ministry of Agriculture, Animal Industry and Fisheries as well as in the National Development Plan. Moreover, there is lack of information on the economic performance of the pig enterprise in Uganda. This study aimed to fill this information gap by examining the profitability of the pig enterprise in smallholder farms in two districts of Mukono and Masaka. • In general, smallholder pig production systems showed a positive gross margin (Table 1) • The smallholder pig enterprises in the urban-urban value chains had higher gross margins than the rural-urban value chain(Table 2) Peter Lule Mulindwa p.lule@cgiar.org ● P.O. Box 24384 Kampala Uganda ● +256 759127931 www.ilri.org Acknowledgements: The authors thank the staff of Mukono and Masaka district local governments and participating farmers Funding: International Fund for Agricultural Development - European Union (IFAD-EU), in the framework of the Smallholder Pig Value Chain Development (SPVCD) Project led by ILRI . This document is licensed for use under a Creative Commons Attribution –Non commercial-Share Alike 3.0 Unported License September 2014 October 2014 Producer level household surveys were conducted on a random sample of 132 pig keeping households in Katwe-Butego and Kabonera sub counties in Masaka, and Mukono Town Council and Kyampisi sub counties in Mukono district. Katwe-Butego and Mukono Town Council are typical urban-urban value chains whereas the other two represent rural-urban value chains. Rural – urban value chain domains imply rural production targeting urban consumption areas while urban-urban value chain domains typically refer to peri-urban production targeting the urban markets. The economic performance of the smallholder pig production systems was assessed using gross margins per pig unit estimated based on herd inflows and outflows, variable costs and revenues in a period of 12 months (June 2012-May 2013). A pig unit was defined as equivalent to a breeding sow of more than 10 months of age with an average live weight of 62.2 kg. Introduction Materials and methods Results Recommendations Table 1: Annual gross margins in Uganda shillings per pig unit in the study area 1 US dollar = 2500 Uganda shilling at the time of study Value chain domain type District Gross margins Urban-urban Masaka 136,157 Mukono 170,160 Rural-urban Masaka 76,025 Mukono 124,918 Effective mean 126,815 Table 2: Annual gross margins by value chain domain in Uganda Shillings The profitability of smallholder pig production in Uganda could be improved by: • Utilization of locally available feed resources strategically supplemented to reduce costs. • Controlling piglet mortality through hygiene measures and proper sow feeding to increase milk production. • Developing linkages with lucrative markets and service providers through sustainable business models. Variable n Mean SEM Pig Units 132 6.5 1.7 Revenues a. Total sales 132 117,028 117,293 b. Inventory value 132 155,861 117,517 c. Boar service * 132 29,579 91,096 Total Revenue 132 302,468 Costs a. Feeds 132 89,729 105,166 b. Labor 132 36,740 42,551 c. Pig health 132 8,644 8,617 d. Boar service * 132 4,411 5,257 Total Costs 132 139,524 Loss due to death and others 132 36,128 52,897 Gross margins 132 126,815 • Feeds represented the highest variable cost (64%) (Table1). * Boars service is a revenue for boar keepers and a cost for breeders