New tools to characterize feed resource availability and identify feed management options in the Ethiopian Highlands
•
0 recomendaciones•467 vistas

This document discusses two tools, FEAST and Techfit, that are being used to characterize livestock feed resources and identify options to improve feed management in Ethiopia. FEAST provides detailed information on the availability and use of different feed sources. Techfit then analyzes the current feed base and proposes management practices and technologies that could strengthen livestock production based on the FEAST analysis. The document provides an example analysis using these tools that compared feed use between households with strong and weak livelihoods and identified promising options for improving feeding, such as feeding home-grown legume residues.
Recomendados

Recomendados
Más contenido relacionado
La actualidad más candente
La actualidad más candente (15)
Similar a New tools to characterize feed resource availability and identify feed management options in the Ethiopian Highlands
Similar a New tools to characterize feed resource availability and identify feed management options in the Ethiopian Highlands (20)
Más de ILRI
Más de ILRI (20)
Último
Último (20)
New tools to characterize feed resource availability and identify feed management options in the Ethiopian Highlands
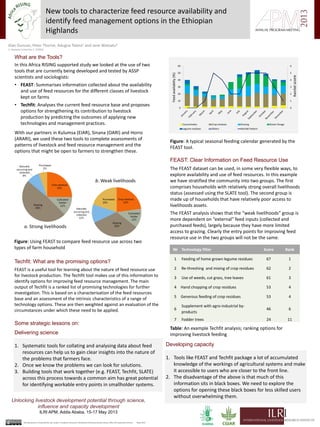
- 1. Unlocking livestock development potential through science, influence and capacity development ILRI APM, Addis Ababa, 15-17 May 2013 Developing capacity New tools to characterize feed resource availability and identify feed management options in the Ethiopian Highlands This document is licensed for use under a Creative Commons Attribution-Noncommercial-Share Alike 3.0 Unported Licence May 2013 Some strategic lessons on: 1. Tools like FEAST and Techfit package a lot of accumulated knowledge of the workings of agricultural systems and make it accessible to users who are closer to the front line. 2. The disadvantage of the above is that much of this information sits in black boxes. We need to explore the options for opening these black boxes for less skilled users without overwhelming them. FEAST is a useful tool for learning about the nature of feed resource use for livestock production. The Techfit tool makes use of this information to identify options for improving feed resource management. The main output of Techfit is a ranked list of promising technologies for further investigation. This is based on a characterisation of the feed resources base and an assessment of the intrinsic characteristics of a range of technology options. These are then weighted against an evaluation of the circumstances under which these need to be applied. Alan Duncan, Peter Thorne, Adugna Tolera1 and Jane Wamatu2 1. Hawassa University 2. ICARDA Delivering science The FEAST dataset can be used, in some very flexible ways, to explore availability and use of feed resources. In this example we have stratified the community into two groups. The first comprises households with relatively strong overall livelihoods status (assessed using the SLATE tool). The second group is made up of households that have relatively poor access to livelihoods assets. The FEAST analysis shows that the “weak livelihoods” group is more dependent on “external” feed inputs (collected and purchased feeds), largely because they have more limited access to grazing. Clearly the entry points for improving feed resource use in the two groups will not be the same. 1. Systematic tools for collating and analysing data about feed resources can help us to gain clear insights into the nature of the problems that farmers face. 2. Once we know the problems we can look for solutions. 3. Building tools that work together (e.g. FEAST, Techfit, SLATE) across this process towards a common aim has great potential for identifying workable entry points in smallholder systems. In this Africa RISING supported study we looked at the use of two tools that are currently being developed and tested by ASSP scientists and sociologists: • FEAST: Summarises information collected about the availability and use of feed resources for the different classes of livestock kept on farms • Techfit: Analyses the current feed resource base and proposes options for strengthening its contribution to livestock production by predicting the outcomes of applying new technologies and management practices. With our partners in Kulumsa (EIAR), Sinana (OARI) and Horro (ARARI), we used these two tools to complete assessments of patterns of livestock and feed resource management and the options that might be open to farmers to strengthen these. What are the Tools? FEAST: Clear Information on Feed Resource Use Techfit: What are the promising options? Cluster characteristics 0 1 2 3 4 5 6 0 10 20 30 40 50 60 Feedavailablity(%) Concentrates Crop residues Grazing Green forage Legume residues Others Rainfall Pattern Rainfallscore Figure: A typical seasonal feeding calendar generated by the FEAST tool. Crop residues 25% Cultivated fodder 12%Grazing 49% Naturally occurring and collected 9% Purchased 5% Crop residues 23% Cultivated fodder 12% Grazing 33% Naturally occurring and collected 12% Purchased 20% Figure: Using FEAST to compare feed resource use across two types of farm household a. Strong livelihoods b. Weak livelihoods № Technology filter Score Rank 1 Feeding of home grown legume residues 67 1 2 Re-threshing and mixing of crop residues 62 2 3 Use of weeds, cut grass, tree leaves 61 3 4 Hand chopping of crop residues 53 4 5 Generous feeding of crop residues 53 4 6 Supplement with agro-industrial by- products 46 6 7 Fodder trees 24 11 Table: An example Techfit analysis; ranking options for improving livestock feeding